1201
Lower ADC Values are Associated with Annual Loss of Renal Function in Individuals with Advanced CKD1Northwestern University, Chicago, IL, United States, 2NorthShore University HealthSystem, Evanston, IL, United States, 3NIDDK, Bethesda, MD, United States
Synopsis
We present data from a multi-center trial involving patients with advanced CKD (stage 3B & 4) with multiple etiologies. BOLD and Diffusion MRI data was acquired at baseline and repeated 1 year later. Renal function was monitored on a quarterly basis to evaluate progression. Our data show for the first time a strong association of ADC with annual loss of renal function. Further ADC values showed differences when individuals were stratified by diabetes and progression status. BOLD MRI did not demonstrate similar association.
INTRODUCTION
Over the last decade, the role of chronic hypoxia in the progression of chronic kidney disease (CKD) has gained attention mostly based on pre-clinical data [1]. Two recent reports have demonstrated lower cortical oxygenation as evaluated by BOLD MRI to be associated with annual loss of renal function [2,3]. Both these studies included CKD at all stages.
Here, we present data from a multi-site study with a large number of subjects with advanced CKD (stage 3.b and 4) studied with both BOLD and diffusion MRI twice one year apart.
MATERIALS AND METHODS
Subjects: All procedures were performed with approval from the institutional review boards and written subject consent prior to enrollment. Subjects with stage 3B & 4 CKD with multiple etiologies (N: 127, age=65±12 years; eGFR=30±12 ml/min/1.73m2) participated at six different sites within United States. Eighty seven participants returned for the 12 month follow-up (F12) renal functional MRI scan to be included in this longitudinal study. Serum creatinine was measured at baseline and at each subsequent quarterly follow-up visits. We used the creatinine-based Chronic Kidney Disease Epidemiology Collaboration equation to calculate eGFR [4].
MRI acquisition methods: MRI data was acquired on 3T whole body scanners (Siemens Healthcare, Erlangen, Germany). Imaging parameters: BOLD: mGRE sequence with TR 62ms, TE 3.09 to 30.53ms, 8 echoes, slice thickness 5mm. Acquisitions were made during breath-holding and in the coronal orientation. Diffusion MRI: Single-shot spin- echo Echo-planar-imaging sequence: TR = 3000 ms, TE = 78 ms, diffusion weighting factor b = 200, 300, 500, 700, 1000 s/mm2, slice thickness 5mm; FOV=400 mm, Matrix =192x192, # averages = 5. Acquisitions made while free breathing and in coronal plane.
MRI analysis methods: Regions of interest (ROIs) were manually defined using a custom image-processing library written in Python. For BOLD MRI data, ROIs were placed in the cortex, medulla, and whole kidney respectively [5]. For ADC data, ROIs were placed in the cortex only.
Statistical methods: We evaluated changes in renal functional MRI measurements from baseline to F12 using Student’s T-test. We evaluated the association of renal functional MRI measurements at baseline and F12 with annual loss in renal function (eGFR slope) using linear regression analysis.
RESULTS
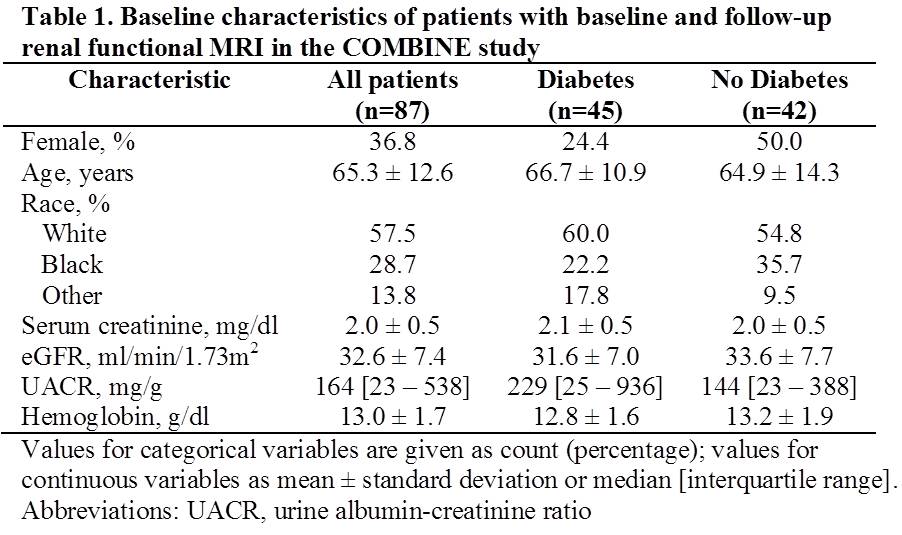
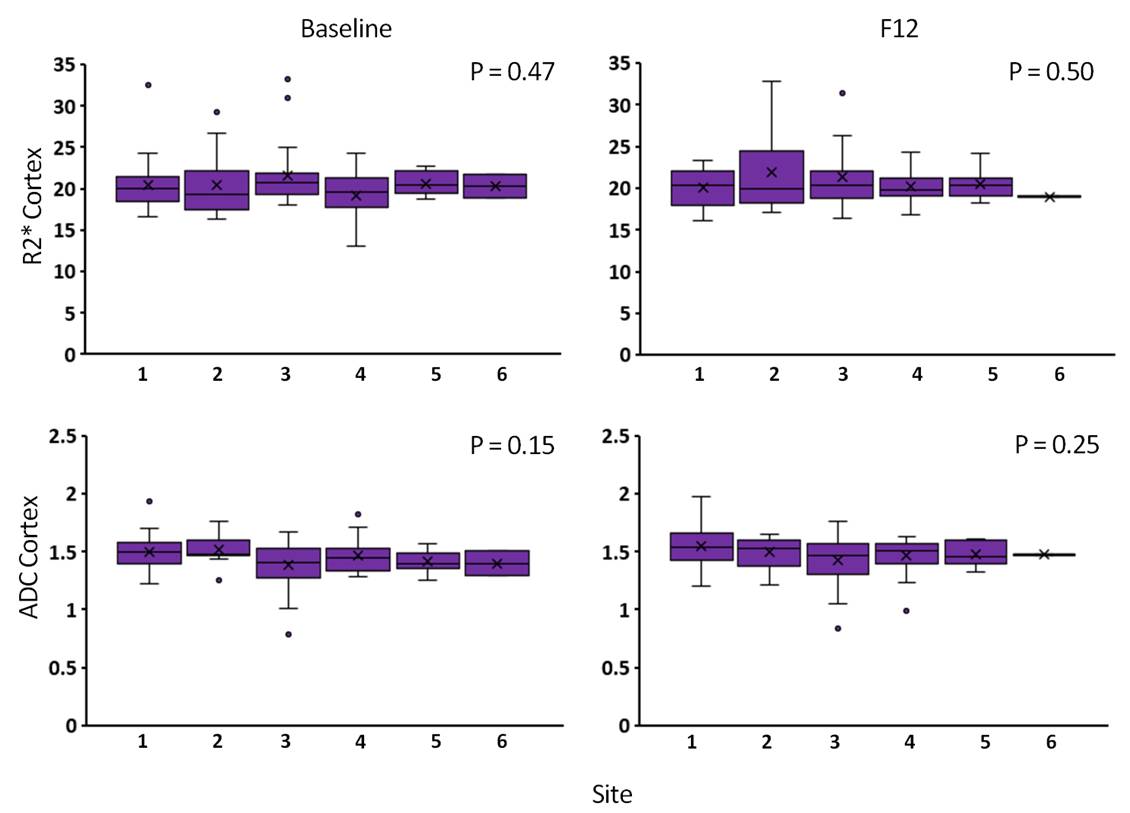
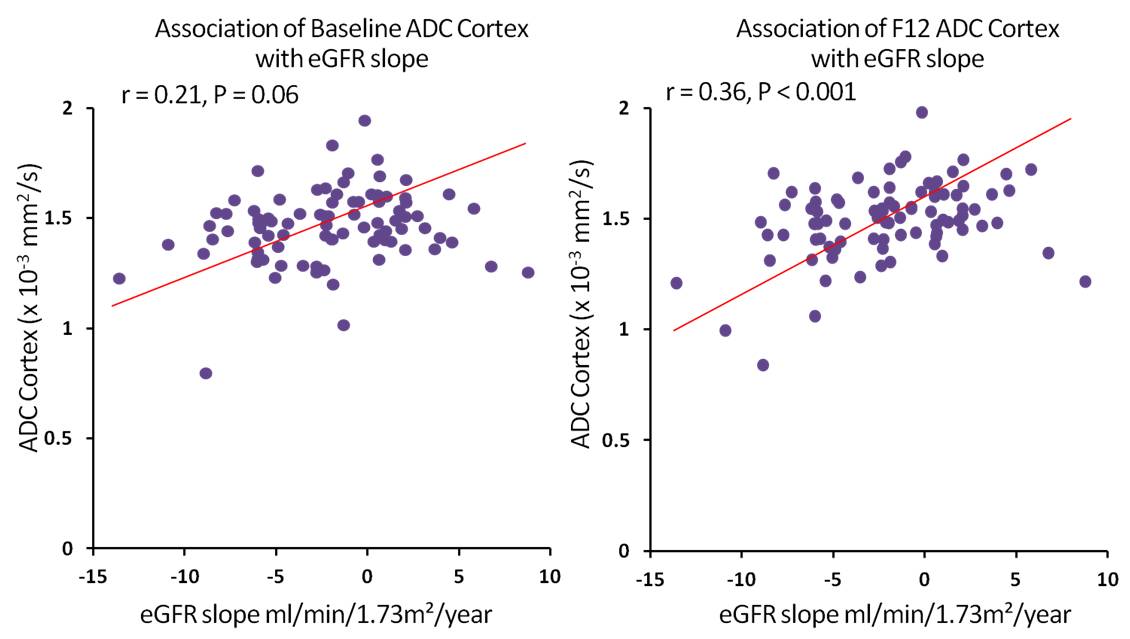
Table 1 summarizes the baseline characteristics of all the participants. Figure 1 summarizes the differences between R2* and ADC measurements across sites both at baseline and F12 visits. Figure 2 shows the plots of ADC vs. annual loss of renal function both at baseline and F12 visits. Table 2 summarizes the R2* and ADC measurements in all subjects and Table 3 when stratified as participants with diabetes vs. no diabetes and rapid-progressors (annual loss in eGFR > 3 ml/min) vs. non-rapid-progressors.DISCUSSION AND CONCLUSION
We present the results from the largest study to date including longitudinal BOLD and Diffusion MRI data in a multi-racial CKD population across multiple clinical sites. As seen from Figure 1, there was no difference between sites either on R2* or ADC and at either visits. Baseline ADC cortex values positively correlated with annual eGFR slope (r = 0.21, p = 0.06), but with marginal statistical significance. At F12 on the other hand, ADC cortex values significantly correlated with annual eGFR slope (r = 0.36, p < 0.001) (Figure 2).
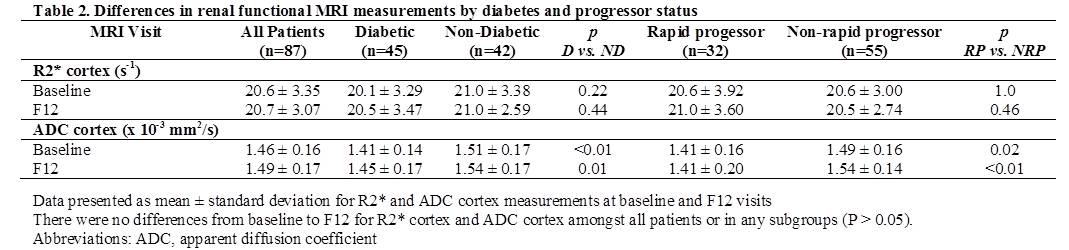
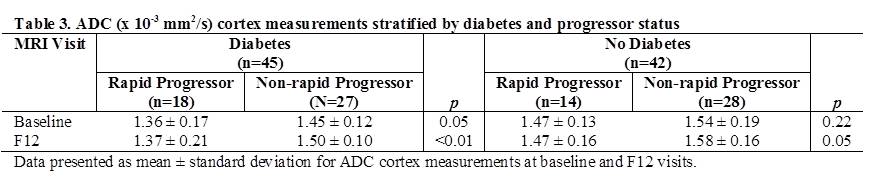
There were no differences in ADC cortex values from baseline to F12 in all patients or in subgroups stratified by diabetes and progressor status (Table 2). Participants with diabetes had lower ADC values at baseline (p < 0.01) and F12 (p = 0.01). In addition, stratification by progressor status demonstrated that rapid progressors had lower ADC cortex values at baseline (p = 0.02) and F12 (p < 0.01) (Table 2). Within the participants with diabetes, rapid progressors had marginally lower ADC values at baseline (1.36 ± 0.17 vs 1.45 ± 0.12 x 10⁻³ mm2/s, p = 0.05) than non-rapid progressorse. At F12 on the other hand, rapid progressors had significantly lower ADC values than non-rapid progressors (1.37 ± 0.21 vs 1.50 ± 0.10 x 10⁻³ mm2/s, p < 0.01) (Table 3).
This is the first study to report reduced ADC values in patients with advanced CKD and demonstrate differences in individuals with diabetes and rapid progression. The ADC values reported here are consistent with the slow component reported using bi-exponential fits [6] which have been shown to be associated with histological assessment of fibrosis. These observations combined with other recent reports support a role for multi-parametric MRI in identifying individuals with progressive CKD, which remains to be a unmet need.
Acknowledgements
Work supported in part by grant from the National Institutes of Health, R01-DK093793 (PVP) and R01DK102438 (TI). The COMBINE study is supported by grants U01DK099877, U01DK097093, U01DK099930, U01DK099933, and U01DK099924.References
1. Fine LG, Orphanides C, Norman JT (1998) Progressive renal disease: the chronic hypoxia hypothesis. Kidney Int Suppl 65: S74-78.
2. Pruijm M, Milani B, Pivin E, Podhajska A, Vogt B, Stuber M, et al. (2018) Reduced cortical oxygenation predicts a progressive decline of renal function in patients with chronic kidney disease. Kidney Int 93: 932-940.
3. Zhou H, Yang M, Jiang Z, Ding J, Di J, Cui L (2018) Renal Hypoxia: An Important Prognostic Marker in Patients with Chronic Kidney Disease. Am J Nephrol 48: 46-55.
4. Levey A, Stevens L, Schmid C, Zhang Y, 3rd CA, Feldman H, et al. (2009) A new equation to estimate glomerular filtration rate. Ann Intern Med 150: 604-612.
5. Thacker JM, Li LP, Li W, Zhou Y, Sprague SM, Prasad PV (2015) Renal Blood Oxygenation Level-Dependent Magnetic Resonance Imaging: A Sensitive and Objective Analysis. Invest Radiol 50: 821-827.
6. Mao W, Zhou J, Zeng M, Ding Y, Qu L, Chen C, et al. (2018) Intravoxel incoherent motion diffusion-weighted imaging for the assessment of renal fibrosis of chronic kidney disease: A preliminary study. Magn Reson Imaging 47: 118-124.
7. Inoue T, Kozawa E, Okada H, Inukai K, Watanabe S, Kikuta T, et al. (2011) Noninvasive evaluation of kidney hypoxia and fibrosis using magnetic resonance imaging. J Am Soc Nephrol 22: 1429-1434.
8. Xu X, Fang W, Ling H, Chai W, Chen K (2010) Diffusion-weighted MR imaging of kidneys in patients with chronic kidney disease: initial study. Eur Radiol 20: 978-983.
9. Zhao J, Wang ZJ, Liu M, Zhu J, Zhang X, Zhang T, et al. (2014) Assessment of renal fibrosis in chronic kidney disease using diffusion-weighted MRI. Clin Radiol 69: 1117-1122.
10. Togao O, Doi S, Kuro-o M, Masaki T, Yorioka N, Takahashi M (2010) Assessment of renal fibrosis with diffusion-weighted MR imaging: study with murine model of unilateral ureteral obstruction. Radiology 255: 772-780.
Figures