1199
The multi-centre iBEAt study: A comprehensive multi-parametric MR imaging biomarker panel for Diabetic Kidney Disease1Leeds Imaging Biomarkers Group, Biomedical Imaging Science Department, LICAMM, University of Leeds, Leeds, United Kingdom, 2Biomedical Imaging Science Department, LICAMM, University of Leeds, Leeds, United Kingdom, 3University of Leeds, Leeds, United Kingdom, 4University of Turku, Turku, Finland, 5Swiss Institute of Bioinformatics, Lausanne, Switzerland, 6Novo Nordisk, Bagsværd, Denmark, 7University of Exeter, Exeter, United Kingdom, 8University of Bari, Bari, Italy, 9Siemens Healthcare GmbH, Erlangen, Germany, 10University of Bordeaux, Bordeaux, France
Synopsis
There is a major clinical need for better biomarkers to identify Diabetic Kidney Disease (DKD) patients at risk of progression. iBEAt is a prospective multi-centre cohort study in 500 patients aiming to determine if MRI biomarkers can provide prediction of progression. We have developed a dedicated MRI biomarker panel for iBEAt interrogating body composition, renal morphology and tissue structure, hemodynamics and filtration. Here we present the details as well as example data and preliminary results on the ISMRM/NIST phantom, and on healthy volunteers.
INTRODUCTION
There is a major clinical need for better biomarkers to identify Diabetic Kidney Disease (DKD) patients at risk of progression, but biomarkers derived from blood- and urine have so far proven inadequate1. iBEAt is a large international cohort study in 500 patients aiming to determine if MRI biomarkers can improve predictions of renal function decline. In order to address the question, we have developed a dedicated MRI biomarker panel interrogating body composition, renal morphology and tissue structure, hemodynamics and filtration.
Aim. We present the final iBEAt MRI protocol and the biomarker panel along with example data and preliminary results on the ISMRM/NIST phantom, and on healthy volunteers, measured as part of the iterative protocol development process.
METHODS
iBEAT study design. This prospective observational cohort study (ClinicalTrials.gov Identifier: NCT03716401) consists of five recruitment sites (Exeter, Leeds, Bari, Bordeaux, Turku), central coordinating site (Leeds), central biobanking & biofluids analysis site (Lund), central data storage site (Swiss Institute of Bioinformatics), and a central MR image processing and quality assurance site (Leeds) assessing 500 patients (100 per site) annually for a total of 4 years. At each patient visit, demographics, clinical, family and medication history, blood, and urine will be collected. Multi-parametric MRI and Ultrasound (US) will be collected at baseline with a 2nd MRI in Bordeaux and a 2nd US in Exeter and Bordeaux performed after 2 years. Each site will acquire additional data to address ancillary objectives: 1) validation of MRI and US biomarkers against renal histopathology (Bari); (2) validation of Arterial Spin Labeling (ASL) and Dynamic Contrast Enhanced (DCE) MRI against H2O-PET (Turku); (3) correlation of MRI & US with glycocalyx and microvascular assessments (Exeter); (4) progression monitoring of MRI and US biomarkers (Bordeaux); (5) added value of combined Tractography and 3D DCE-MRI (Leeds).
iBEAt MRI protocol development. A multi-parametric reference MRI protocol was developed iteratively in Leeds using the ISMRM/NIST phantom2 and healthy volunteers on a MAGNETOM Prisma 3T (Siemens Healthcare GmbH, Erlangen, Germany) and then translated to two 3T Philips scanners in other study sites (Achieva PET-MRI, Turku; Ingenia, Bari).
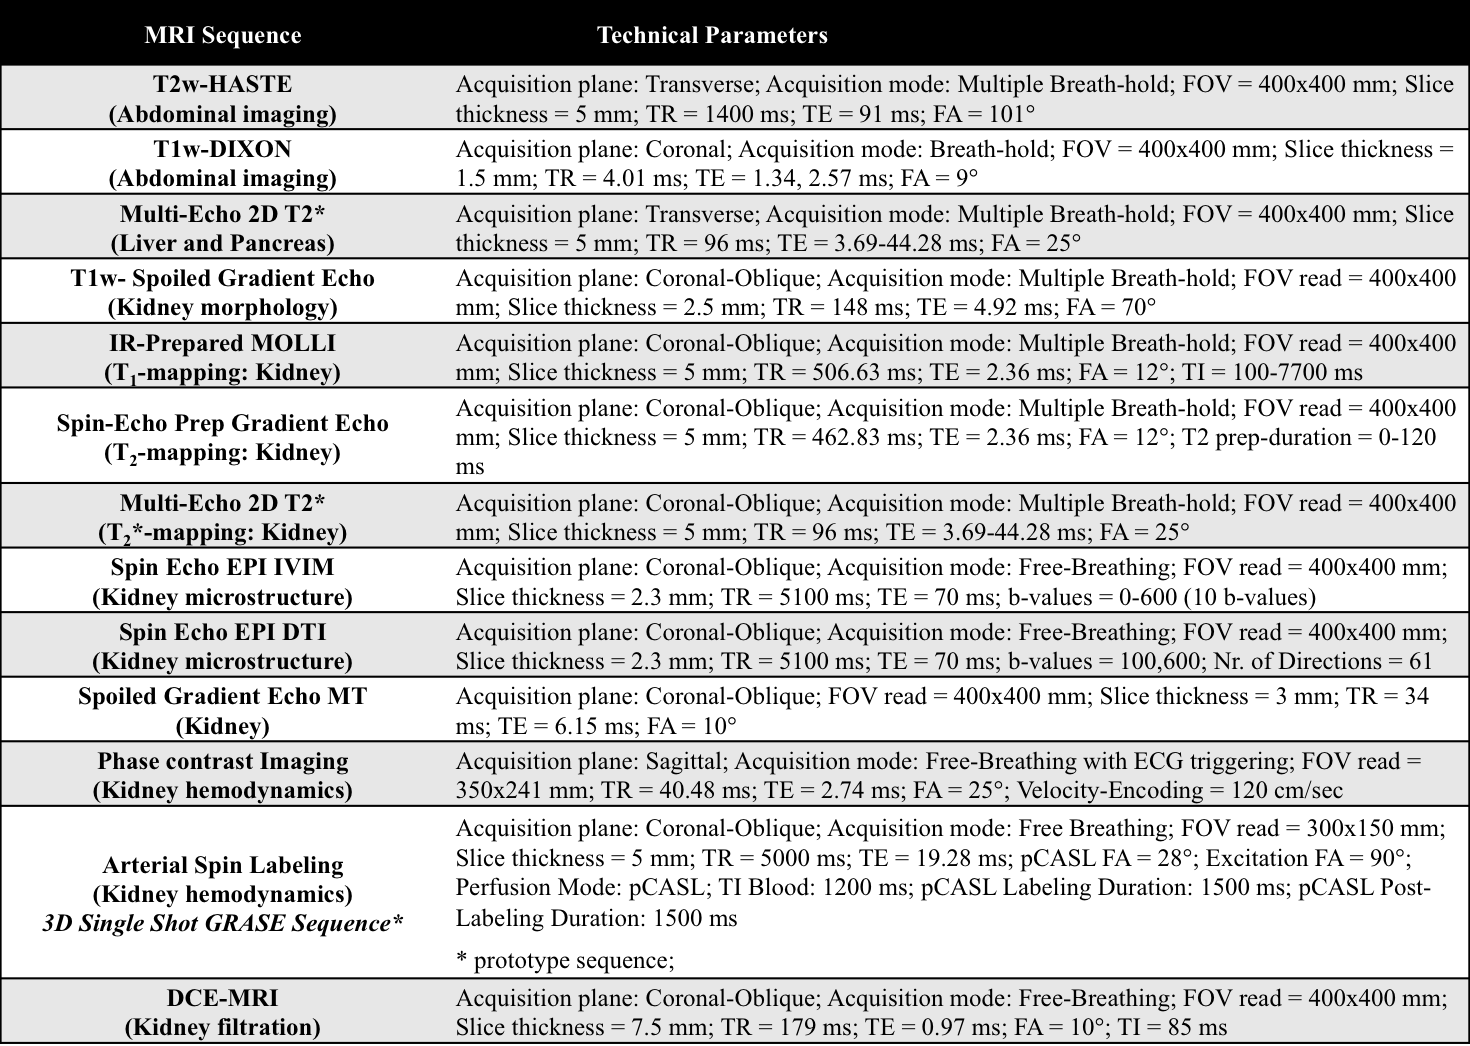
iBEAt MRI acquisition protocol. The study MRI protocol (Table 1) consists of 2 localizers and 13 MRI sequences that will run for approximately 1 hour. The whole-abdomen T2w-HASTE will be acquired as a reference sequence followed by the T1w-DIXON, multi-echo multi-slice T2* of pancreas and liver, high-resolution T1w-MRI for cortical volumetry, multi-slice renal T1-mapping, T2-mapping, T2*-mapping, magnetization transfer ratio (MTR), ASL, DTI/Tractography, DCE-MRI, and post-contrast T1w-DIXON. Additional sequences such as IVIM and phase contrast will be run in substudies.
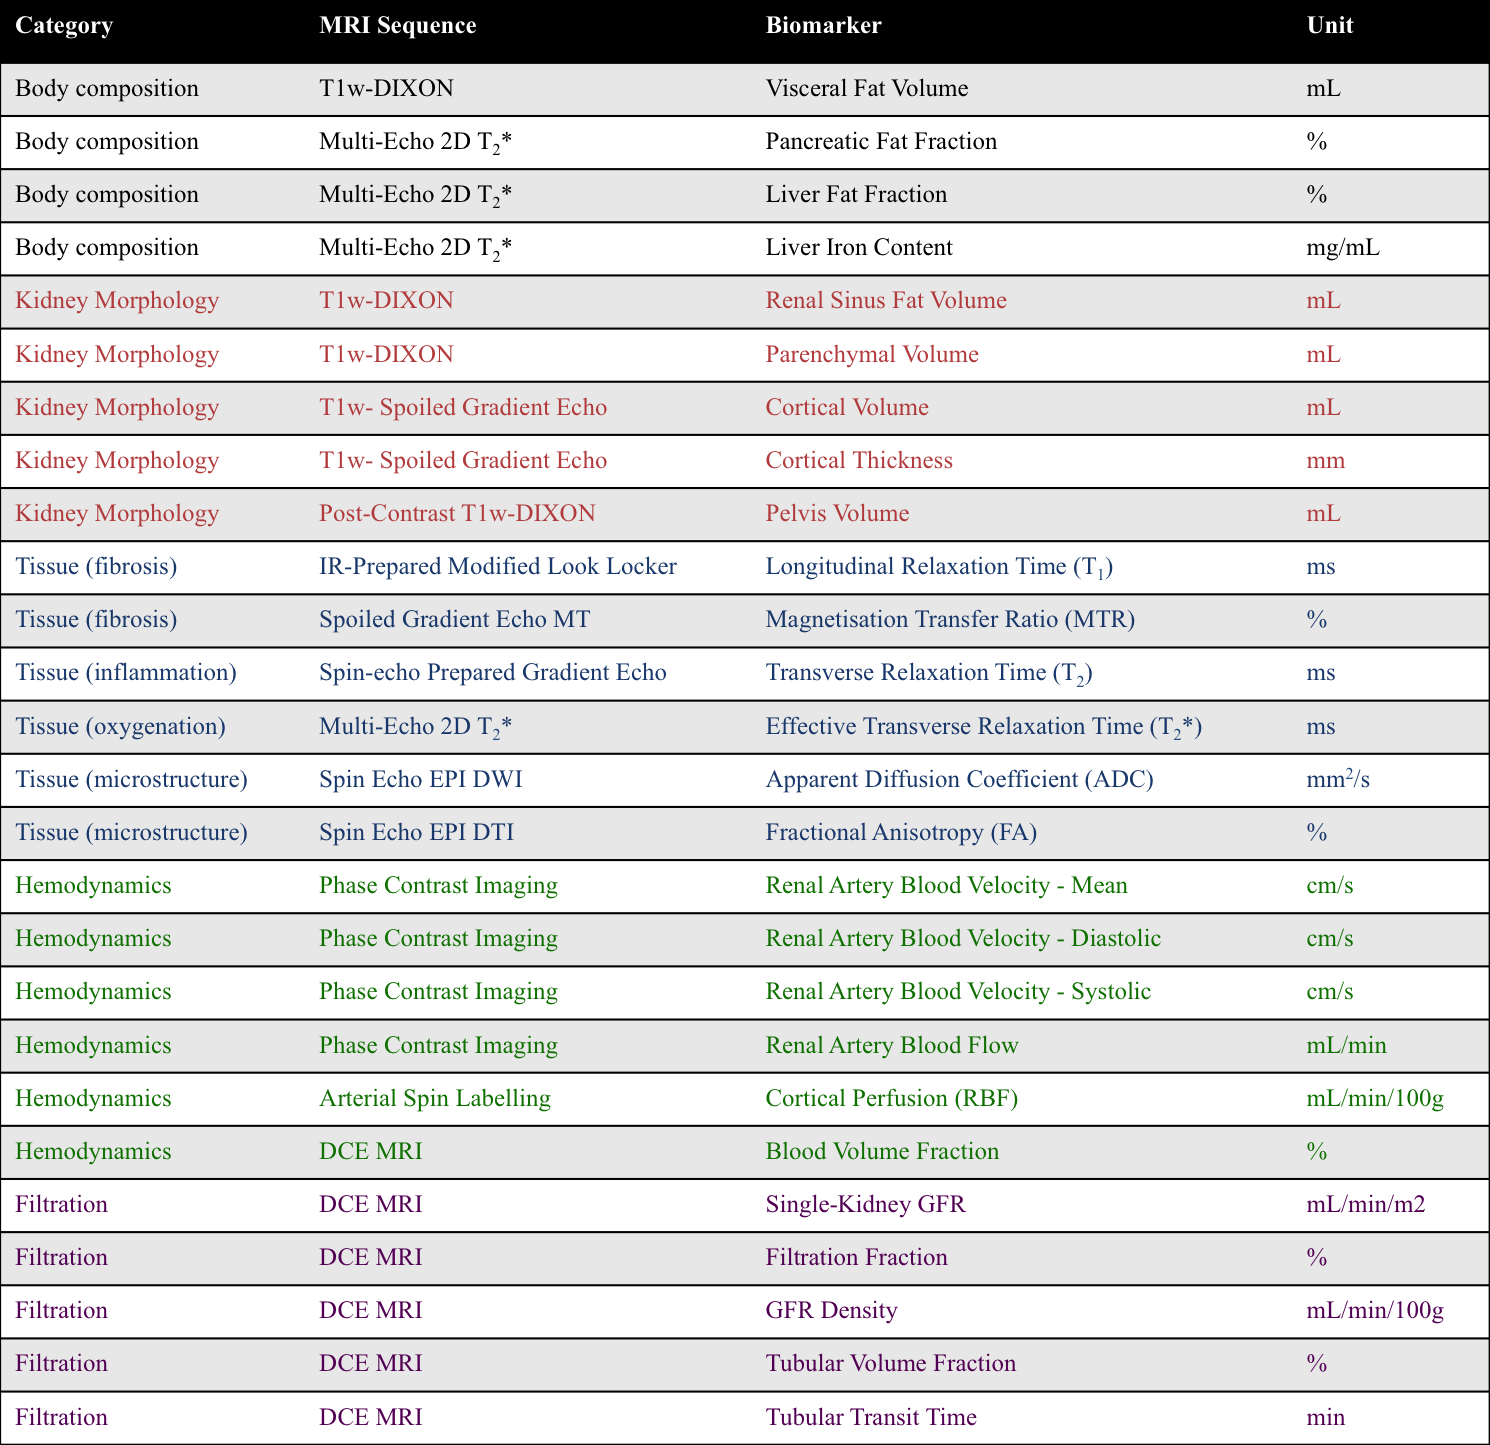
iBEAt MRI biomarker list. The following primary and secondary prognostic imaging biomarkers will be measured: Body composition (Visceral Fat Volume (ml), Pancreatic Fat Fraction (%), etc.); Renal morphology (Renal Pelvic Volume (ml), Parenchymal Volume (ml), etc.); Renal tissue structure (T1 (ms), T2* (ms), etc.); Renal hemodynamics (Cortical Perfusion (ml/min/100g), Blood Volume Fraction (%), etc.); Kidney filtration (Single-Kidney GFR (ml/min/m2), Filtration Fraction (%), etc.). A full list of the MRI sequences and their corresponding imaging biomarkers has been summarized in Table 2.
iBEAt prototype processing. The MRI data acquired during the protocol development phase were analysed with a prototype software tool (under development) based on MATLAB3. Manual segmentations of whole kidney were defined in ImageJ4 and cortex/medulla values were extracted from small circular ROIs. Model-fitting was performed in MATLAB using standard models for all biomarkers.
RESULTS
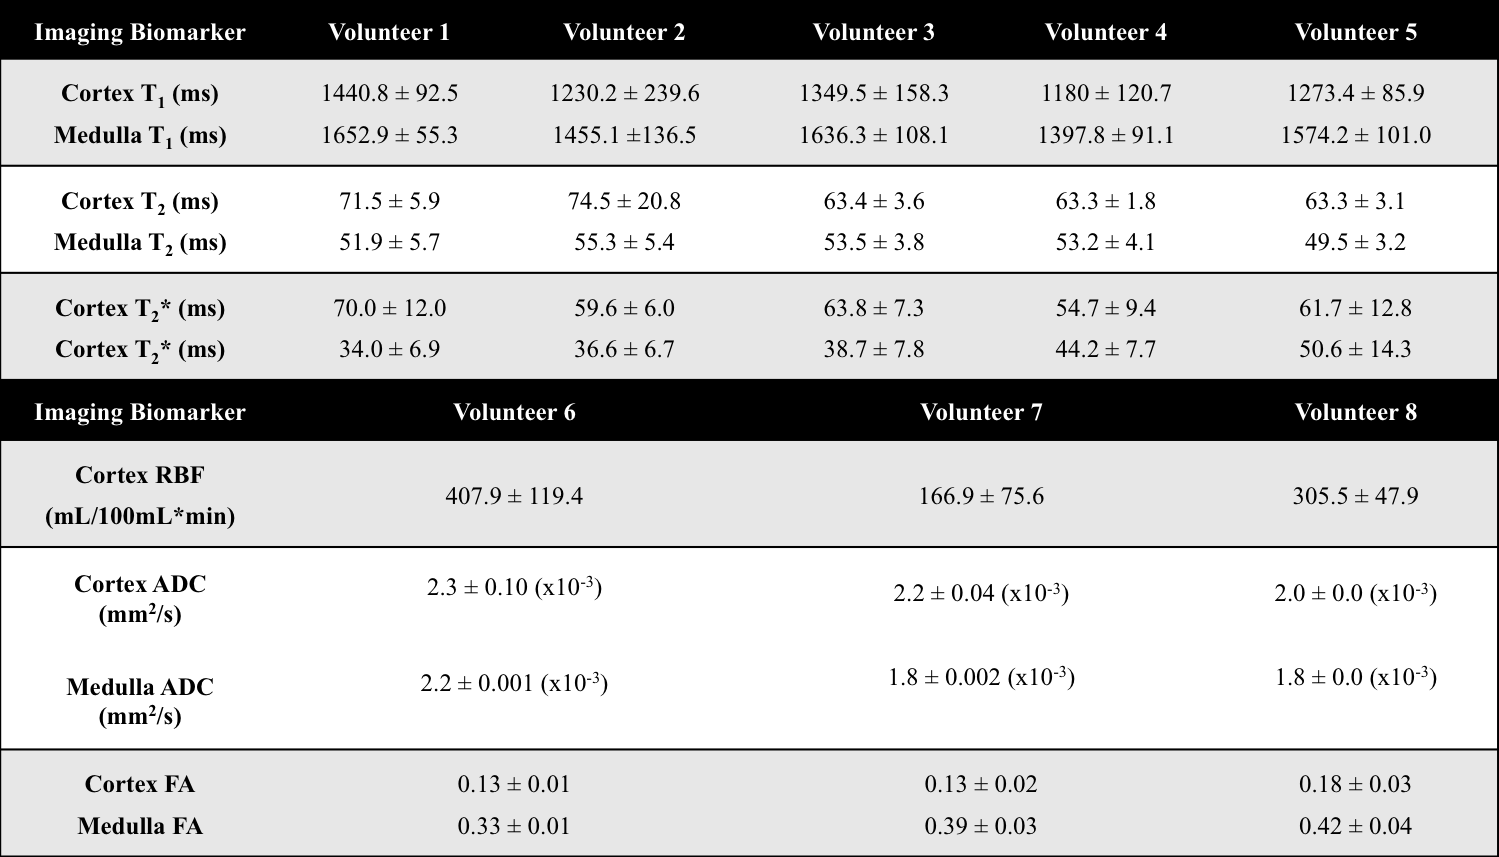
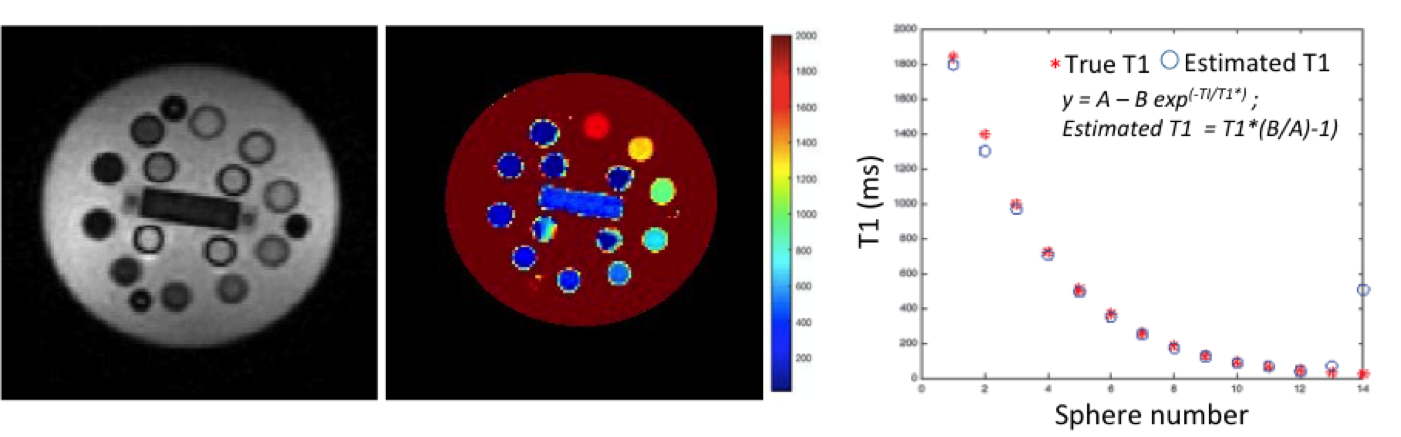
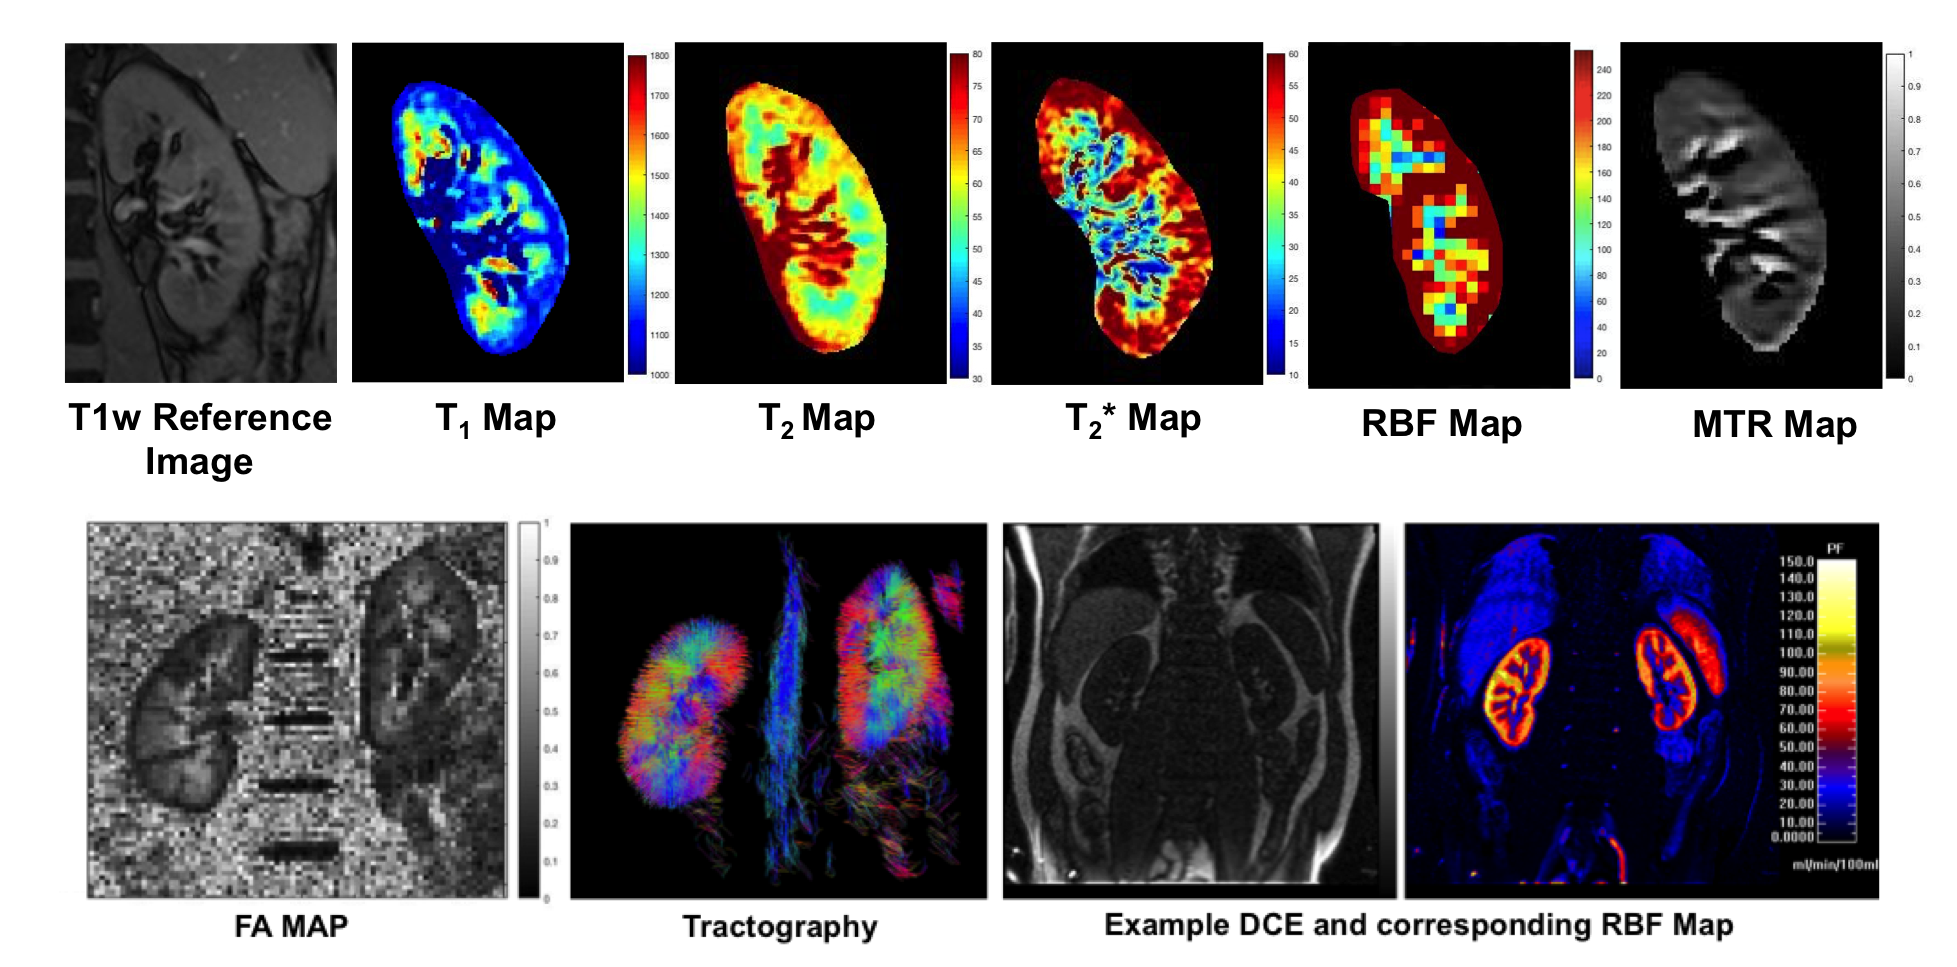
We present preliminary results from data acquired as part of the sequence setup process on the reference scanner in Leeds. Figure 1 shows validation of T1 values from IR-prepared MOLLI sequence on the ISMRM/NIST phantom using reference T1 values provided by the vendor. Figure 2 shows quantitative maps of kidney on healthy volunteers. Mean values of renal compartment T1, T2, T2*, RBF, Apparent Diffusion Coefficient (ADC), and Fractional Anisotropy (FA) are summarized in Table 3.OUTLOOK
Preliminary results on the ISMRM/NIST phantom and healthy volunteers using the iBEAt MRI protocol show the feasibility of this multi-parametric MRI study. The iBEAt MRI protocol is currently being translated to the other sites in the study (Exeter, Bordeaux: MAGNETOM Prisma 3 T (Siemens Healthcare GmbH, Erlangen, Germany); Bari: Philips). The study is recruiting in 2 sites since September 2018 and all sites are expected to be recruiting by spring 2019. Main results on the primary objective are expected by spring 2021.Acknowledgements
iBEAt study is part of the BEAt-DKD project. The BEAt-DKD project has received funding from the Innovative Medicines Initiative 2 Joint Undertaking under grant agreement No 115974. This Joint Undertaking receives support from the European Union’s Horizon 2020 research and innovation programme and EFPIA with JDRF. For a full list of BEAt-DKD partners, see www.beat-dkd.eu.References
- A Heinzel, et al. Validation of Plasma Biomarker Candidates for the Prediction of eGFR Decline in Patients With Type 2 Diabetes. Diabetes Care 2018; Sep; 41(9): 1947-1954
- K. E. Keenan, et al. Comparison of T1 measurement using ISMRM/NIST system phantom. ISMRM 2016.
- MATLAB: The MathWorks, Inc., Natick, Massachusetts, United States.
- Schneider, et al. NIH Image to ImageJ: 25 years of image analysis. Nature methods; 9(7): 671-675
Figures