1183
Autocalibrated multiband CAIPIRINHA with k-t-acceleration: Towards the complete spatio-temporal coverage of the heart motion in one single breath-hold1Physikalisch-Technische Bundesanstalt (PTB), Braunschweig and Berlin, Germany, 2Working Group on Cardiovascular Magnetic Resonance, Experimental and Clinical Research Center, a joint cooperation between the Charité Medical Faculty and the Max-Delbrück Center for Molecular Medicine, Berlin, Germany, 3Department of Radiology, Feinberg School of Medicine, Northwestern University, Chicago, IL, United States, 4Department of Biomedical Engineering, McCormick School of Engineering, Northwestern University, Chicago, IL, United States
Synopsis
Recent developments in cardiac multiband CAIPIRINHA with autocalibration allow the simultaneous acquisition and reconstruction of multiple slices in one breathhold. Nevertheless, applications such as high resolution multi-slice cine imaging, and multi-slice three-directional velocity encoding of the myocardium, are still hindered by excessive breathhold duration.
In this study, we combine autocalibrated multiband CAIPIRINHA with k-t-acceleration to substantially accelerate data acquisition. When applied to gradient-echo and phase-contrast imaging, our technique allowed cardiac cine acquisitions at high spatial resolution (1.1mm), and three-directional velocity encoding of the myocardium, to be acquired in one breath-hold of 18 heart-beats at 2 or 3 slices, simultaneously.
Introduction
Recent developments in cardiac multiband (MB) CAIPIRINHA1-4 with autocalibration5 allow the simultaneous acquisition and reconstruction of multiple slices in one single breathhold. Despite this, applications such as multi-slice cine imaging at high spatial resolution, and multi-slice three-directional velocity encoding of the myocardium6, are still hindered by an excessive breathhold duration or by the need for reproducible breathholds.5
The aim of this study was to further accelerate autocalibrated MB CAIPIRINHA for high resolution gradient-echo (GRE) imaging and for mapping the myocardial tissue motion. Therefore, k-t-acceleration7 was integrated into a prospectively ECG-triggered 2D cine phase-contrast (PC) sequence with autocalibrated MB. By using this technique, an up to 11-fold net acceleration was achieved.
Methods
Sequence development
In autocalibrated MB, the RF phases of the MB pulses of each excited slice are cycled in time so that consecutive cardiac phases can be grouped to generate slice-unaliased reference datasets at low temporal resolution5. This data can be used for explicit calculation of the coil sensitivities, or to calibrate slice and split-slice GRAPPA reconstruction kernels,8-9 yielding separated slices at the original, high temporal resolution.
k-t-acceleration was integrated into a time-resolved ECG-triggered MB CAIPIRINHA GRE sequence with autocalibration.5 Two different k-t-undersampling schemes with acceleration factor R=5 were chosen for MB2 and MB3, based on separate point-spread-function (PSF) simulations, which considered the effect of k-t-undersampling7 together with the spatio-temporal modulation of autocalibrated CAIPIRINHA5. The latter technique indeed imparts a slice-dependent shift in the x-f space7, which differs between the cases MB2 and MB3, and that needs to be considered when calculating actual PSFs.
The RF MB pulse patterns and the k-t-undersampling schemes are depicted in Fig.1. To ensure steady-state5, the acquisition order of the k-space lines is chosen such that only identical RF pulses are played within each heartbeat (see animation). Note that these schemes ensure acquisition of an autocalibrated signal (ACS) region serving both the k-t and MB reconstructions5,7,10 (see below).
Image acquisition
Data acquisition was performed at 3T (Magnetom Verio, Siemens, Germany) for two scan types:
- High resolution GRE cine: 7 healthy subjects were scanned in short-axis at 1.1mm in-plane resolution. Total acquisition employed 18 heartbeats, and the achieved temporal resolution was 28ms. Using 24 ACS lines, the net k-t-acceleration was 3.67, resulting in a total acceleration of 2x3.67=7.34 (MB2) and 3x3.67=11.01 (MB3). See Fig.2 for detailed sequence parameters.
- PC acquisitions: three‐directional velocity encoded data was acquired in short‐axis in 5 healthy subjects. The temporal resolution was 44.8ms. 12 ACS lines were acquired and total acquisition time employed 18 heartbeats. Again, the effective acceleration was 7.34 and 11.01 for MB2 and MB3. See Fig.4 for detailed sequence parameters.
For each MB dataset single band (SB) data with identical parameters was acquired for comparison.
Reconstruction
k-t and MB reconstructions were performed sequentially.
k-t reconstruction:
For the k-t part, the undersampled k-space obtained from the simultaneously excited slices was considered as belonging to one single aliased image. The k-t-reconstruction was performed using uniform and averaged PEAK GRAPPA kernels10 adapted to the cases MB2/MB3 shown in Fig.1.
MB reconstruction:
The separation of the bands was performed as in Ref.5 by computing time-averaged reference datasets directly from the k-t-reconstructed multiband GRE and PC data. Afterwards, slice-GRAPPA8 was employed to separate the slices in the GRE data, whereas split-slice GRAPPA9 was used for the PC data.
Left ventricular motion analysis
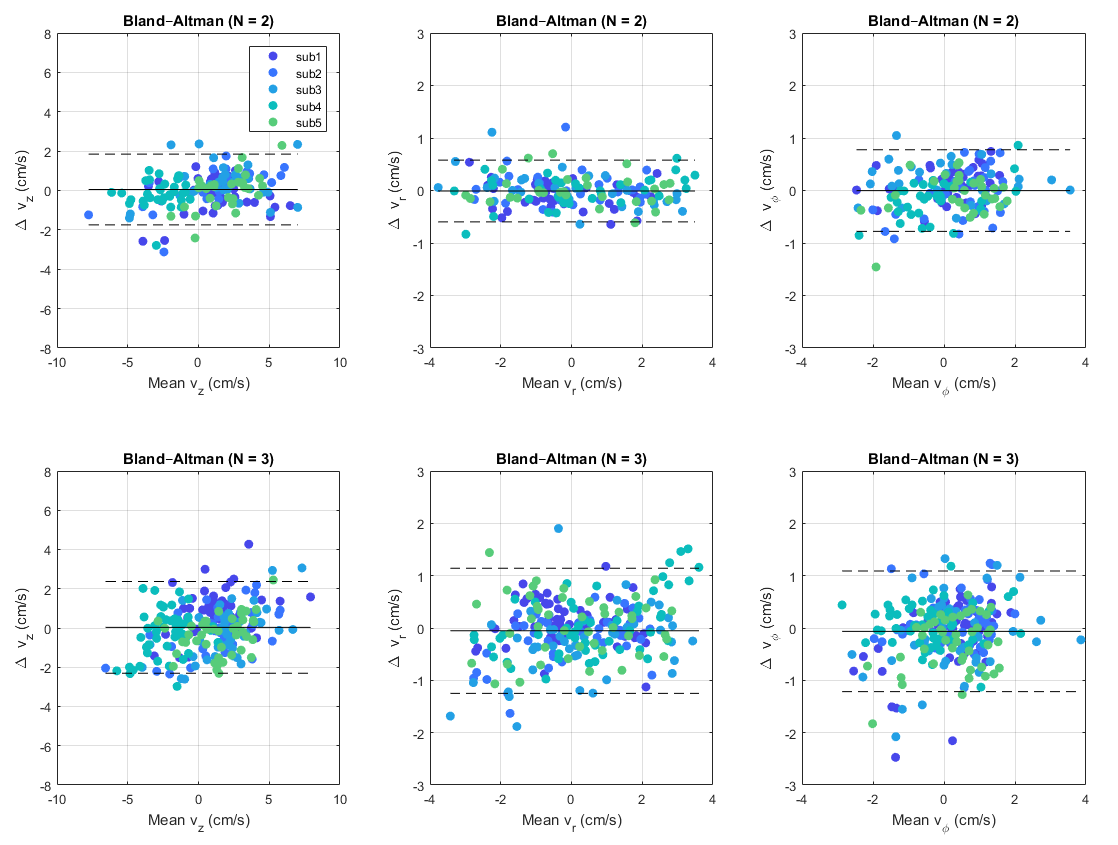
For both MB and SB PC data, the myocardial tissue motion of the left ventricle was analyzed using a custom MATLAB tool11, which allowed manual segmentation of the myocardium and eddy current correction. SB and MB motion traces averaged within the myocardial masks are compared by Bland-Altman plots. Wilcoxon signed rank tests and paired t-tests were performed between SB and MB data.Results
Successful band separation without residual aliasing artifacts were obtained in the GRE scans (Fig.2 and Fig3). Comparable image quality was obtained when comparing k-t MB and k-t SB acquisitions.
Myocardial velocities in longitudinal (vz), radial (vr) and tangential (vφ) directions11 for both SB and MB data were consistent with the literature6 (Fig.4). Although separate breath-holds were employed between these acquisitions, statistical tests confirmed that no significant differences were present when comparing SB with MB measurements (Fig.5).
Discussion and conclusion
A novel autocalibrated k-t-MB acquisition/reconstruction framework was presented that accelerates cardiac cine imaging up to 11-fold. This technique enabled acquiring cardiac cine images at 1.1mm in-plane resolution and three-directional velocity encoding of the myocardium tissue motion within a single breathhold of 18 heartbeats at 2 or 3 slice locations, simultaneously.
Acknowledgements
GF and JPB contributed equally to this work. GF and JPB designed the study. GF acquired and analyzed the data, wrote reconstruction scripts, performed the PSF simulations, wrote the abstract and prepared the figures. JPB designed the k-t acquisition scheme of Fig.1 that fulfills the steady state condition of autocalibrated MB5, implemented it into the sequence, and designed the PEAK GRAPPA reconstructions.
We would like to thank Bernd Jung for the k-t PEAK GRAPPA reconstruction code upon which our k-t-reconstruction framework was developed. We would like to thank Steen Moeller for the slice and split-slice GRAPPA reconstruction code.
References
1. Stäb D, Ritter CO, Breuer FA, Weng AM, Hahn D, Köstler H. CAIPIRINHA accelerated SSFP imaging. Magn Reson Med.2011;65:157‐164.10.
2. Schmitter S, Moeller S, Wu X, et al. Simultaneous multislice imaging in dynamic cardiac MRI at 7T using parallel transmission. Magn Reson Med. 2017;77:1010‐1020.
3. Price AN, Cordero‐Grande L, Malik SJ, Hajnal JV. Accelerated cine imaging of the heart using blipped multiband SSFP. In Proceedings of the 25th Annual Meeting of ISMRM, Honolulu, Hawaii; 2017. Abstract 0631.
4. Stäb D, Speier P. Gradient-controlled local Larmor adjustment (GC-LOLA) for simultaneous multislice bSSFP imaging with improved banding behavior. Magn Reson Med. 2018;00:1–11.https://doi.org/10.1002/mrm.27356.
5. Ferrazzi G, Bassenge JP,Wink C, et al. Autocalibrated multiband CAIPIRINHA with through‐time encoding: Proof of principle and application to cardiac tissue phase mapping. Magn Reson Med. 2018;00:1–15. https://doi.org/10.1002/mrm.27460.
6. Jung B, Foll D, Bottler P, Petersen S, Hennig J, Markl M. Detailed analysis of myocardial motion in volunteers and patients using high‐temporal‐resolution MR tissue phase mapping. J Magn Reson Imaging. 2006;24:1033‐1039.
7. Tsao J, Boesiger P, Pruessmann KP. k‐t BLAST and k‐t SENSE: dynamic MRI with high frame rate exploiting spatiotemporal correlations. Magn Reson Med. 2003;50:1031–1042.
8. Setsompop K, Gagoski BA, Polimeni JR, Witzel T, Wedeen VJ,Wald LL. Blipped‐controlled aliasing in parallel imaging for simultaneous multislice echo planar imaging with reduced g‐factor penalty. Magn Reson Med. 2012;67:1210‐1224.
9. Cauley SF, Polimeni JR, Bhat H, Wald LL, Setsompop K. Interslice leakage artifact reduction technique for simultaneous multislice acquisitions. Magn Reson Med. 2014;72:93‐102.
10. Jung B, Ullmann P, Honal M, et al. Parallel MRI with extended and averaged GRAPPA kernels (PEAK-GRAPPA): optimized spatiotemporal dynamic imaging. J Magn Reson Imaging. 2008;28(5):1226-32.
11. Ruh A, Li A, Robinson JD, et al. Assessment of regional myocardial velocities by tissue phase mapping and feature tracking in healthy children and pediatric patients with hypertrophic cardiomyopathy: a comparison study. In Proceedings of the 27th Joint Annual Meeting of ISMRM–ESMRMB, Paris, France; 2018. Abstract 0366.
Figures
Fig.2 Top: acquired SB k-t-accelerated data reconstructed using zero filling (left) and k-t PEAK GRAPPA reconstructions (right). Bottom: MB2 k-t-accelerated data with autocalibration reconstructed using zero filling (left), k-t-reconstruction (center) and k-t plus MB reconstructions (right). All GRE data was acquired using: FOV=400×300mm2, slice thickness=4.2/6mm, slice distance=20mm, resolution=1.1mm2, TR=7.3/7ms, TE=2.54/2.44 ms, flip angle=10°. For data reception, the anterior element of a cardiac coil (16 channels) together with a 12‐element spine coil were used. A vendor‐provided electrocardiogram device was used for cardiac triggering.
Fig.3 Same as Fig.2 for the case MB3.
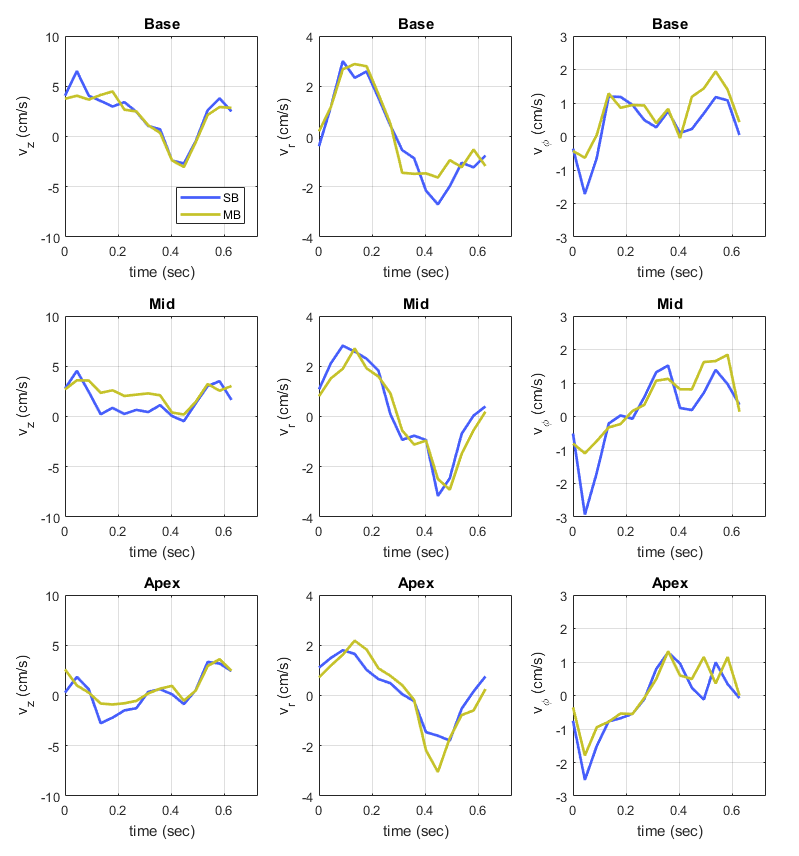
Fig.4 Slice-averaged longitudinal (vz), radial (vr) and tangential (vφ) velocities for the case MB3 in one exemplary subject plotted as a function of consecutive cardiac phases. Yellow time courses are measured with MB, whereas blue plots represent the SB equivalents.
All PC MB2 and MB3 datasets were acquired in short‐axis (base, mid, apex) in 5 healthy subjects using: FOV=400×300mm2, slice thickness=6mm, MB slice distance=20mm, resolution=2.3mm2, TR=5.6ms, TE=3.9ms, flip angle=10°. All data were acquired using three‐directional velocity encoding (VENCz=25cm/s, VENCx=VENCy=15cm/s).