1170
Comparison of Oscillating Steady State to GRE BOLD for fMRI1Electrical Engineering and Computer Science, University of Michigan, Ann Arbor, Ann Arbor, MI, United States, 2Biomedical Engineering, University of Michigan, Ann Arbor, Ann Arbor, MI, United States
Synopsis
The combination of a quadratic phase sequence with balanced gradients leads to an oscillating steady state (OSS) MRI signal with an average signal amplitude that is 2-3 times the Ernst angle GRE imaging. With signal phase varies with off-resonance making the resultant signal T2*-weighted and thus, suitable for BOLD fMRI. In this work, simulations of changes to the tissue T2*, as seen in fMRI, are carried out for OSS and compared to GRE. The OSS method is compared to GRE for high-resolution fMRI studies, demonstrating substantially higher activation counts as well as temporal SNR (tSNR).
Introduction
Because SNR is proportional to voxel volume and the functional units of the brain are on the order of 1 mm, high SNR is required for fMRI of these small brain structures. However, current methods for SNR improvement are limited. Increasing the number of coils in a head array suffers from diminishing returns as coil elements get smaller, particularly for deep brain structures, and higher field systems require a costly investment. In this work, we demonstrate a novel fMRI acquisition approach that improves the SNR by 2- to 3-fold over current leading methods. It focuses on a unique oscillating steady state source of signal that is substantially larger than standard GRE imaging, thereby offers a much higher SNR. Moreover, the signal is T2*-weighted and sensitive to the blood oxygenation (BOLD) signal, making it favorable for fMRI.Methods
Quadratic phase sequences in conjunction with a constant gradient dephasing are a well-recognized approach for establishing a spoiled steady state 1. We propose to use quadratic phase sequences with balanced gradients to exploit the large, but oscillating steady state signal available prior to gradient dephasing. Signals at this new steady state contain more than twice the average signal amplitude of spoiled signals and thus, can dramatically improve the SNR. The quadratic phase sequence characterized by a linear phase increment between RF pulses leads to a phase sequence and a oscillating signal with periodicity of $$$n_c$$$TRs. If the phase increment is kept small (< 3$$$^\circ$$$), bSSFP-like contrast is preserved 2. Importantly, for larger phase increments, a new oscillating steady state emerges with the same period $$$n_c \times TR$$$. The phase progression affects different isochromats differently, inducing frequency dependent phase dispersal, effectively leading to T2*-like contrast. A root mean square (RMS) signal combination across $$$n_c$$$ was used to combine images across the oscillations.
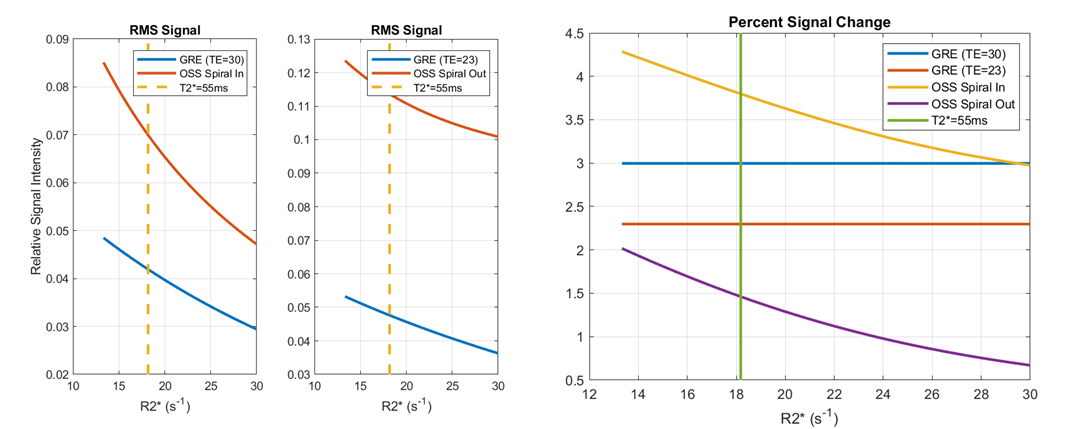
We simulated Lorentzian distributions of frequencies to determine the T2*-weighted signal and the signal changes correspond to T2* changes in fMRI for OSS flip angle = 10$$$^\circ$$$, TR = 15 ms, $$$n_c$$$ = 10 and GRE signals with flip angle at the Ernst angle for gray matter.
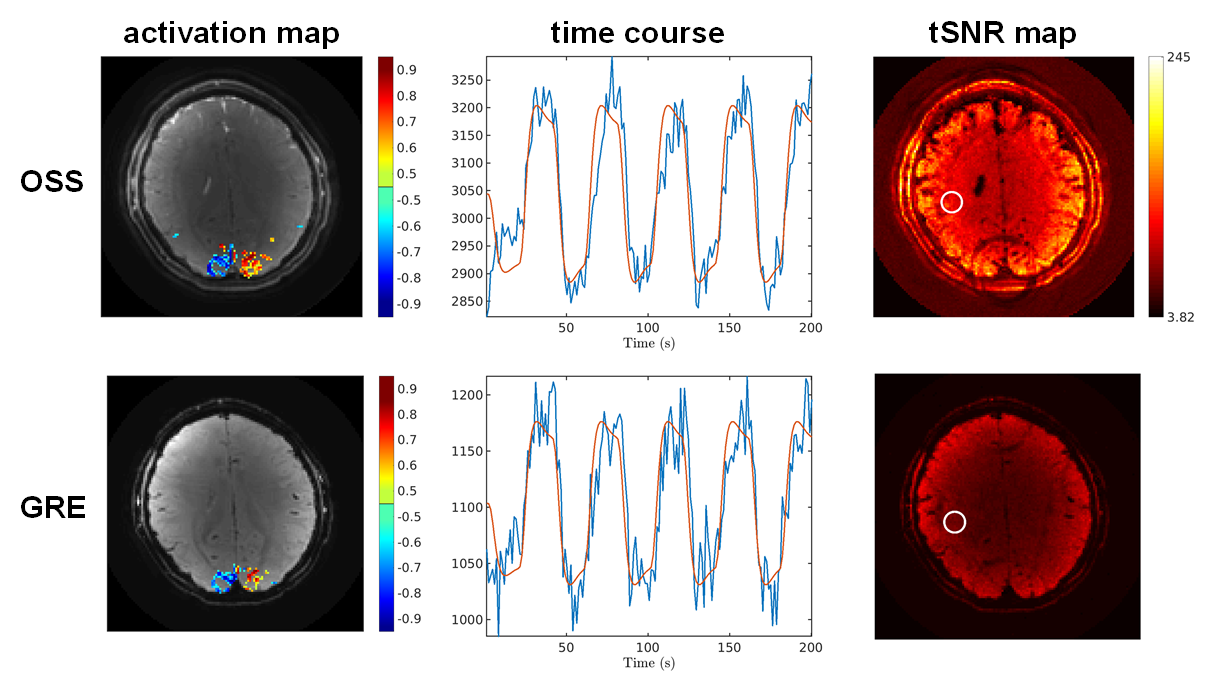
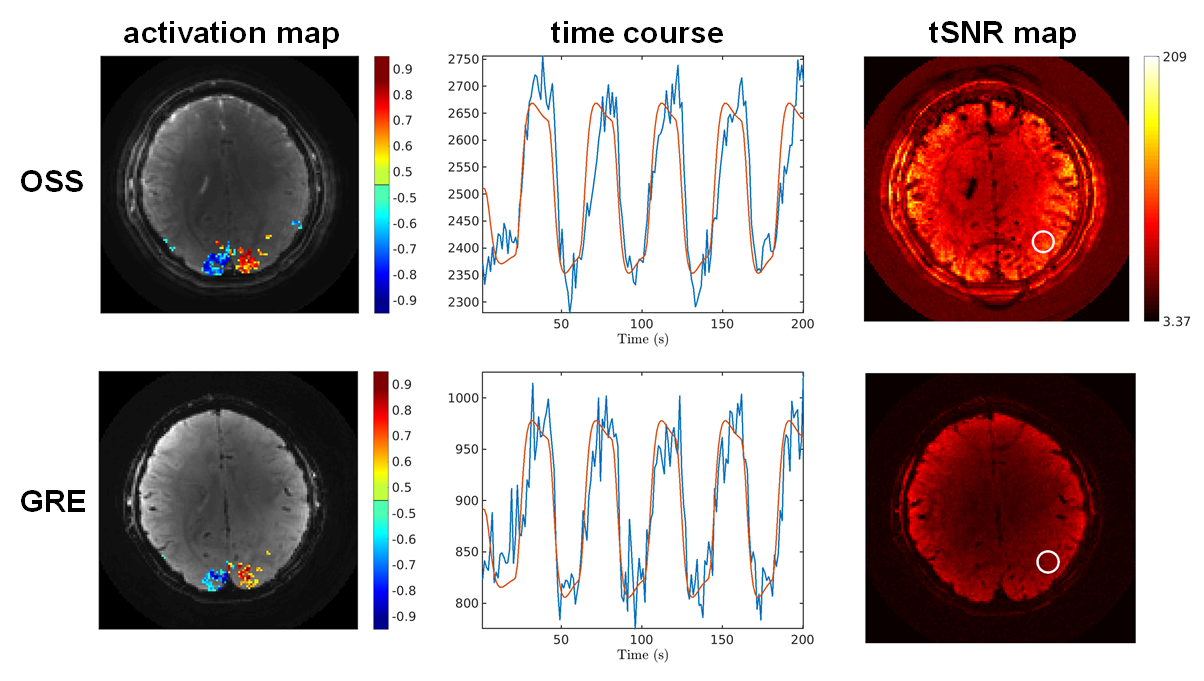
We collected fMRI data on 5 human volunteers on a GE MR750 scanner with OSS flip angle = 10$$$^\circ$$$, TR = 15 ms, $$$n_c$$$ = 10. OSS and GRE data were acquired with matched spatial and temporal resolutions. For a high resolution 2D demonstration, we used multi-shot spirals, with volume TR = 1.2 s, voxel sizes 1.7x1.7x2.5mm$$$^3$$$, using a left vs. right reversing-checkerboard visual stimulus (20 s L/20 sR $$$\times$$$ 5 cycles). For 3D, the volume TR was 1.8 s for 12 slices with voxel sizes 3.4x3.4x3mm$$$^3$$$. The functional task was a right-handed finger tapping task (20s on/20s off $$$\times$$$ 5 cycles) analyzed by correlation with a reference waveform.
Results
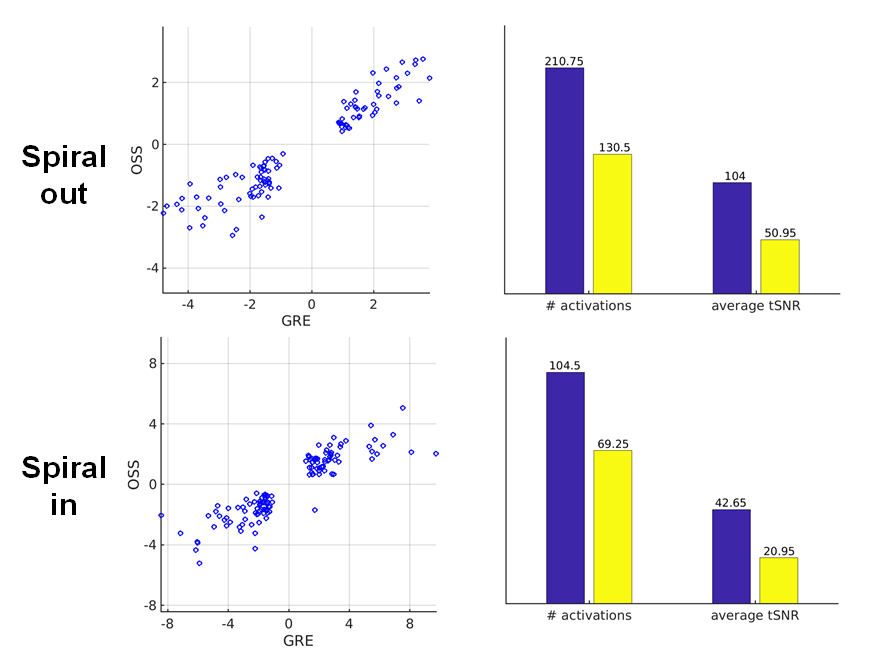
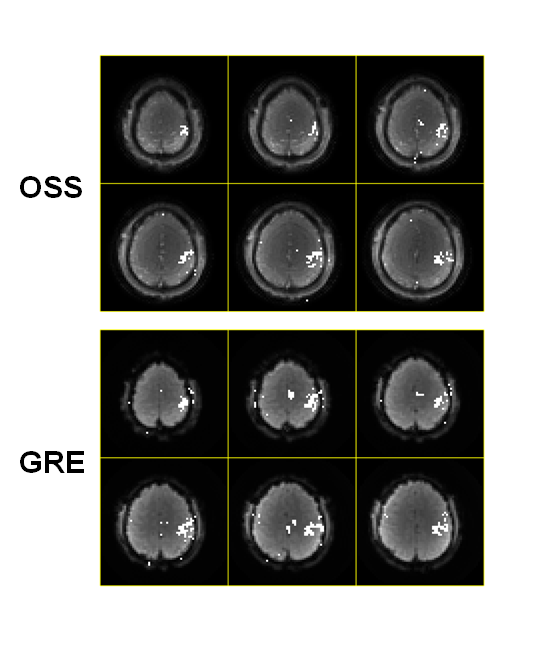
Simulation results (Fig. 1) demonstrates that the that OSS acquisition has substantially higher signal intensity and similar percent signal changes. The spiral-out (Fig. 2) and spiral-in (Fig. 3) activation maps, time courses and tSNR maps clearly demonstrate a potential SNR advantage through the use of OSS in comparison to GRE. Fig. 4 shows similar percent change values for OSS and GRE as well as improved activation and tSNR for OSS, specifically about 1.5 times more activations and at least 2 times higher SNR compared to the GRE imaging. Fig. 5 is an preliminary demonstration of a 3D activation results in motor cortex.Conclusions
The proposed approach departs from these traditional acquisition approaches by exploiting a novel T2*-weighted signal mechanism that produces higher signal than Ernst angle GRE imaging. We show in both simulations and experimental data that this approach leads to a 2- to 3-fold increase is signal strength, similar % signal changes in T2*, and substantially improved tSNR for fMRI. Moreover, the reproducible nature of the OSS signal motivates the exploration of new reconstruction models [?], together with which will enable high SNR, sub-mm resolution images with 1-2 s temporal resolution.Acknowledgements
We wish to acknowledge the support of NIH Grants R01EB023618 and U01EB026977.References
1. Zur, Y., M. L. Wood, and L. J. Neuringer. "Spoiling of transverse magnetization in steady‐state sequences." Magnetic resonance in medicine 21.2 (1991): 251-263.
2. Foxall, D. L. "Frequency‐modulated steady‐state free precession imaging." Magnetic Resonance in Medicine: An Official Journal of the International Society for Magnetic Resonance in Medicine 48.3 (2002): 502-508.
Figures