1166
Novel alpha-180 SE based LINE-scanning method (SELINE) for laminar-specific fMRI1Max Planck Institute for Biological Cybernetics, Tuebingen, Germany, 2Graduate Training Centre of Neuroscience, Tuebingen, Germany, 3Department of Biomedical Magnetic Resonance, University of Tuebingen, Tuebingen, Germany, 4MGH/MIT/HMS Athinoula A. Martinos Center for Biomedical Imaging, Department of Radiology, Harvard Medical School, Massachusetts General Hospital, Charlestown, MA, United States
Synopsis
Laminar-specific functional magnetic resonance imaging (fMRI) opens new possibility for studying the neuronal circuitry and functional connectivity of cortex. FLASH based line-scanning method was proposed with high temporal and spatial resolution to better characterize the fMRI onset time across the cortical layers by combining 2 saturation RF pulses. However, the imperfect RF saturation performance led to poor boundary definition of the ROI from the cortex. In this work, we propose an α-180˚ SE based line-scanning (SELINE) method, solving this problem. We will improve this method to better understand the distinct laminar-specific neuronal circuitry and functional connectivity.
Introduction
Laminar-specific functional magnetic resonance imaging (fMRI) has been successfully applied to understand neuronal circuitry across the cortical layer [1-3]. FLASH based line-scanning method was proposed with high temporal (50 ms) and spatial (50 µm) resolution to better characterize the fMRI onset time by combining 2 saturation RF pulses [4]. The FLASH-based line-scanning method requires the saturation slices to dampen the MR signal outside the regions of interest (ROI) along the phase-encoding direction. However, the imperfect RF saturation performance led to poor boundary definition of the ROI from the cortex. We propose an α-180˚ SE based line-scanning (SELINE) method to solve this problem. Instead of using saturation RF pulses, the proposed SELINE method excites a thin ROI across cortical layer by using ROI-selective 180˚ RF [5]. Here, we compared the laminar-specific fMRI signal in the forepaw S1 of the anesthetized rats using both FLASH-based and SE-based line scanning method. Robust BOLD signal can be detected with the SELINE method (TR 1s/TE 20ms) with high temporal SNR. The laminar-specific fMRI signal spatial correlation pattern is similar between the two methods, showing a deeper layer specificity for the SELINE method.Methods
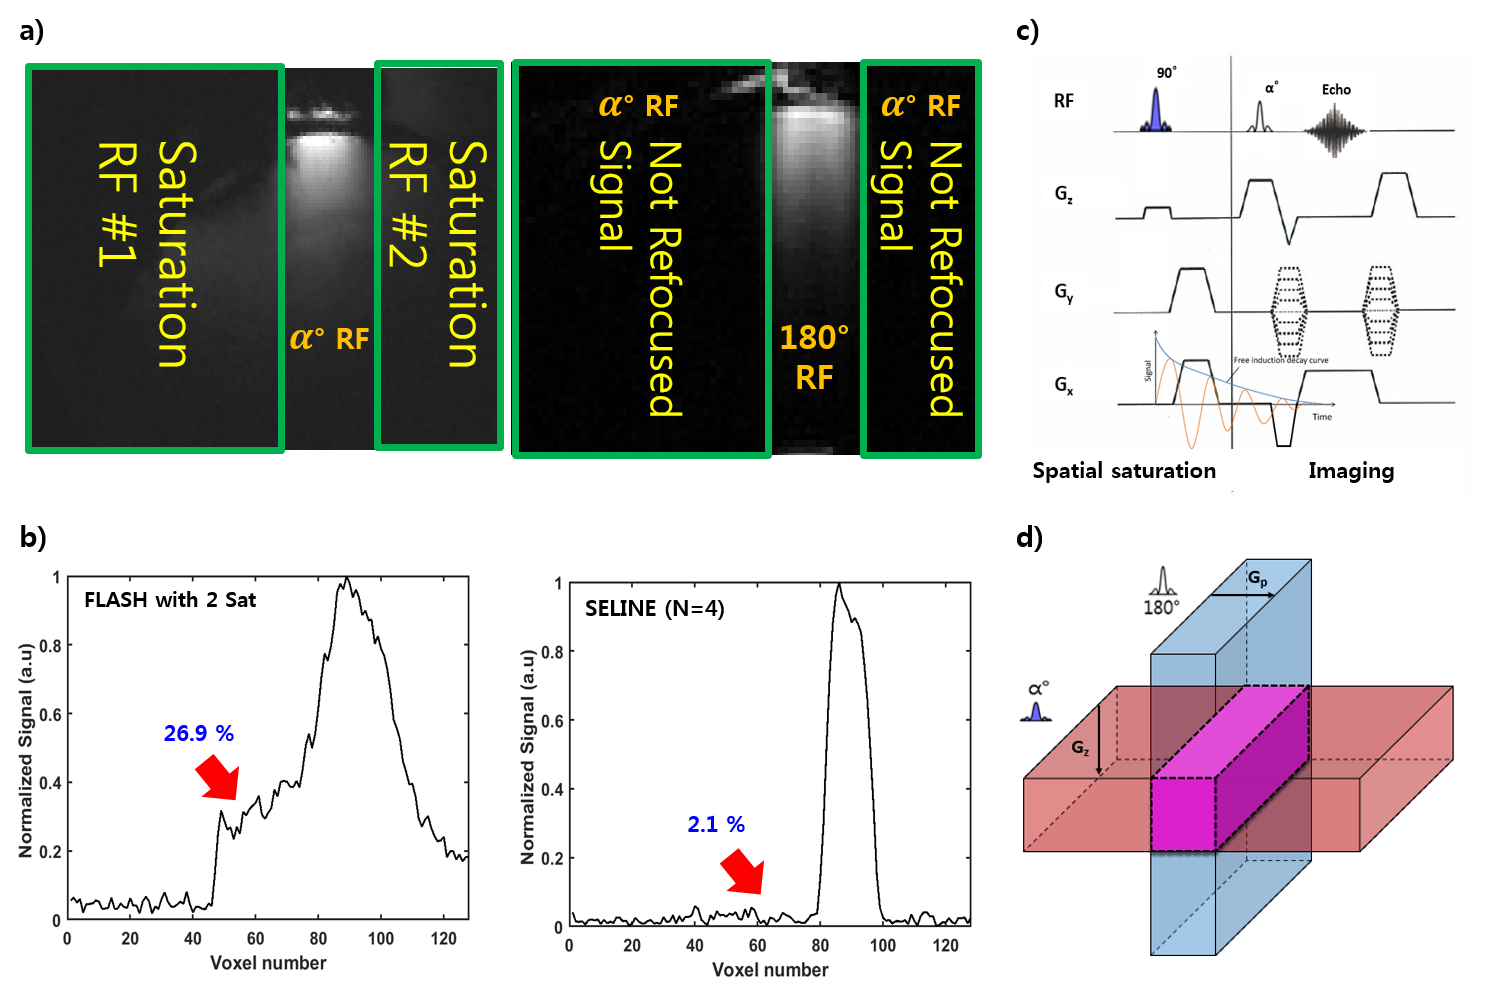
Line-scanning fMRI data was acquired in an anesthetized rat at Bruker 14.1T scanner using in-house transceiver surface coil with 6mm diameter. The conventional FLASH based and the proposed α-180 SE based line-scanning (SELINE) pulse sequence are used (Fig. 1c, Fig. 1d). To acquire the SELINE data, the 180˚ RF pulse oriented perpendicular to the α RF pulse as moving the refocusing gradient to phase encoding gradient (Gp) in order to obtain high spatial resolution without reduced FOV aliasing problem. The following parameters were used for the SELINE acquisition, TR/TE 1000/20 ms, TA 10 min 40 sec, flip angle (α) 90°, FOV 3.2 x 3.2 mm2 and matrix 64 x 32 yielding 50 µm spatial resolution. For FLASH-based acquisition: TR/TE 200/ 12.5 ms, TA 10 min 40 sec, flip angle 60° with 2 saturation RFs, FOV 3.2 x 3.2 mm2 and matrix 64 x 32. In both cases, phase-encoding gradient was turned off to perform line-scanning acquisition.
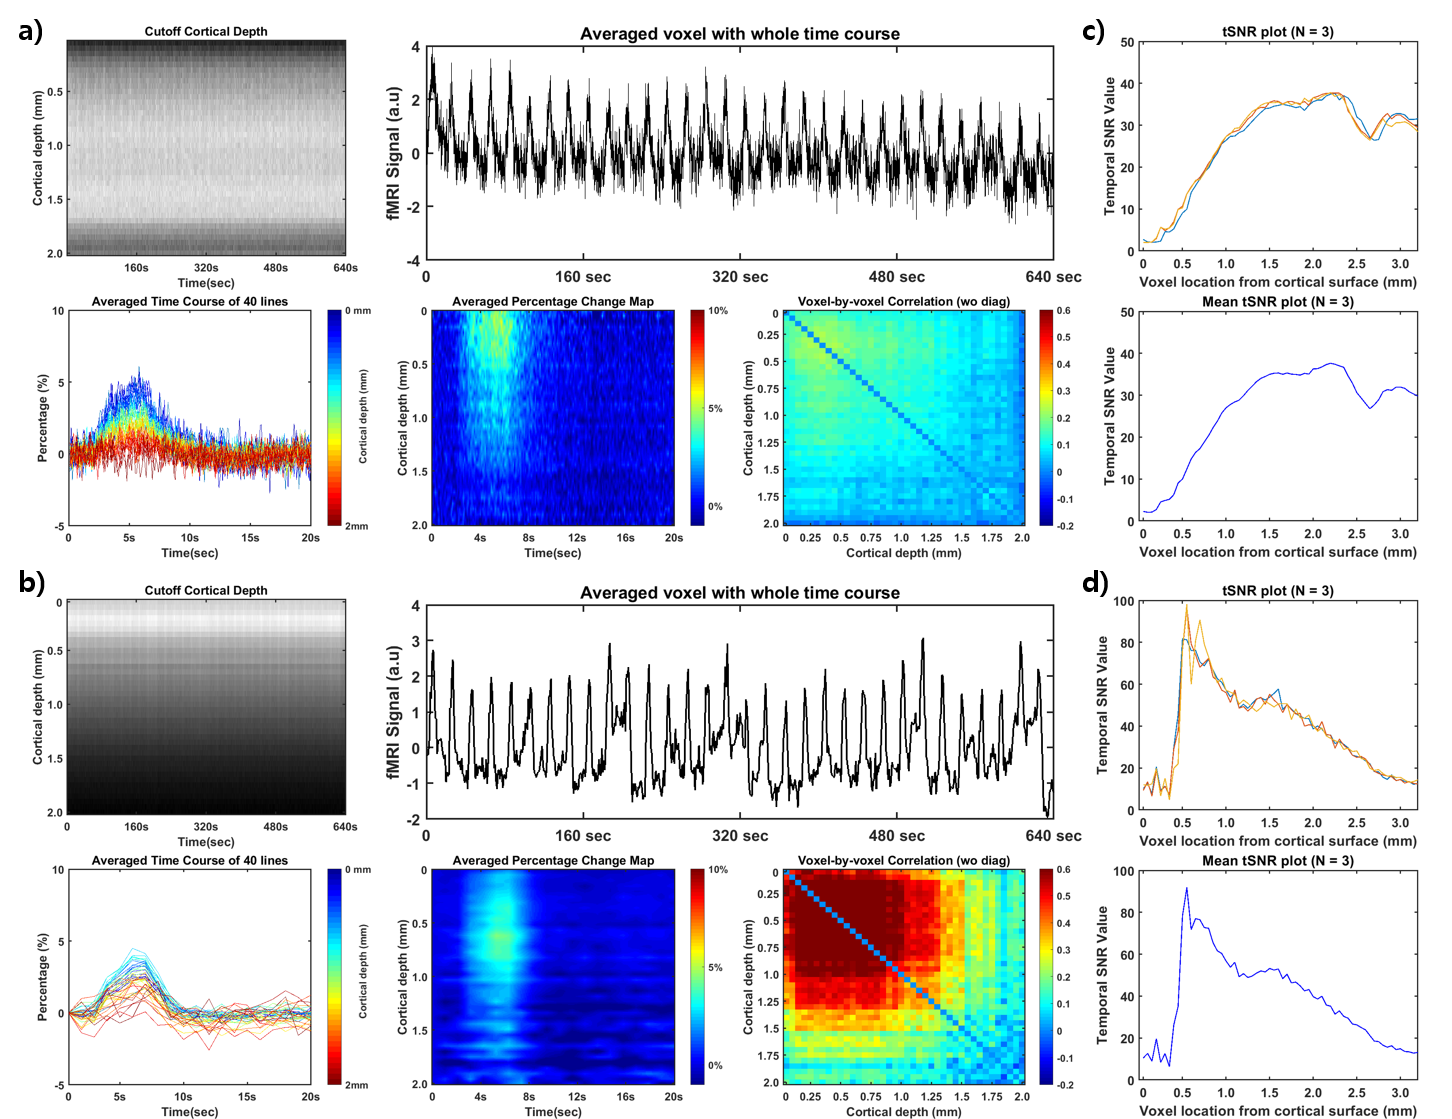
Functional activation was identified by performing a left forepaw stimulation task (3Hz, 4s, pulse width 300us, 2.5mA), followed by 1 second pre-stimulation, 4 second during electrical stimulation and 15 seconds post stimulation with a total 20 seconds for 10 min 40 sec. All signal processing and analysis are implemented in Matlab software (R2018a; Mathworks, Natick, MA). Cortical depth map was estimated by the cortical surface [4]. Averaged time course and percentage change map were calculated for averaging every 20 second with the whole time course (640 seconds). The mean temporal SNR (tSNR) value with 3 trials was calculated in order to compare tSNR performance [6].
Results
To demonstrate the saturation performance, the line profiles of MRI signal intensity are shown in Fig. 1b. The proposed SELINE method has 2.1% mean suppressed brain region with 4 trials while the conventional FLASH based method has 26.9% (12.8 times of SELINE). Averaged time course and percentage change map have higher contrast-to-noise ratio (CNR) in the deeper layer of the SELINE method than FLASH-based method. Laminar-specific correlation coefficient matrices are shown in Fig. 2a, 2b (2 times of SELINE). Layers L2/3-L4 (0.15 – 0.8 mm) show strong correlation with the SELINE method. tSNR plots with 3 trial are shown in Fig. 2c, 2d. The conventional FLASH-based method has 30.6 mean tSNR with slow slope in Fig. 3c (TR, 100ms, TE, 12.5ms). On the other hand, SELINE method has 50.4 mean tSNR with steep slope in Fig. 3d. The altered laminar SNR profile is due to the less homogeneous B1 field from the small transceiver surface coil.Discussions and Conclusions
We demonstrate the feasibility of the SELINE method for laminar-specific fMRI. The proposed scheme solves the contamination issue out of ROI. Future work will be done to improve this method. To achieve higher temporal resolution up to 100 or 200 ms by optimizing flip angle α, TR and sequence parameters, we will investigate the effect from stimulated echoes during fMRI stimulation paradigm. Since the transceiver RF coil may produce less homogeneous B1 field, which may cause varied SNR along the cortical layers, we will apply a TORO setup for the SELINE method. In addition, this method will be readily used for the human brain laminar fMRI mapping.Acknowledgements
No acknowledgement found.References
[1] Polimeni JR, Fischl B, Greve DN, Wald LL. Laminar analysis of 7T BOLD using an imposed spatial activation pattern in human V1. Neuroimage 2010; 52:1334-1346
[2] Turner R. Uses, misuses, Uses, misuses, new uses and fundamental limitations of magnetic resonance imaging in cognitive science. Philos Trans R Soc Lond B 2016; 371:20150349
[3] Huber L, Handwerker DA, Jangraw DC, Chen G, Hall A, Stüber C, Gonzalez-Castillo J, Ivanov D, Marrett S, Guidi M, Goense J, Poser BA, Bandettini PA. High-Resolution CBV-fMRI Allows Mapping of Laminar Activity and Connectivity of Cortical Input and Output in Human M1. Neuron 2017; 96: 1253-1263
[4] Yu X, Qian C, Chen D, Dodd SJ, Koretsky AP. Deciphering laminar-specific neural inputs with line-scanning fMRI. Nature methods 2014; 11:55-58
[5] Feinberg DA, Hoenninger JC, Crooks LE, Kaufman L, Watts JC, Arakawa M. Inner volume MR imaging: technical concepts and their application. Radiology 1985; 156:743-747
[6] Murphy K, Bodurka J, Bandettini PA. How long to scan? The relationship between fMRI temporal signal to noise ratio and necessary scan duration. Neuroimage 2007; 34:565-574
Figures