1162
In Vivo Multicomponent 3D-T1ρ Relaxation Mapping of Human Liver under Free-breathing1Radiology, NYU Langone Health, New York, NY, United States, 2Medicine, NYU Langone Health, New York, NY, United States
Synopsis
Purpose
Chronic hepatic disease injures the liver, and the subsequent wound-healing process can result in liver fibrosis, which can ultimately progress to cirrhosis [1]. The biochemical changes in the liver, including increase of collagen and proteoglycan (PG)/hyaluronic acid (HA) with progression of fibrosis [2], lead to alteration of the spin-lattice relaxation time in the rotating frame (T1ρ) [3]. Different water compartments (e.g., free water, water bound to collagen or PG/HA) have different relaxation times. Therefore, a multi-component model (short and long T1ρ relaxation times and corresponding fractions) may better represent the relaxation behavior than a mono-exponential model. We propose a novel, motion-robust MR imaging technique for bi-exponential 3D-T1ρ mapping of liver during free-breathing as a potential biomarker for quantitative assessment of liver fibrosis and inflammation.Methods
IRB-approved T1ρ imaging was performed during free breathing in six healthy volunteers (mean age: 26 ± 2 years) and three patients with a chronic liver disease (CLD) (mean age: 60 ± 7 years) using a 3T MRI scanner (MAGNETOM Prisma, Siemens Healthcare GmbH, Germany) with the combination of a 18-channel body-matrix coil and 32-channel spine coil. The RAdial Volumetric Encoding (RAVE) sequence [4] was modified by adding a paired spin-lock pulse [5] to enable T1ρ imaging with varying spin-lock time (Figure 1). T1ρ-weighted images were acquired with different spin-lock durations (Tsl) including Tsl = 2, 4, 6, 8, 10, 15, 25, 35, 45ms and the following sequence parameters: TR/TE = 3.66ms/1.56ms, flip angle = 12o, FOV = 350mm2, slice thickness = 2ms, radial spokes = 192, matrix size = 192×192×96, spin-lock frequency = 350Hz, T1-recovery delay = 1000ms, resulting in an acquisition time of 4:41 minutes for each Tsl. Mono-exponential T1ρ times were calculated pixel-by-pixel in the liver by fitting the signal intensity decay over time to:
$$ S(T_{sl}) =A_m\exp(-\frac{T_{sl}}{T_{1\rho,m}})+s_0 $$
where Am is the amplitude of exponential term, T1ρ,m is the mono-exponential relaxation time, and s0 is a constant accounting for residual noise. Bi-exponential relaxation components were calculated by fitting the data to:
$$ S(T_{sl}) =A\left(f_s\exp(-\frac{T_{sl}}{T_{1\rho,s}})+ f_l\exp(-\frac{T_{sl}}{T_{1\rho,l}})\right)+s_0 $$
where A is the amplitude, T1ρ,s is the short and T1ρ,l the long relaxation-time component. The fractions of the short and long components are given by $$$ 0\leq f_s \leq 1 $$$ and $$$ f_l = 1-f_s $$$. Pixels that didn’t satisfy the F-test condition were excluded in the final bi-exponential maps:
$$ \frac{\frac{{SSE}_m - {SSE}_b}{p_2 -p1}}{\frac{{SSE}_b}{L-p_2}} > \alpha_F $$
where αF = 4.32 is the threshold based on the p = 0.1 F-distribution table for p1 = 2 and p2 = 4 degrees of freedom, and SSEm and SSEb are the sums of square error for the mono- and bi-exponential models, respectively. L = 9 is the number of Tsl time points acquired for fitting.
Results
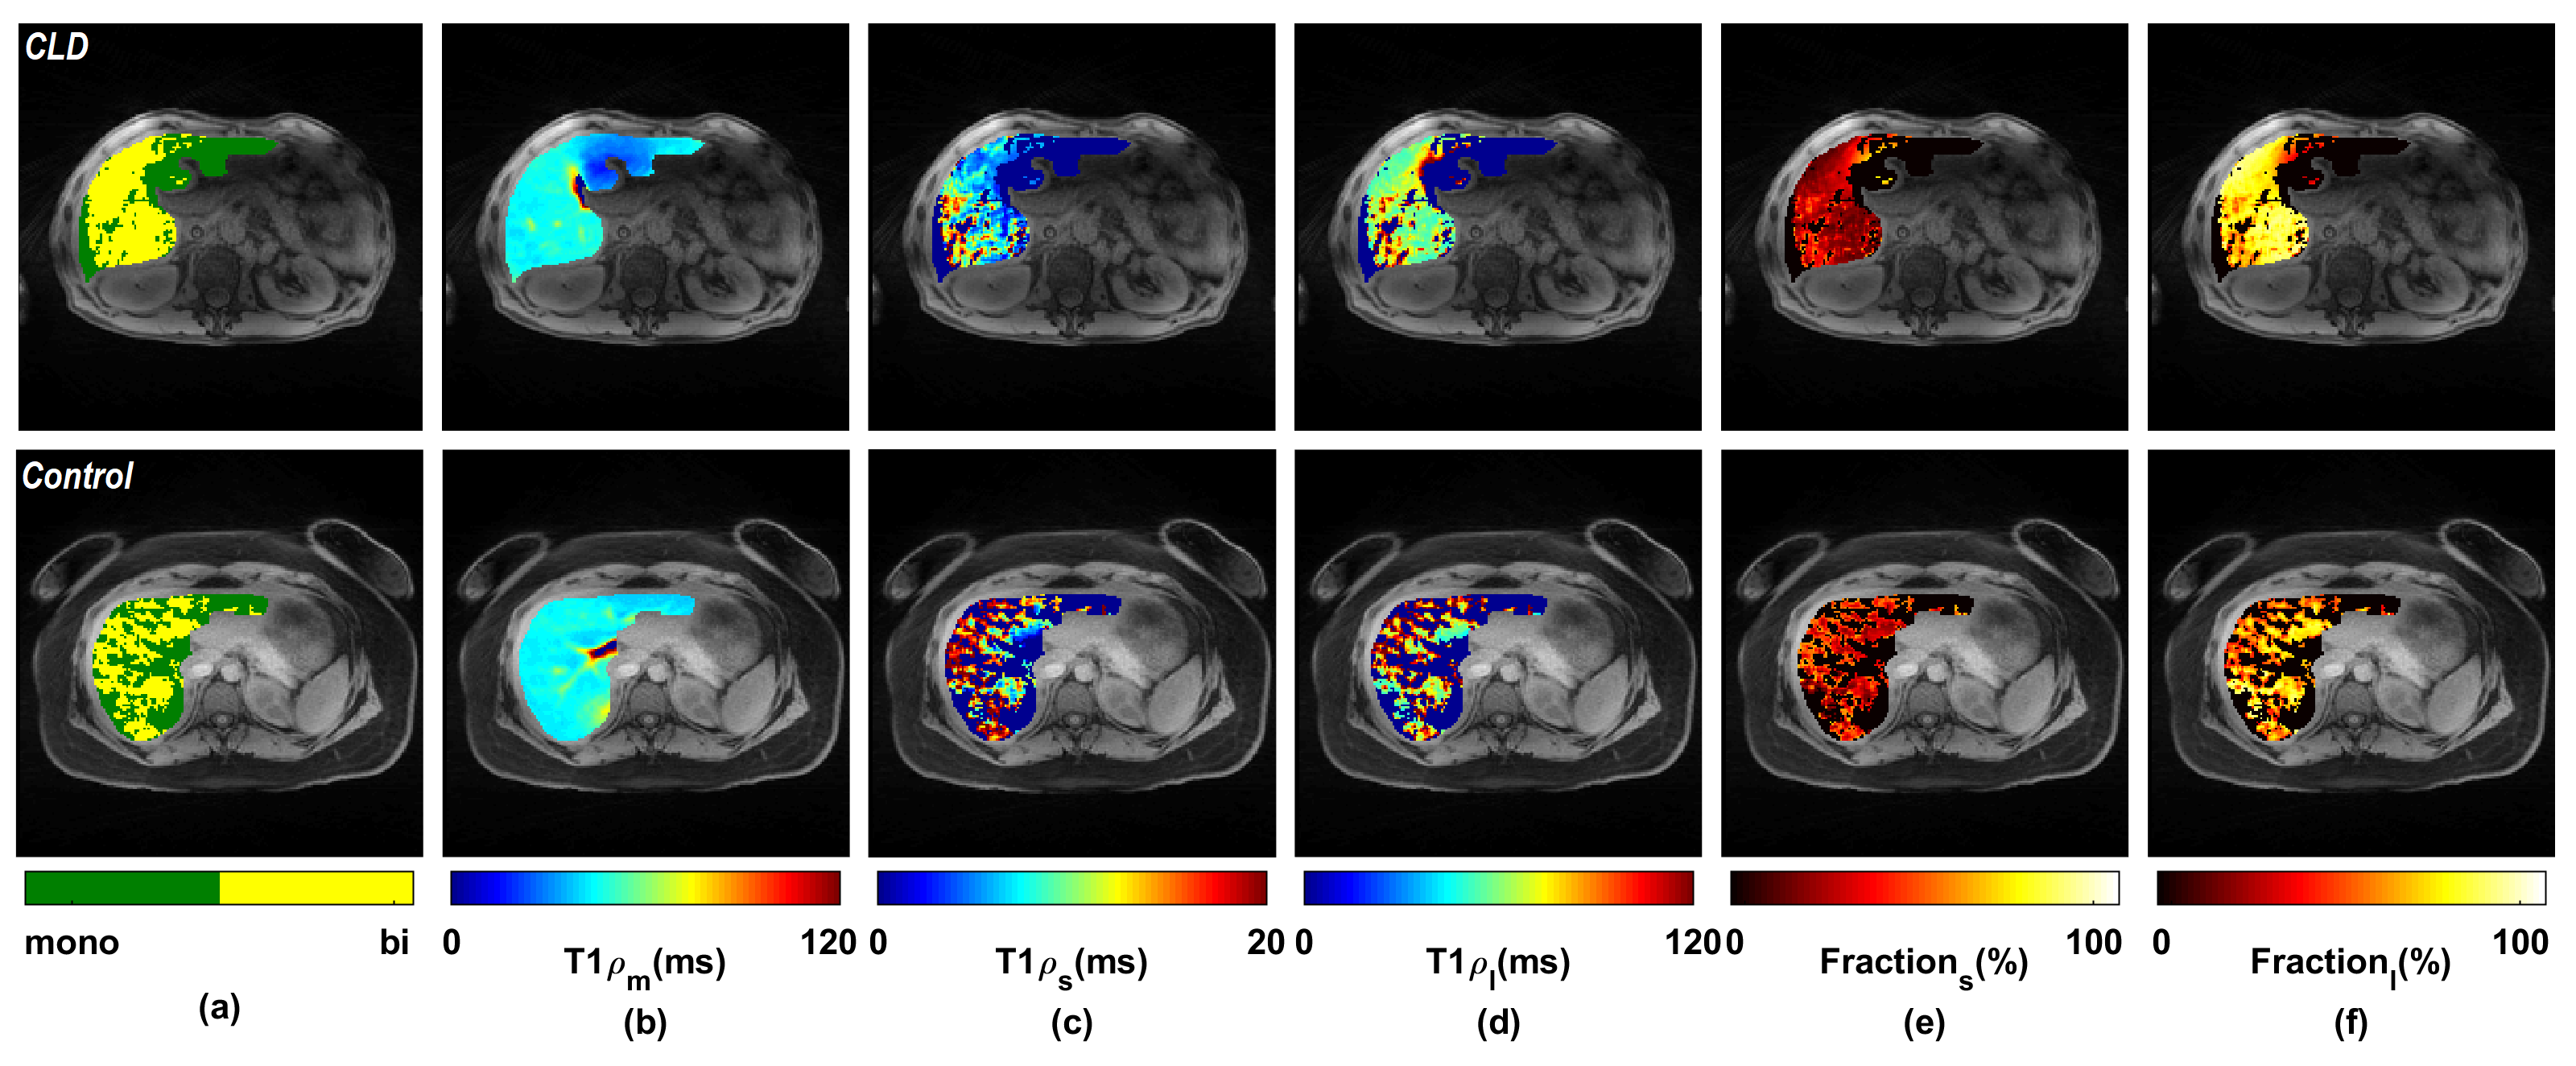
Bi-exponential relaxation of T1ρ in the liver was observed for all subjects. As shown in Figure 2, the deviation of the data points from a straight line in a logarithmic scale indicates the existence of more than one exponential term. Moreover, the bi-exponential fit has smaller fitting residuals than the mono-exponential fit (Figure 2b), which shows that it can better represent the relaxation decay. Representative examples of T1ρ maps are shown in Figure 3 for the axial plane. The summary of relaxation components is shown in Table 1. The Mann–Whitney U test results showed a significant difference (p = 0.03) in T1ρ short component between healthy controls and CLD patients. Although an elevated mono exponential T1ρ was observed in the patients, It was not significantly different from the control group (p = 0.5). The boxplots shown in Figure 4 illustrate the differences in the relaxation components between the control and the CLD patients.
Discussion and Conclusion
The short T1ρ relaxation component is thought to be related to water tightly bound to the extracellular matrix (e.g., collagen, HA/PG, etc.) while the long component corresponds to loosely bound water (e.g., inflammation/edema, etc.). Hence, we expect to see a change in the short T1ρ component in patients with fibrosis as a result of collagen, and PG/HA accumulation in the liver and a change in the in long component due to inflammation and edema. Further validation in a larger study group of patients with different stages of liver fibrosis is warranted.Acknowledgements
References
1. Mas, V.R., et al., Proteomics and liver fibrosis: identifying markers of fibrogenesis. Expert Review of Proteomics, 2009. 6(4): p. 421-431.
2. Petitclerc, L., et al., Liver fibrosis: Review of current imaging and MRI quantification techniques. Journal of Magnetic Resonance Imaging, 2017. 45(5): p. 1276-1295.
3. Allkemper, T., et al., Evaluation of Fibrotic Liver Disease with Whole-Liver T1ρ MR Imaging: A Feasibility Study at 1.5 T. Radiology, 2013. 271(2): p. 408-415.
4. Benkert, T., et al., Free-breathing volumetric fat/water separation by combining radial sampling, compressed sensing, and parallel imaging. Magnetic Resonance in Medicine, 2017. 78(2): p. 565-576.
5. Mitrea, B.G., et al., Paired self-compensated spin-lock preparation for improved T 1 ρ quantification. Journal of Magnetic Resonance, 2016. 268: p. 49-57.
Figures