1160
Early analysis of hepatic PDFF and liver stiffness results in the Strong Heart Study, investigating possible factors affecting nonalcoholic fatty liver disease in an American Indian populationWalter C Henderson1, Ying Zhang2, Justin D Dvorak2, Tim Mower3, Donovan S Beswick3, Sanjay K Narotam3, Alvin C Silva4, Tanya Wolfson5, Danielle N Batakis1, Ashley L Louie1, Yesenia Covarrubias1, Cynthia L West6, Tauqeer Ali2, Richard B Devereux7, Jonathan W Weinsaft7, Jason G Umans6,8, Rohit Loomba9, Shelley A Cole10, Claude B Sirlin1, and Michael S Middleton1
1Liver Imaging Group, Department of Radiology, UC San Diego, La Jolla, CA, United States, 2Department of Biostatistics & Epidemiology, University of Oklahoma Health Sciences Center, Oklahoma City, OK, United States, 3Norman Regional Health System, Norman Regional Moore, Moore, OK, United States, 4Department of Radiology, Mayo Clinic, Scottsdale, AZ, United States, 5Computational and Applied Statistics Laboratory, San Diego Supercomputer Center, UC San Diego, La Jolla, CA, United States, 6Medstar Health Research Institute, Hyattsville, MD, United States, 7Department of Medicine (Cardiology), Weill Cornell Medicine, New York, NY, United States, 8Georgetown-Howard Universities Center for Clinical and Translational Science, Washington, DC, United States, 9NAFLD Research Center, Division of Gastroenterology, Department of Medicine, UC San Diego, La Jolla, CA, United States, 10Texas Biomedical Research Institute, San Antonio, TX, United States
Synopsis
In this analysis of early data from the Strong Heart Study, we show that advanced MRI estimates of proton-density fat fraction (PDFF) and liver stiffness can be acquired successfully in a population of American Indians. Diagnosis of diabetes, and whether participants self-report binge-drinking are collected. Too few cases have been enrolled to permit significance testing, but PDFF values are higher for diagnosed diabetes, and stiffness values are higher for self-reported binge drinking. This study offers a unique opportunity to study the possible roles of diabetes and binge drinking in nonalcoholic fatty liver disease for an at-risk population of American Indians.
Introduction
Chronic liver disease is the fifth leading cause of death among American Indians (1). For the last 25 years, the Strong Heart Study (SHS) has been investigating cardiovascular disease (CVD) and type 2 diabetes mellitus (T2DM) in this population (2). Recently, an arm has been added to the SHS to investigate the possible role of nonalcoholic fatty liver disease (NAFLD) in the development of CVD and T2DM, in participants who reported, or did not report binge drinking. Magnetic resonance imaging proton-density fat fraction (MRI-PDFF) and liver stiffness estimated by magnetic resonance elastography (MRE) are being used in this study as established, accurate, and precise noninvasive quantitative imaging biomarkers of hepatic steatosis and fibrosis, respectively (3-6). The purpose of this report of imaging SHS results is to review early baseline MRI-PDFF and MRE liver stiffness results for participants with and without T2DM, and with and without self-reported binge drinking.Materials and Methods
MR exams are acquired in this study at two imaging sites (1.5T MR450w, 3T MR750w; GE Healthcare, Waukesha, WI). One imaging site is affiliated with an academic research institution, and the other is a regional community hospital. An IDEAL-IQ sequence is used to estimate MRI-PDFF, and either a two-dimensional (2D) gradient-recalled-echo (GRE) MRE (1.5T scanner) or a 2D spin-echo echo-planar imaging (SE-EPI) MRE (3T scanner) pulse sequence is used to estimate liver stiffness. For MRI-PDFF estimation, an experienced central analyst places a 1 cm-radius region of interest (ROI) in each of the nine Couinaud liver segments preferentially on out-of-phase IDEAL-IQ images and propagates those ROI to parametric PDFF map images to obtain segmental PDFF values, and an average, whole-liver PDFF value is calculated (Figure 1). For liver stiffness estimation, MRE images are analyzed centrally by an experienced analyst using a custom analysis software platform (MRE-Quant, Mayo Clinic, Rochester, MN). ROIs are drawn manually on each of four acquired MRE slices through the widest part of the liver, avoiding areas of incoherent wave propagation or artifact, major blood vessels and bile ducts, and liver edges (Figure 2). A single liver stiffness value is calculated as the ROI-area-weighted mean of liver stiffness values across the four acquired slices.Results
Approval was obtained from institutional and Indian Health Service IRBs, and IRBs at each of the clinical sites, as well as from each participating tribe. Over five months, 81 of a targeted 325 participants (22 men, 59 women; mean (SD) age 51 (11) yrs; mean (SD) body mass index (BMI) 36.0 (9.5) kg/m2 have been enrolled and have undergone advanced MR exams including MRI-PDFF and MRE (Table 1). 79/81 MR exams were analyzable (97.5% each, MRI-PDFF and MRE). Two participants showed apparent iron overload which rendered both MRI-PDFF and MRE exams not analyzable. For subjects who underwent MR exams, mean (SD) MRI-PDFF was 10.36 (8.13) %, mean (SD) liver stiffness was 2.70 (1.07) kPa, and age, sex, and BMI data are as summarized in Table 2. The number of analyzed MR exams to date is small, and the amount of clinical data available at this time is limited, so testing of statistical significance is not yet warranted. However, we have observed in the data that has been collected that MRI-PDFF values are higher in participants with T2DM, and liver stiffness values are higher in participants who self-report binge drinking.Discussion
In this analysis of early results from the SHS, we have demonstrated the feasibility of acquiring advanced MRI-PDFF and MRE exams in a population of American Indian participants from two clinical trial imaging sites. MRI-PDFF values span the full range from none evident, to marked steatosis (0.89-44.84%), and MRE liver stiffness values span the full range from none evident, to advanced fibrosis (1.73-10.25 kPa). This study is recruiting from a high-risk population, and so offers a unique opportunity to investigate possible correlations between NAFLD, T2DM, and binge drinking. The number of subjects enrolled to date is still limited, and not all clinical data is currently available, so we are unable to fully investigate at this time possible trends among different clinical subgroups, or effects of possible confounders.Conclusion
MRI-PDFF and MRE exams are able to be obtained with a high degree of technical success in American Indians participating in the SHS. This study offers a unique opportunity to study the possible roles of diabetes and binge drinking in NAFLD for this high-risk population.Acknowledgements
No acknowledgement found.References
- National Vital Statistics System, LCWK1_206. Deaths, 15 leading causes of death by race: United States, 2016, p 133
- North et al, Am J Epidemiol 2003;157:303
- Artz et al, J Mag Reson Imaging 2015;42:811
- Yokoo et al, Radiology 2018;286:486
- Loomba et al, Hepatology 2014;60:1920
- Serai et al, Radiology 2017;285:92
- Wu et al, PLoS One 2015;10:e0140068
- Caussy et al, J Clin Invest 2017;127:2697
Figures

Figure 1. IDEAL-IQ out-of-phase image (left) and parametric PDFF
map (right) showing representative ROIs placed in five liver segments for PDFF
analysis.

Figure 2. MRE elastogram (a), magnitude image (b), and wave
image (c) for one MRE slice showing a representative MRE analysis ROI.

Table 1. Summary of available demographic
data and body mass index (BMI) for study participants with and without T2DM,
and with and without self-reported binge drinking
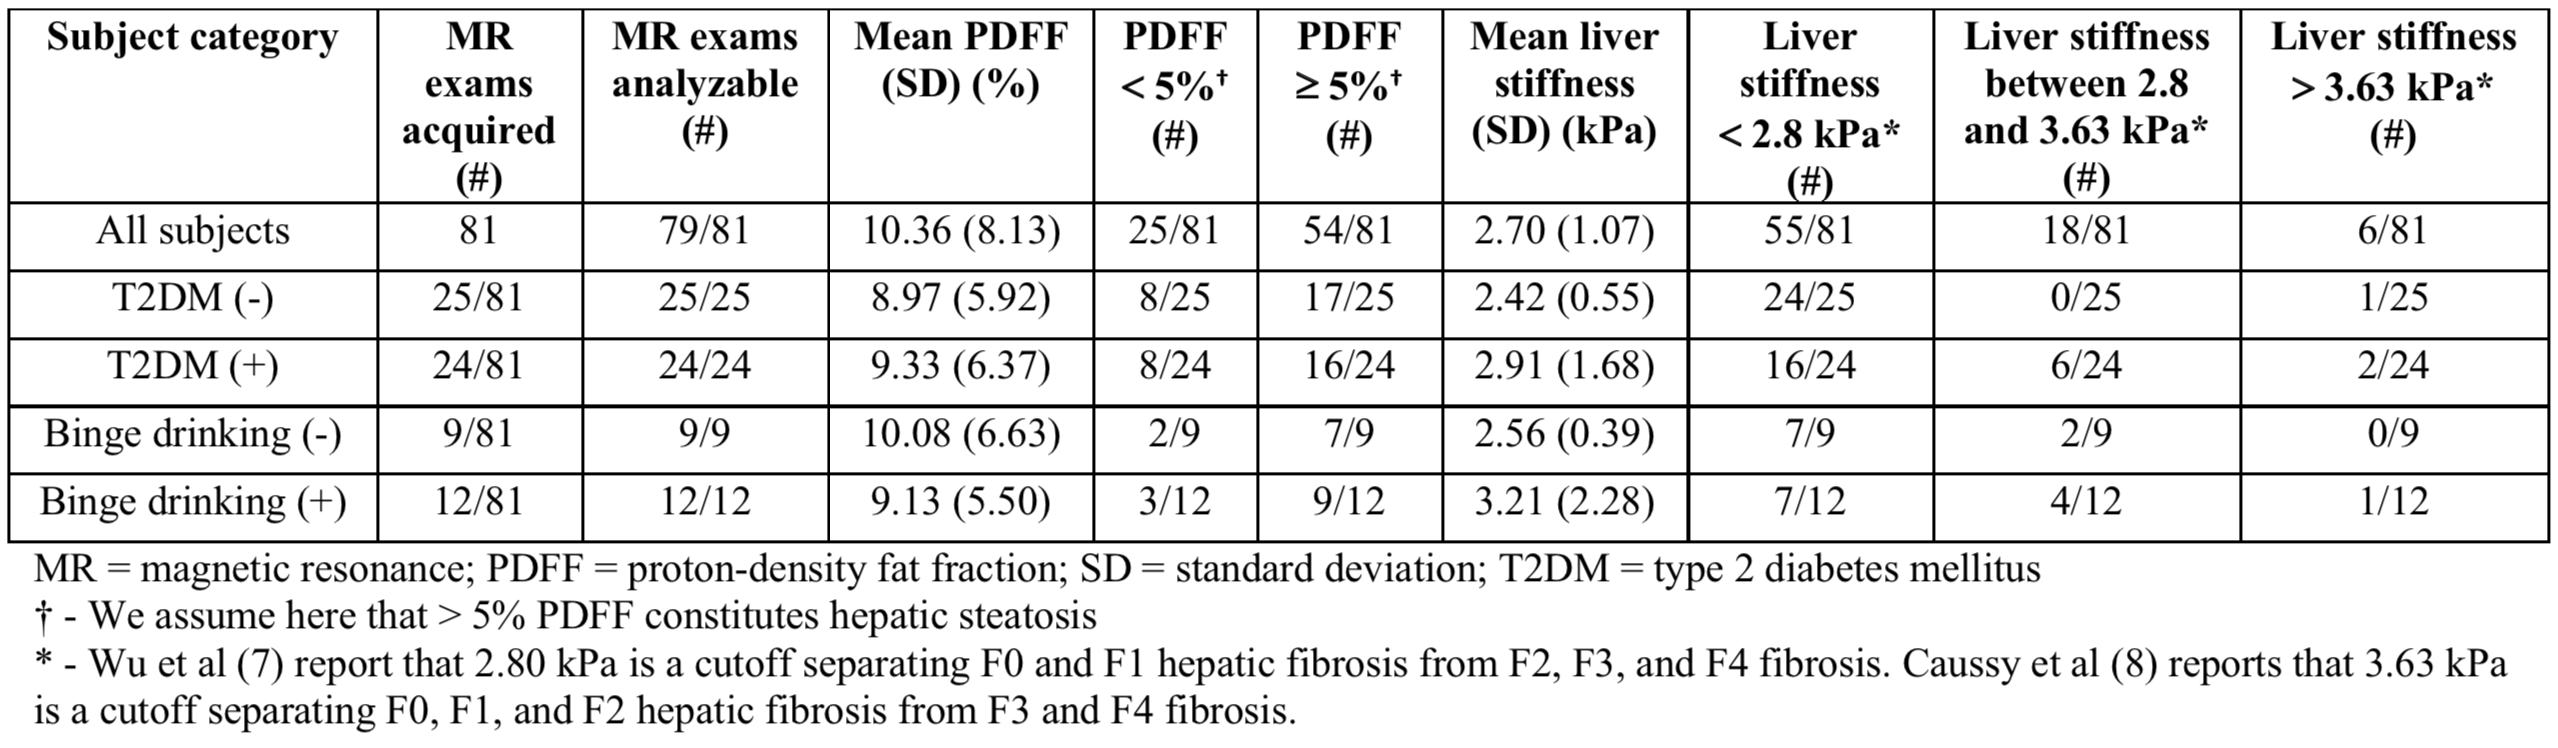
Table 2. Summary of numbers of acquired MR
exams, and PDFF and MRE liver stiffness values in participants with and without
T2DM, and with and without self-reported binge drinking