1158
Flow quantification in portal hypertension with 4D flow: comparison of a free breathing k-t accelerated sequence to a respiratory-navigated sequence1Translational and Molecular Imaging Institute, Icahn School of Medicine at Mount Sinai, New York, NY, United States, 2Department of Radiology, Icahn School of Medicine at Mount Sinai, New York, NY, United States, 3Department of Medicine, Icahn School of Medicine at Mount Sinai, New York, NY, United States, 4Department of Pathology, Icahn School of Medicine at Mount Sinai, New York, NY, United States, 5Radiology, Northwestern University, Chicago, IL, United States, 6Laboratoire d'Imagerie Biomedicale, INSERM, Paris, France, 7Department of Interventional Radiology, Icahn School of Medicine at Mount Sinai, New York, NY, United States, 8Biomedical Engineering, Northwestern University McCormick School of Engineering, Evanston, IL, United States
Synopsis
The purpose of our prospective study was to compare a free-breathing k-t GRAPPA accelerated 4D flow sequence with a standard navigator-gated sequence, and to correlate hemodynamic parameters to the hepatic venous pressure gradient (HVPG) in patients with chronic liver disease. The k-t accelerated sequence had significant (three-fold) reduction in acquisition time, while obtaining equivalent image quality and quantitative parameters in the large vessels as the standard sequence. However, there was systematic under-estimation of velocities in small arteries. Time-average velocity in the superior mesenteric vein measured with the k-t sequence was positively correlated with HVPG.
Introduction
4D flow MRI has shown promise in the characterization of portal hypertension, however, clinical adoption has been slow due to long acquisition times and complex processing. The purpose of our study was to compare free-breathing k-t accelerated with standard navigator-gated 4D flow, and to correlate flow parameters with hepatic venous pressure gradient (HVPG) in patients with chronic liver disease.Methods
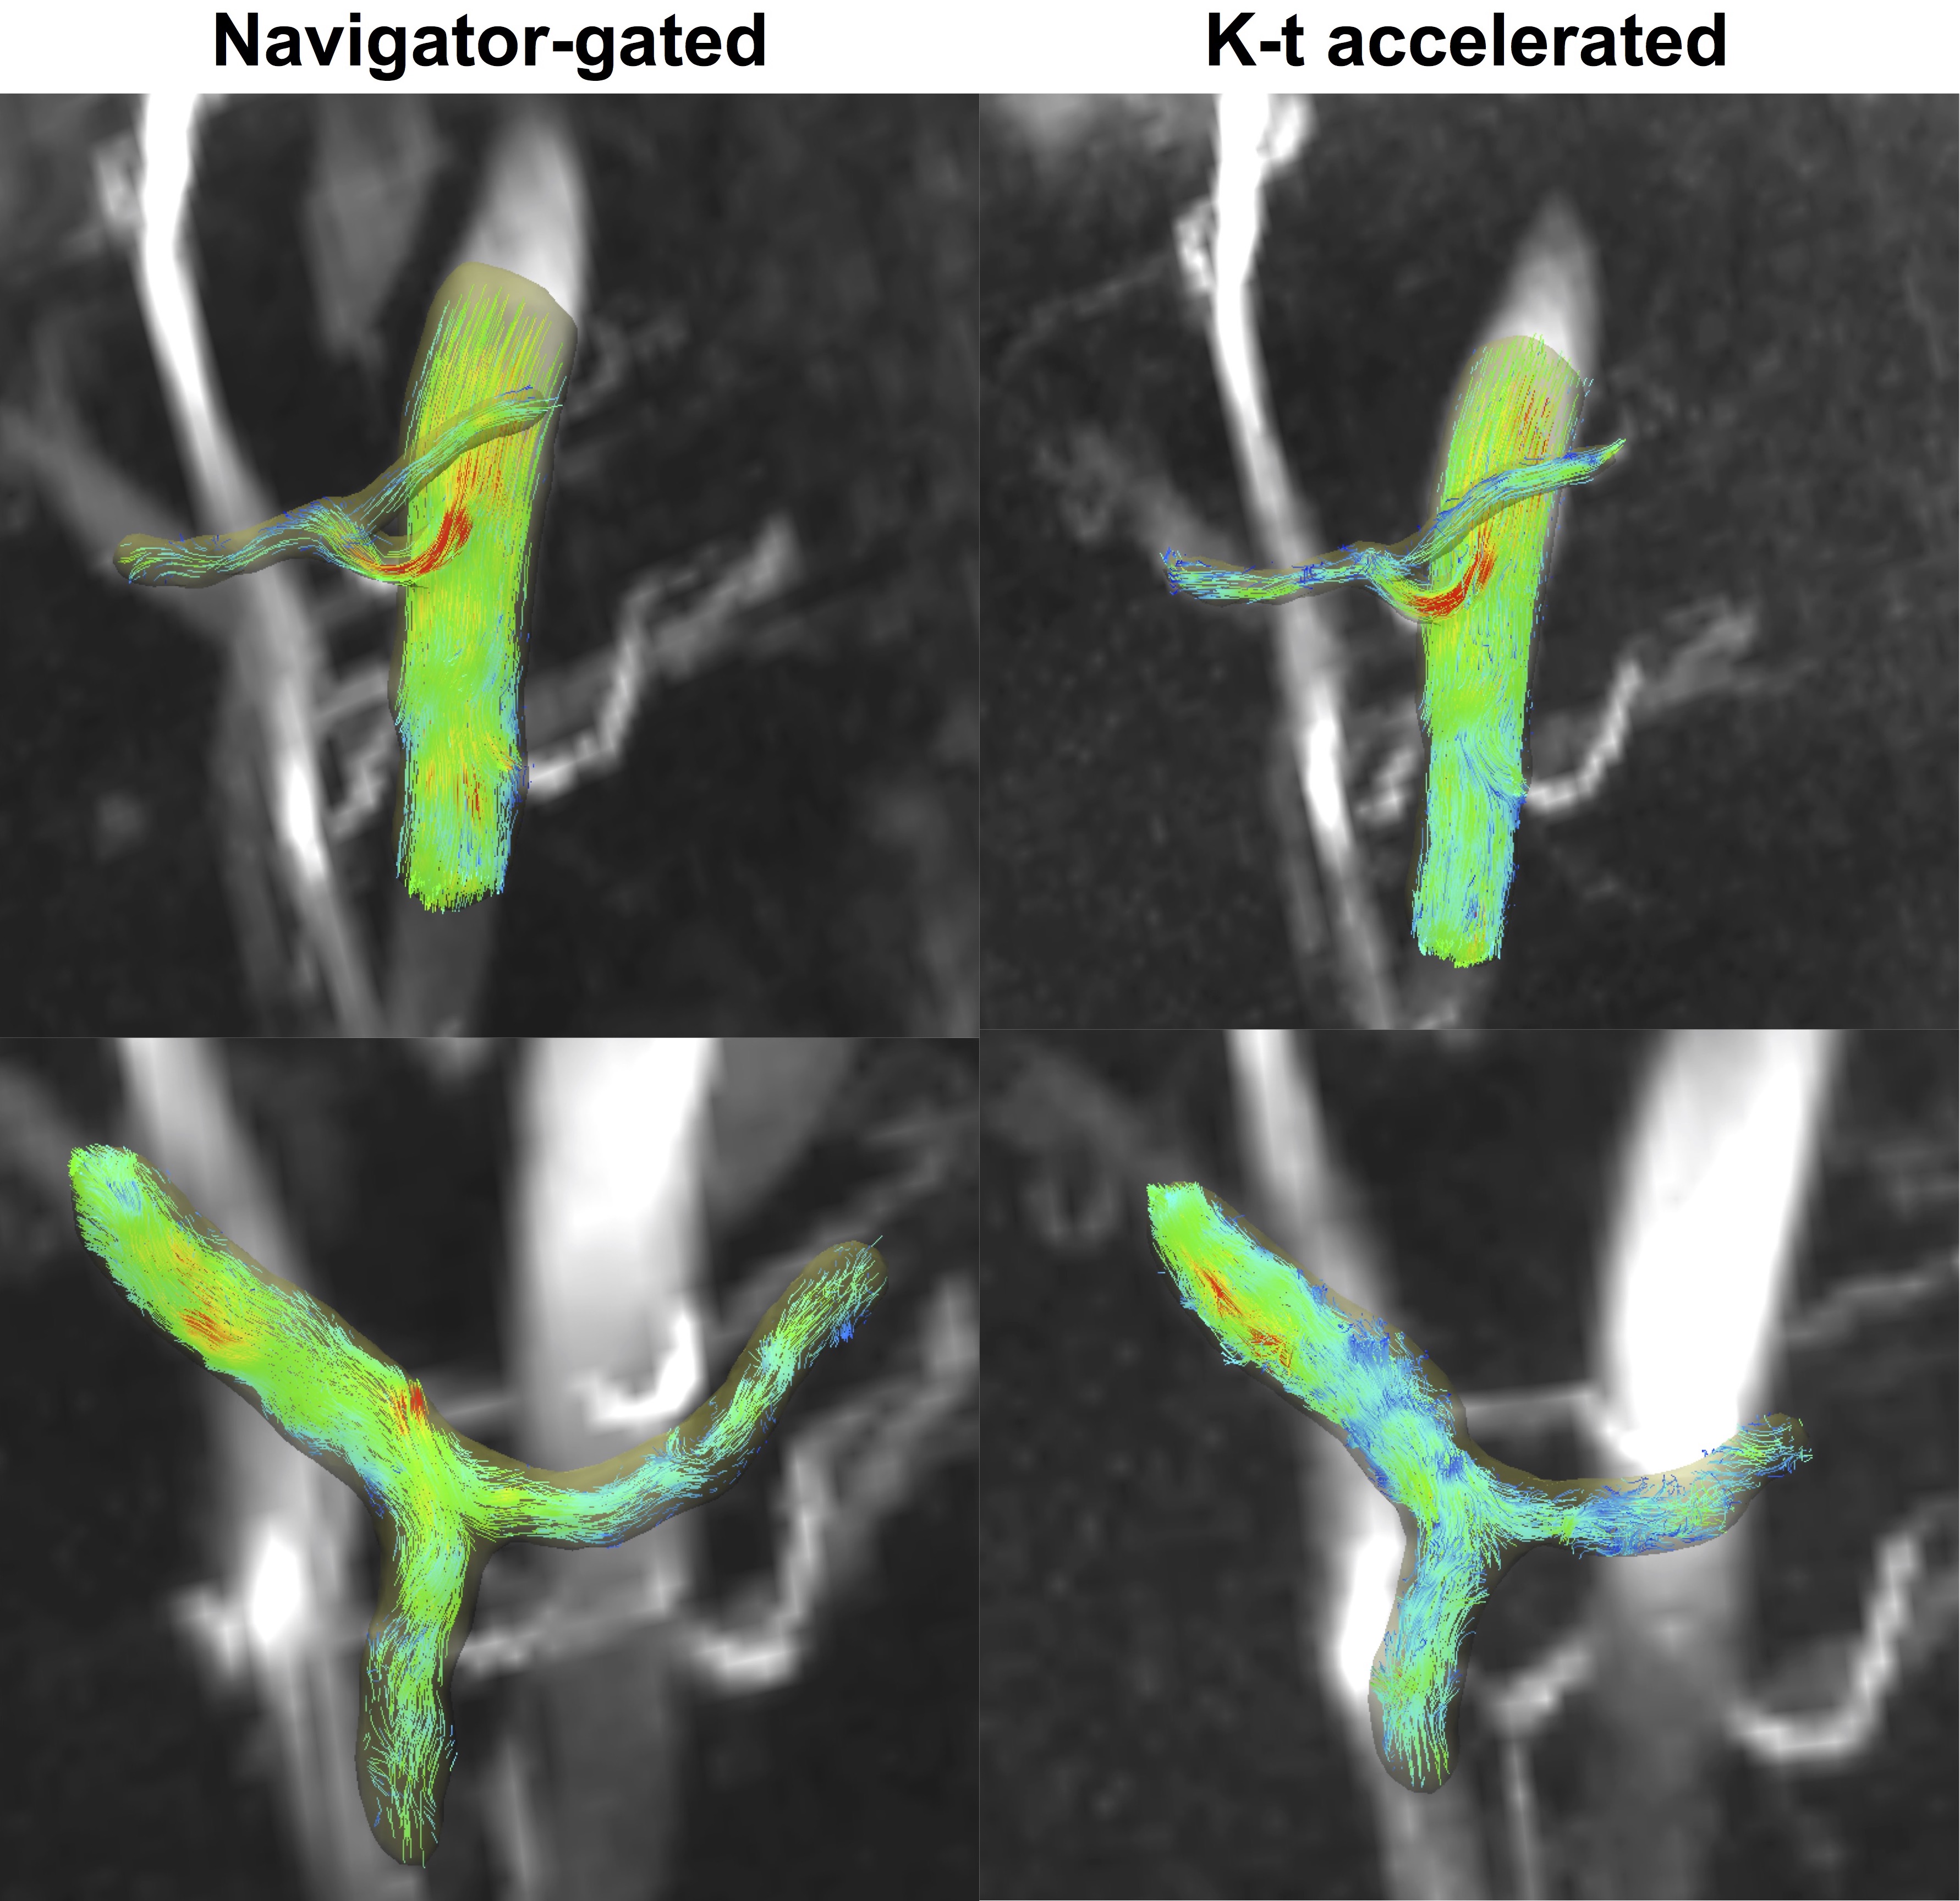
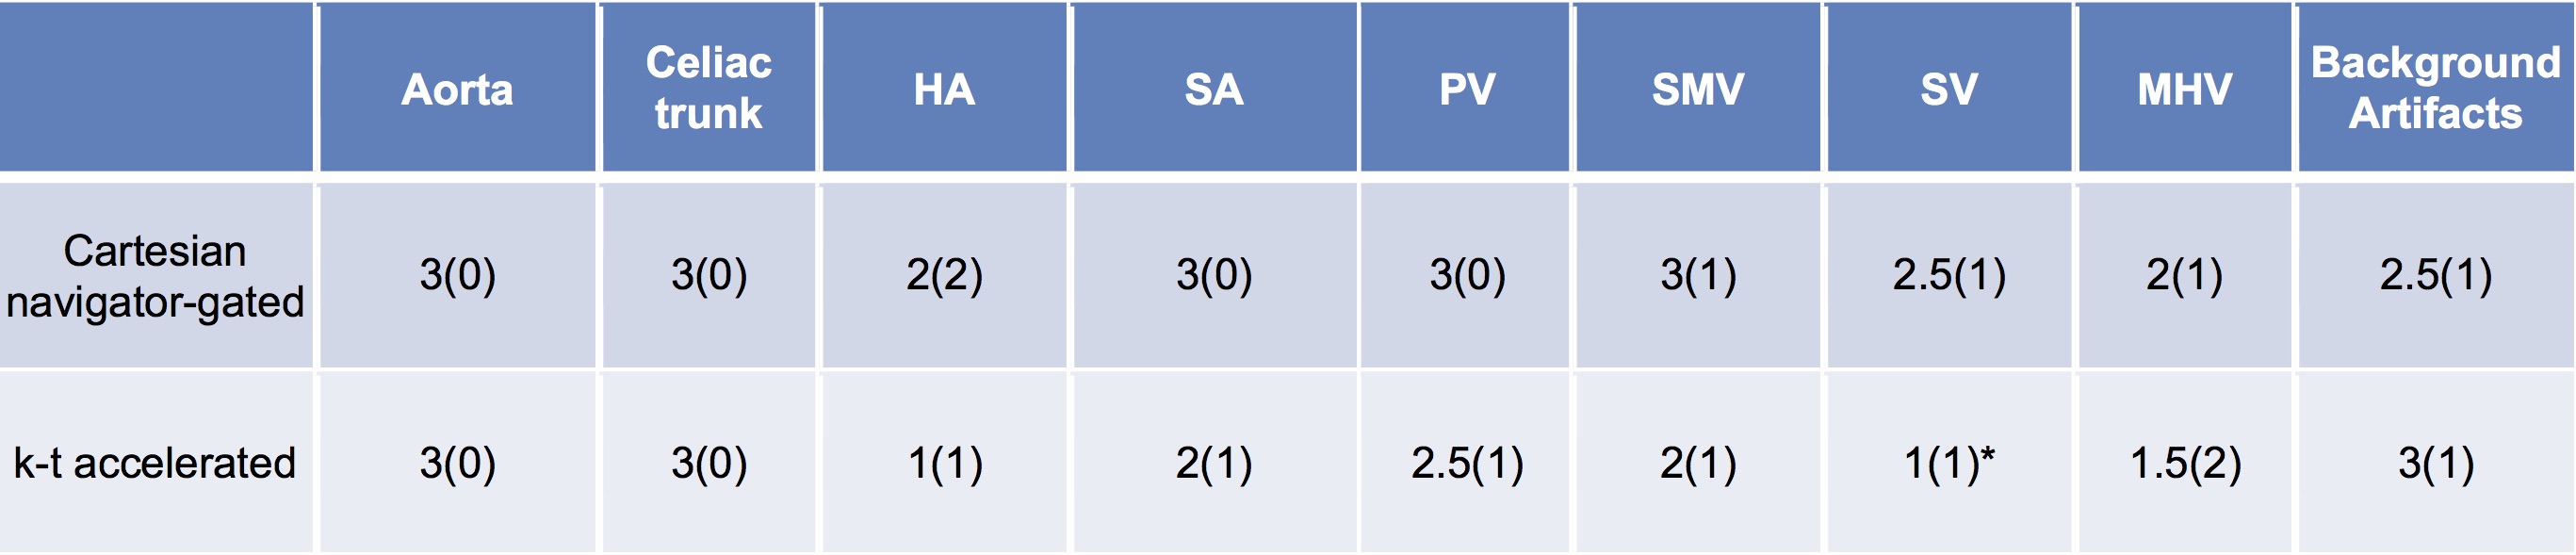
Ten patients (M/F 7/3, mean age 58y) with chronic liver disease and suspicion of portal hypertension were enrolled in this prospective study. 7/10 patients (cirrhosis/no cirrhosis: 4/3) had HVPG measurements and transjugular liver biopsy within one month of MRI. All patients underwent multiparametric abdominal MRI at 1.5T including: 1) a respiratory-navigated 4D flow1 (AT: 9:17 min±1:41 min) and 2) a free-breathing Cartesian k-t GRAPPA accelerated 4D flow sequence with an out-center-out k-space sampling pattern (AT: 3:11 min±12s)1,2. Both coronal-oblique acquisitions covering the abdominal vessels with matched parameters (VENC of 60 cm/sec, TR/TE/FA: 5.9 ms/3.4 ms/15°, 3 k-space segments/cardiac frame, 70.8 ms temporal resolution, 9-12 cardiac phases, 24 slices, resolution 2.5x2.5x2.5mm3) were obtained 10 min after injection of gadoxetic acid. The portal (PV), superior mesenteric (SMV), splenic (SV) and middle hepatic (MHV) veins, the supraceliac aorta (Ao) and its celiac branches were segmented (Fig.1) using a centerline detection algorithm3 in prototype software (Siemens Healthineers). Two independent observers performed segmentations for the respiratory-navigated and k-t accelerated acquisitions. One observer provided qualitative scoring of vessel conspicuity (0, vessel not seen; 1, severely to moderately blurred; 2, mildly blurred; and 3, well delineated) and background artifacts (1, severe; 2, moderate; and 3, minimal/none) for both acquisitions. Time-averaged vessel cross-section area, through-plane velocity and flow were measured. Inter-sequence and interobserver agreement on vessel identification was evaluated by Cohen’s kappa. Inter-sequence and interobserver agreement of measurements was evaluated by coefficient of variation (CV) and Bland-Altman statistics. Differences in measurements between the k-t accelerated and navigator-gated sequence were calculated, and expressed as percentage of the navigator-gated measurement. The statistical significance of differences in parameters and quality scores between sequences was tested using paired Wilcoxon. Hemodynamic parameters were compared between patient groups according to cirrhosis status by Mann-Whitney tests, and correlated with HVPG using Spearman and Pearson correlations.Results
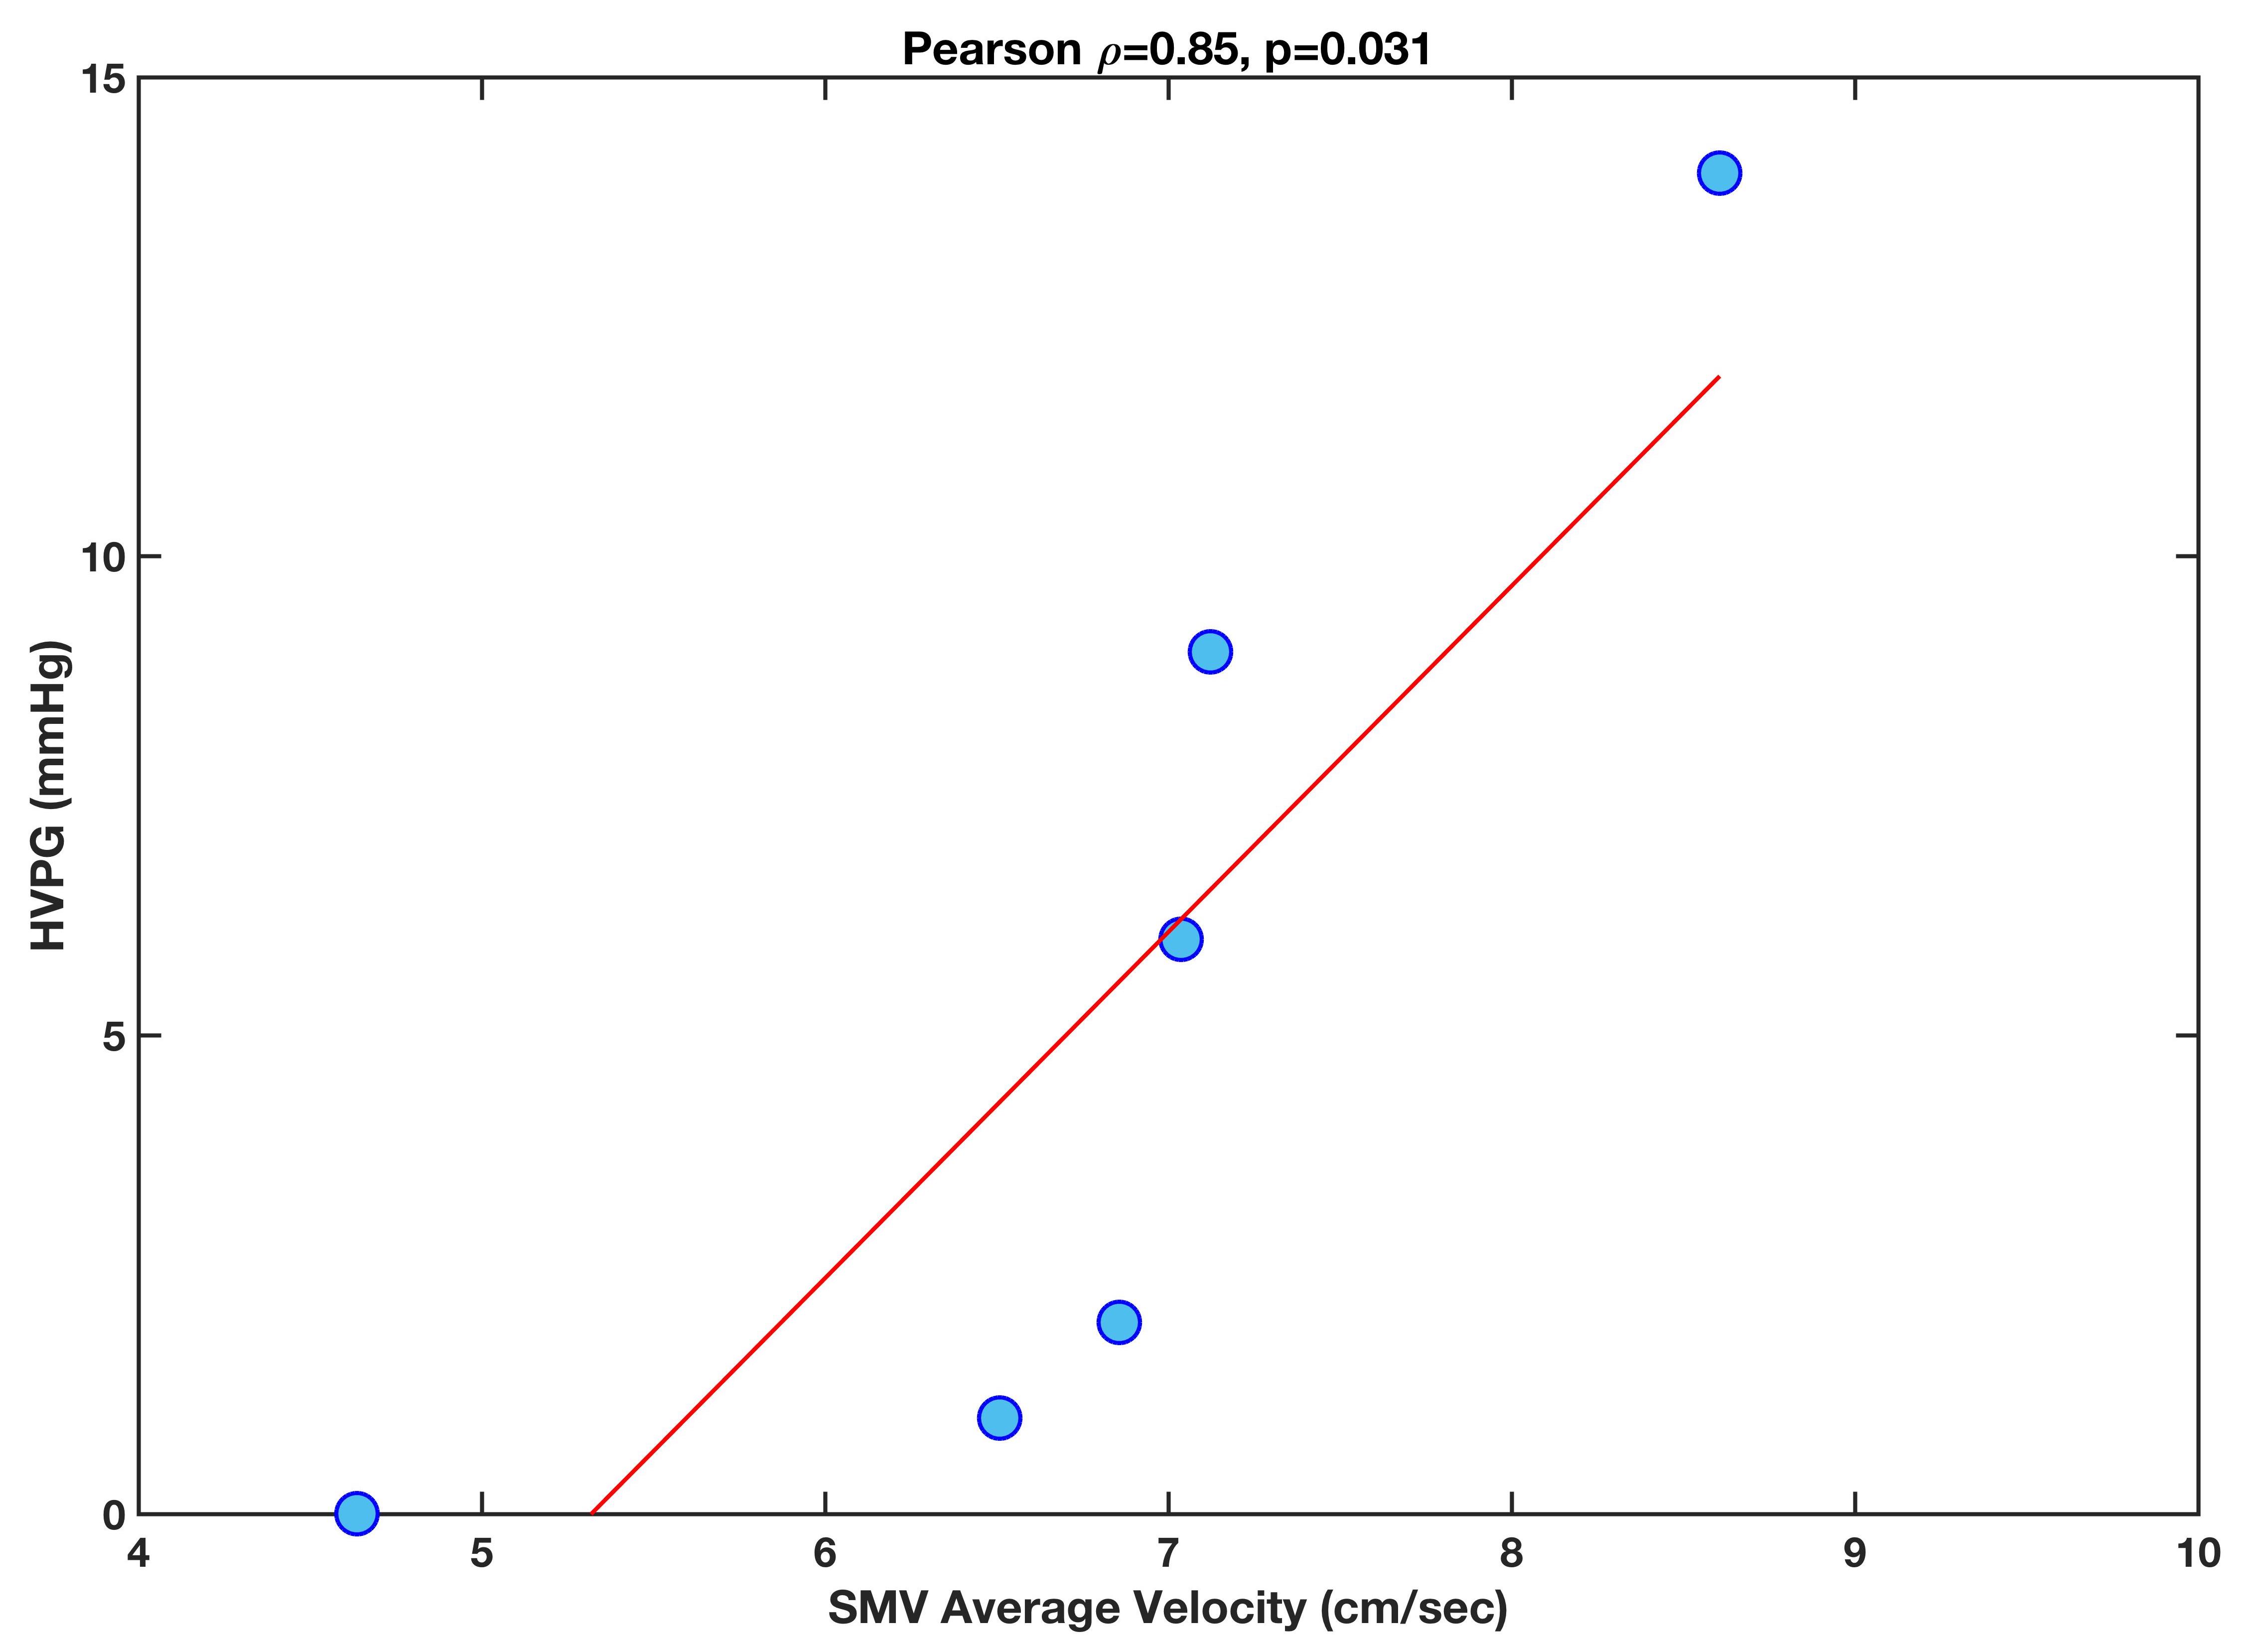
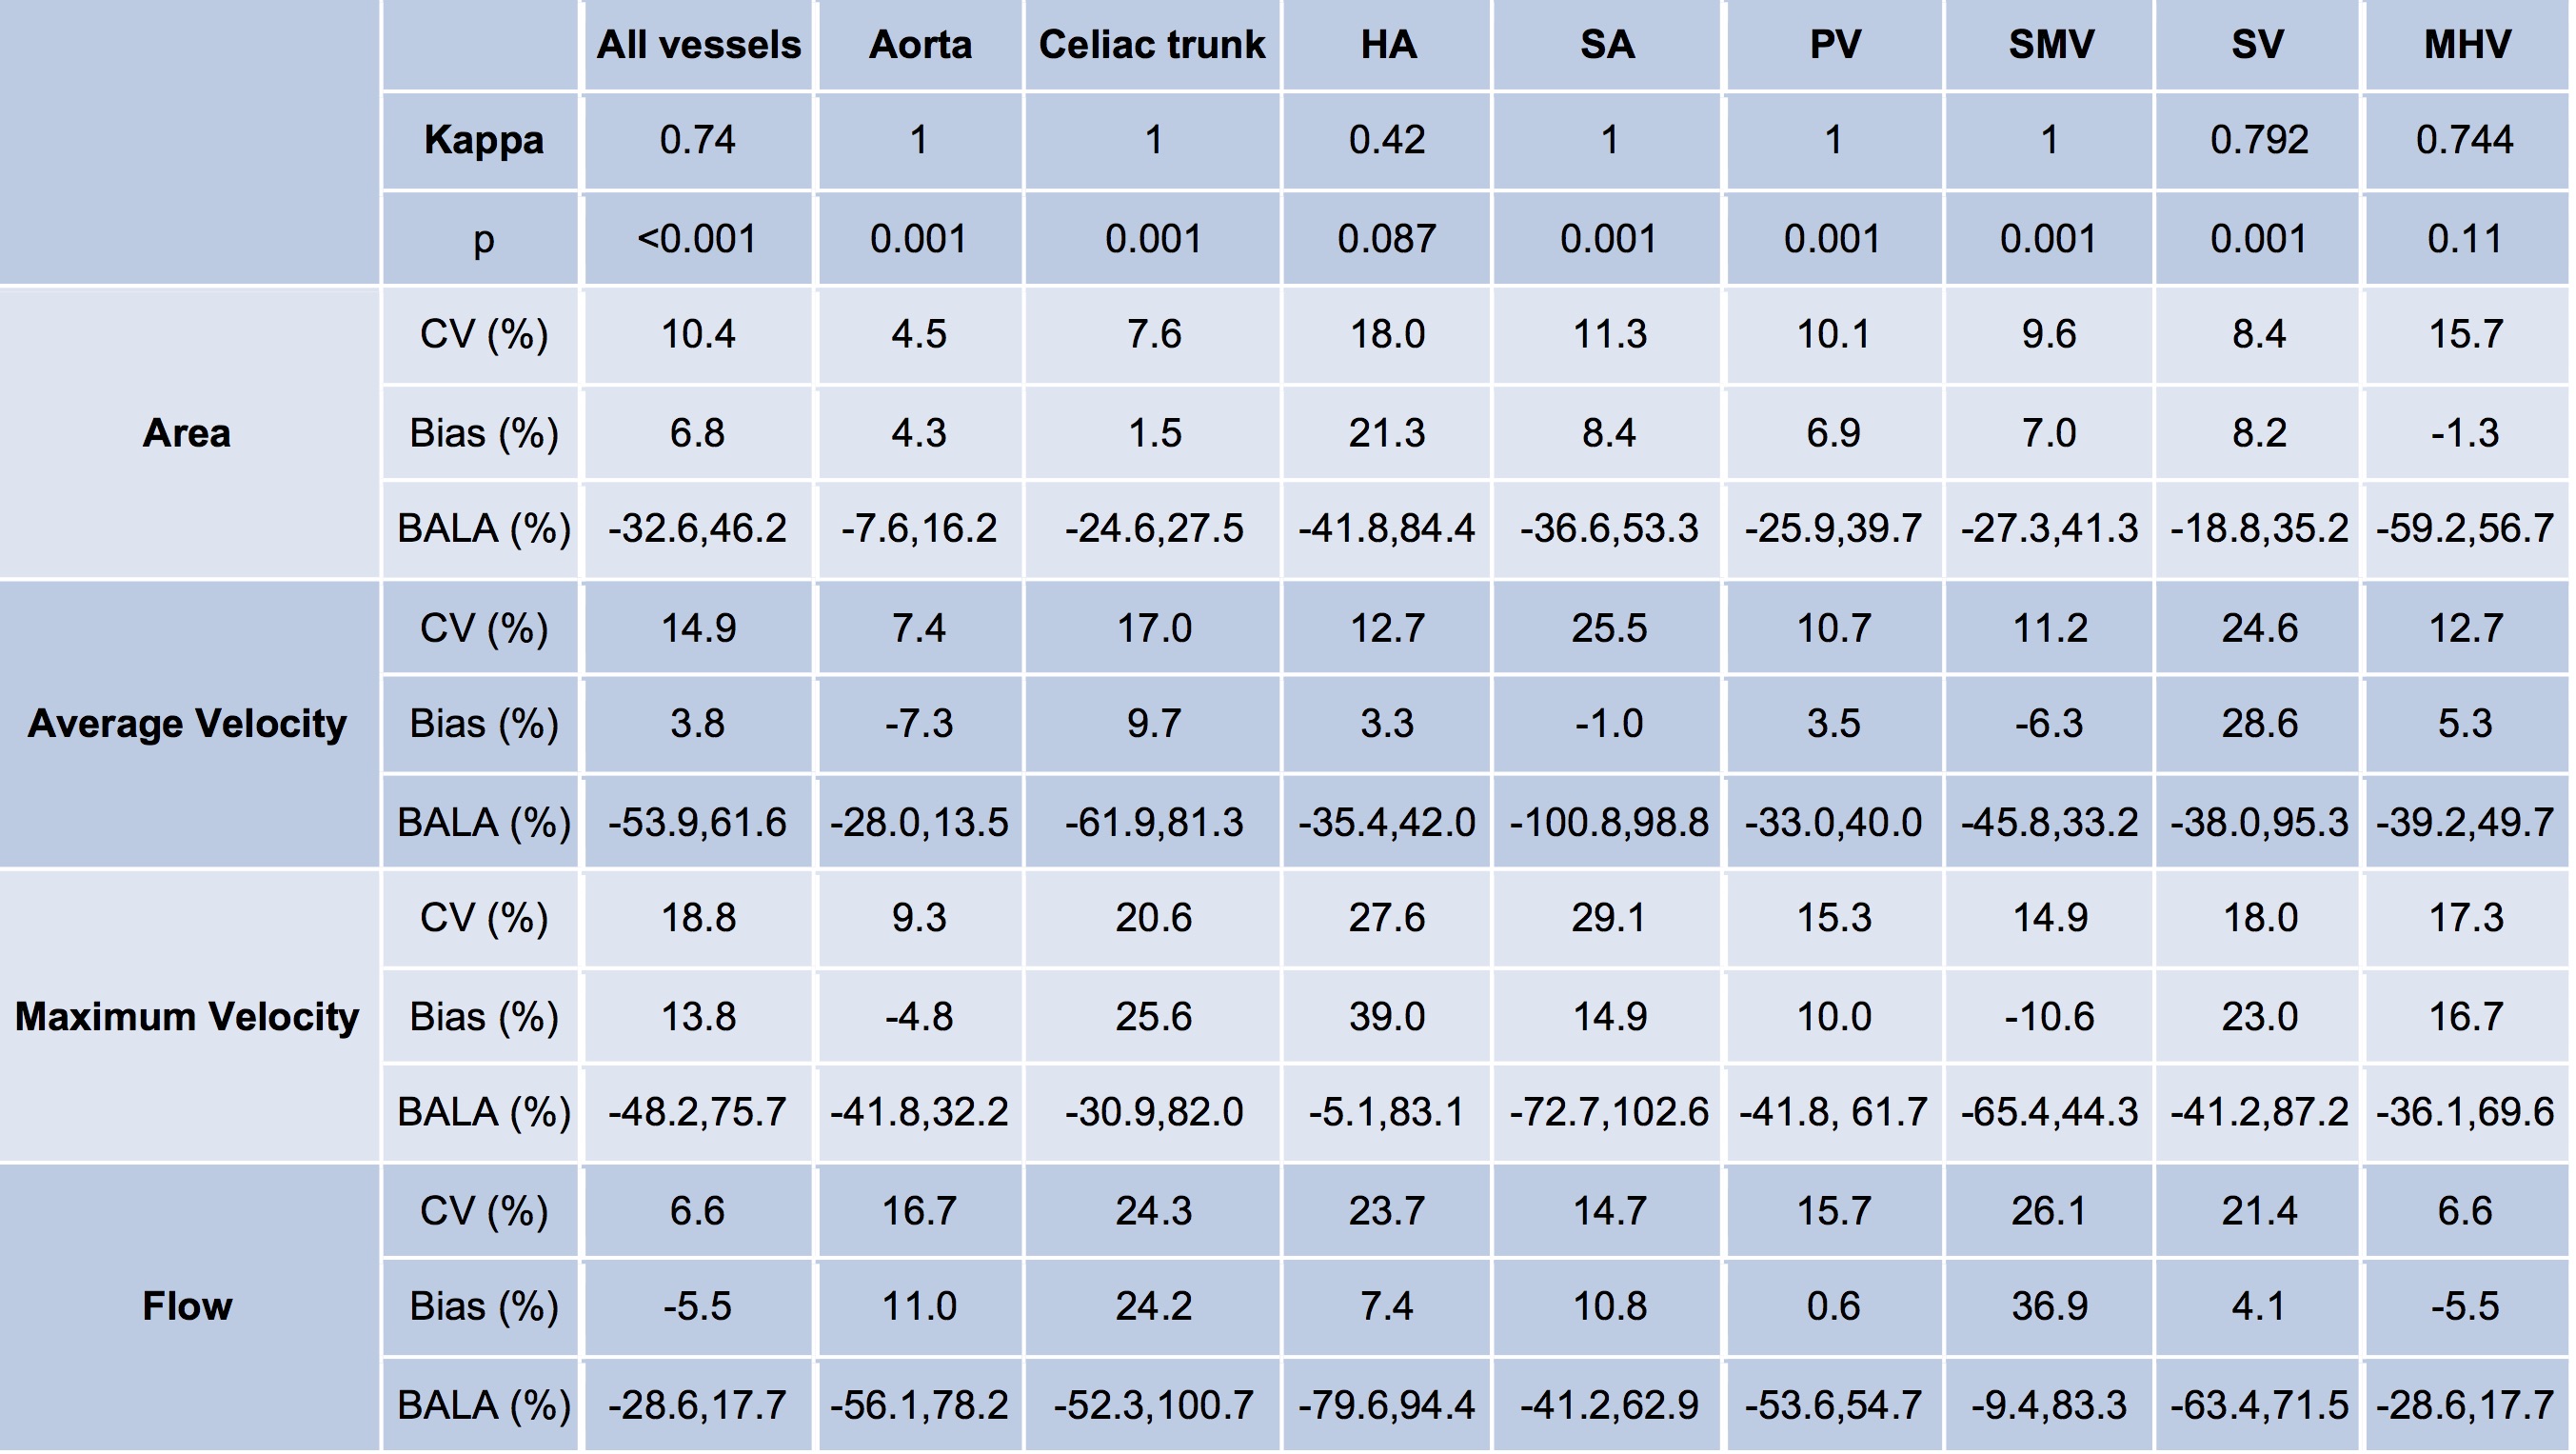
Vessel conspicuity and background artifacts were not significantly different between sequences (Table 1), except for SV, which had significantly less conspicuity on the free-breathing k-t sequence (p=0.0078), and for the celiac trunk, hepatic artery (HA) and SMV which showed a trend of lower conspicuity on the free-breathing k-t sequence (Table 1, p=0.0625). Vessels were identified with substantial agreement between sequences (Table 2: Cohen’s kappa=0.74, p<0.001), and between observers (kappa= 0.897/0.945, p<0.001). For all vessels, maximum velocity (Difference=-8.4±31.8%, p<0.001) and cross-section area (Difference=-4.8±19.3%, p=0.0023) were under-estimated with the k-t sequence, with under-estimation by as much as 30% for maximum velocities in the celiac trunk (Difference=-20.2±21.9%, p=0.00098) and HA (Difference=-31.3±16.2%, p=0.0078), and of flow in the SV (Difference=-29.7±17.0%, p=0.0156).Flow measurements had substantial inter-sequence agreement in PV and aorta (CV<15%, bias<11%, BALA<50%), and poorer agreement in small vessels such as the HA (CV=24%, bias=24%, BALA=[-52%,100%]).Hemodynamic measurements with both sequences showed acceptable inter-observer agreement with CV<20%, Bland-Altman bias <20%, BALA=[-75, 75], with the exception of flow measurements with the k-t sequence in the less conspicuous SV (CV=26%, bias=10.9%, BALA=[-76.5,98.3]). Average velocity in SMV measured with the k-t accelerated sequence was positively correlated to HVPG (Fig.2, Pearson r=0.85, p=0.03). No other parameters were correlated to HVPG, and there were no significant differences between groups (p>0.3). There was a trend of reduced maximum and time-averaged velocity measured with the navigator-gated sequence in the PV in patients with cirrhosis (maximum velocity for cirrhosis/ no cirrhosis: 14.8±2.1/25.0±2.5 cm/s, p=0.0571; averaged velocity for cirrhosis/no cirrhosis: 7.0±1.1/9.8±1.5 cm/s, p=0.0571).Discussion
We observed similar image quality and equivalent quantification of hemodynamic parameters in the large vessels as observed with the free-breathing k-t accelerated sequence in aortic imaging1. However, in smaller vessels, under-estimation of maximum velocities was significant. The reduction in PV velocity with cirrhosis confirms similar findings4-6. The positive association between SMV velocity and HVPG agrees with a previous study showing positive correlation with an imaging score predictive of portal hypertension7,8.Conclusions
Free-breathing k-t accelerated 4D flow allows three times shorter acquisition time with equivalent quantification in large hepatic vessels compared to respiratory-triggered acquisition, but with underestimation of maximum velocities in small arteries. A future comparison study will investigate whether the under-estimation in small arteries is an effect of the k-t acceleration or the free-breathing acquisition. Flow data will be correlated with degree of portal hypertension in a larger patient cohort.Acknowledgements
This research was supported by NIDDK grant 1R01DK113272.References
1. Bollache E, Barker AJ, Dolan RS, et al. k-t accelerated aortic 4D flow MRI in under two minutes: Feasibility and impact of resolution, k-space sampling patterns, and respiratory navigator gating on hemodynamic measurements. Magnetic resonance in medicine 2018;79(1):195-207.
2. Keller EJ, Kulik L, Stankovic Z, et al. JOURNAL CLUB: Four-Dimensional Flow MRI-Based Splenic Flow Index for Predicting Cirrhosis-Associated Hypersplenism. AJR American journal of roentgenology 2017;209(1):46-54.
3. Gulsun MA, Jolly M-P, Guehring J, et al. A Novel 4D Flow Tool for Comprehensive Blood Flow Analysis. In: ISMRM, Melbourne, Australia, 2012. (1176).
4. Stankovic Z, Csatari Z, Deibert P, et al. A feasibility study to evaluate splanchnic arterial and venous hemodynamics by flow-sensitive 4D MRI compared with Doppler ultrasound in patients with cirrhosis and controls. European journal of gastroenterology & hepatology 2013;25(6):669-675.
5. Gouya H, Grabar S, Vignaux O, et al. Portal hypertension in patients with cirrhosis: indirect assessment of hepatic venous pressure gradient by measuring azygos flow with 2D-cine phase-contrast magnetic resonance imaging. European radiology 2016;26(7):1981-1990.
6. Roldan-Alzate A, Frydrychowicz A, Niespodzany E, et al. In vivo validation of 4D flow MRI for assessing the hemodynamics of portal hypertension. Journal of magnetic resonance imaging : JMRI 2013;37(5):1100-1108.
7. Bane O, Peti S, Wagner M, et al. Hemodynamic measurements with an abdominal 4D flow MRI sequence with spiral sampling and compressed sensing in patients with chronic liver disease. Journal of magnetic resonance imaging : JMRI 2018.
8. Kihira S, Kagen AC, Vasudevan P, et al. Non-invasive prediction of portal pressures using CT and MRI in chronic liver disease. Abdominal radiology (New York) 2016;41(1):42-49.
Figures