1157
Improved robustness of R2* mapping using spin-density projection for liver iron quantification at 3 Tesla1Department of Radiology, UT Southwestern Medical Center, Dallas, TX, United States, 2Department of Radiology, University of Wisconsin at Madison, Madison, WI, United States
Synopsis
In patients with iron overload, liver iron concentration can be measured by R2- or R2*-MRI. While gradient-recalled-echo (GRE) based R2*-MRI holds practical advantages over spin-echo based R2-MRI, the R2* technique is more challenging in patients with severe iron overload with rapid signal decay. We introduce a technique known as spin density projection (SDP), which uses liver-to-subcutaneous fat spin density ratios as an internal reference to improve robustness of R2* fitting. We performed a computer simulation and retrospective analysis of GRE imaging data in 45 patients with suspected iron overload and compared R2* fitting without and with SPD. We found that SPD increased robustness by reducing standard deviation of R2* estimation.
INTRODUCTION
Liver R2 and R2* mapping allows noninvasive measurement of Liver Iron Concentration (LIC) in patients with iron overload1, 2. While gradient recalled echo (GRE)-based R2*-MRI is more widely available and practical than spin echo (SE)-based R2-MRI (FerriScan®, Resonance Health Ltd.), R2*-MRI remains technically challenging in patients with severe iron overload, especially at 3T, because rapid signal decay can exceed achievable echo sampling rates for standard Cartesian GRE acquisitions. To overcome this challenge, we introduce a technique known as spin density projection (SDP)3 to improve the robustness of R2* fitting. The purpose of this study was to evaluate whether SDP improves R2* fitting in severe iron overload at 3T.METHODS
Spin-density projection (SDP): SDP approximates the liver TE0 signal based on its expected spin-density (SD) relative to an internal reference, e.g. subcutaneous adipose tissue. In patients without iron loading, liver and adipose SDs can be measured from the water- and fat-only SD images from multiecho GRE Dixon reconstructions. Assuming liver SD is independent of LIC, the 95% confidence interval (CI) of liver-to-adipose SD ratio can be used to predict TE0 signal for iron-loaded livers.
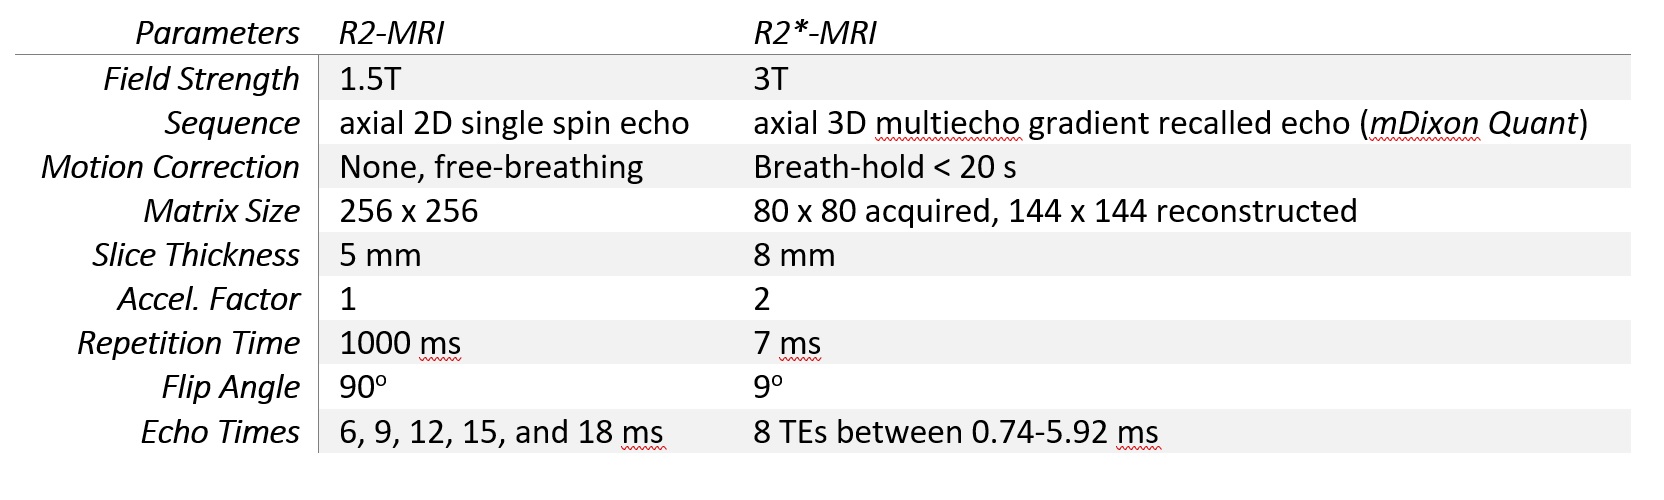
Study Population and MRI: This retrospective study included 45 adults with suspected iron overload enrolled in a prospective imaging trial. All subjects signed informed consent and underwent 2 acquisition protocols: R2-MRI at 1.5T on Philips Ingenia per FerriScan® protocol, and R2*-MRI at 3T on Philips Ingenia using multiecho GRE (mDixon Quant), as detailed in Table 1. The magnitude SE images were transmitted to Resonance Health for FDA-approved post-processing, liver R2 mapping, and LIC reporting. From the multiecho GRE acquisition, water-only, fat-only, fat-fraction (FF), and R2* images were reconstructed, as well as the source magnitude images at each echo time (TE).
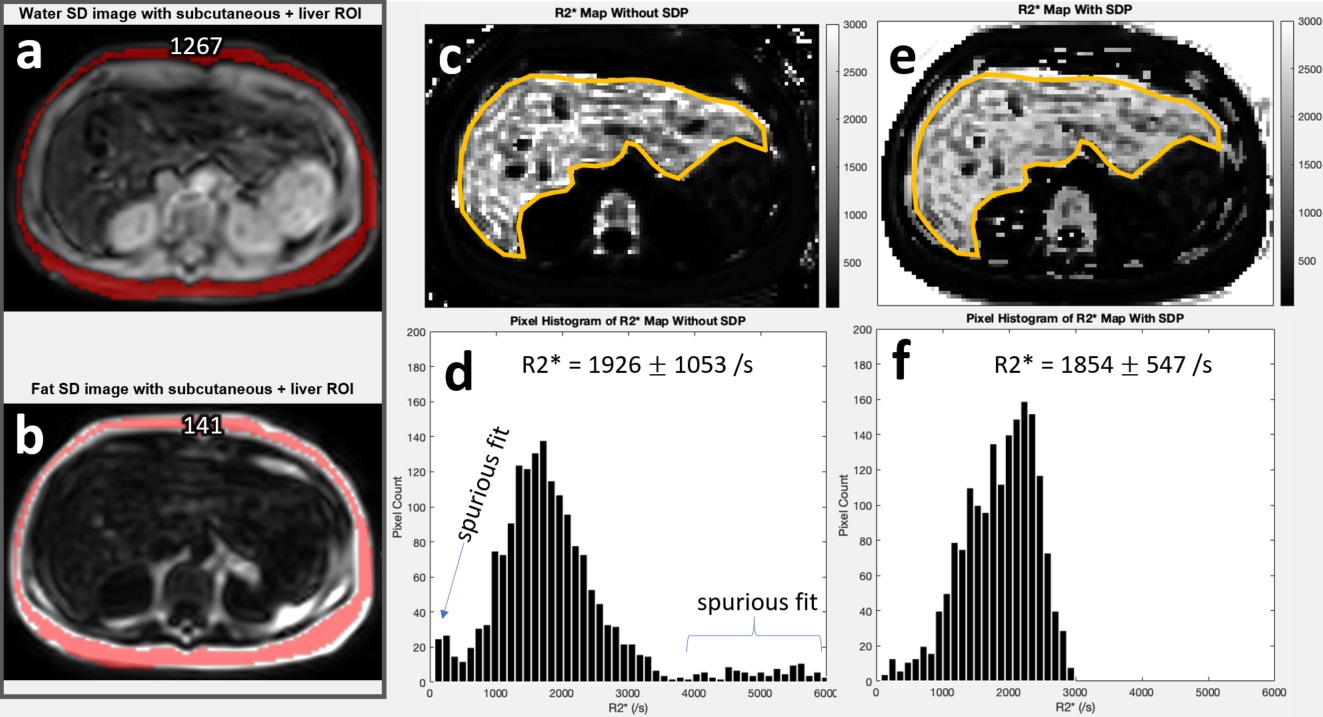
Liver-Subcutaneous Spin Density Ratio: In subjects with normal or borderline LIC (<3.2 mg/g per FerriScan®), subcutaneous adipose was segmented on the fat-only image corresponding to the FerriScan® R2 map, using a region-growing algorithm. The segmented region-of-interest (ROI) was copied onto the corresponding water-only images. From the mean pixel values of these segmented ROIs, total adipose SD was calculated as: SDtotal=SDwater+SDfat. The liver SD was calculated by manually segmenting the liver parenchyma on the water SD image and correcting for FF by: SDliver=SDwater/(1-FF). The 95% CI of liver-to-adipose SD ratio was calculated based on its mean and standard deviation.
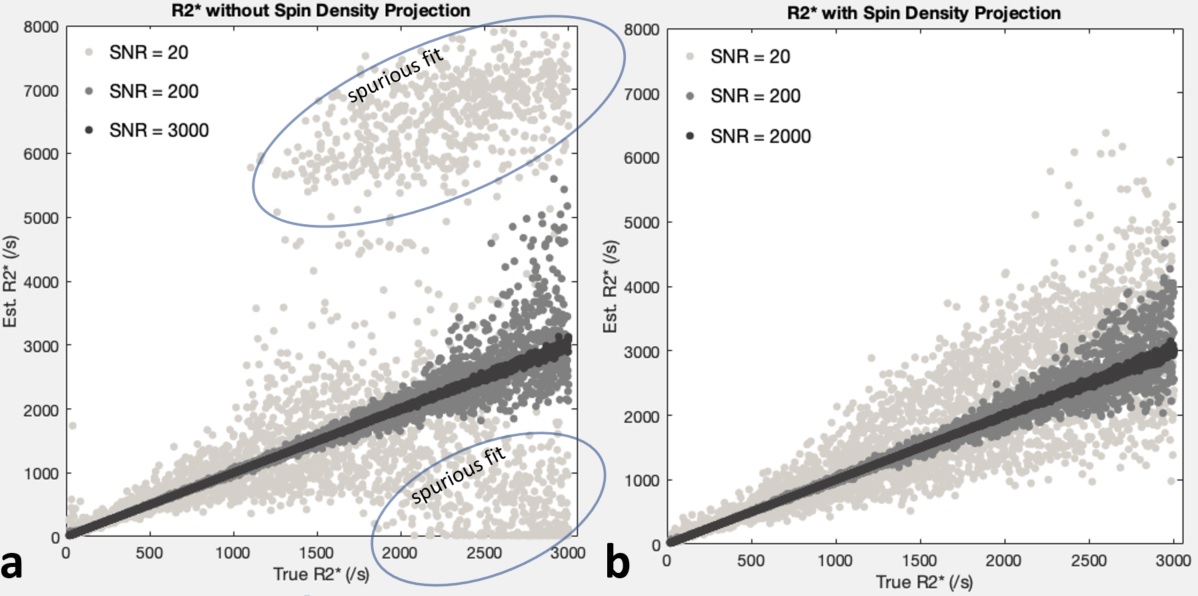
Monte-Carlo Simulation: In a Monte-Carlo simulation, complex noise was mixed with mono-exponential R2* decay signals at R2*=20-3000/s at signal-to-noise ratios of 20, 200, and 2000 based on the TE0 signal. The squared noise-signal mixture was modeled as |S(t)|2=A2exp(-2rt)+2σ2, where A is the amplitude, r is the R2* decay rate, t the echo time of multiecho GRE, and σ the noise standard deviation. The initial signal S(0) was modeled as a normal random variable according in vivo liver-to-adipose SD ratio distribution. Using nonlinear least squares, non-SDP fitting was performed with A and σ as unconstrained parameters, and SDP fitting was performed with A and σ as constrained parameters, with S(0) restricted within liver-to-adipose SD ratio 95% CI.
Human Study: In all subjects, the raw multiecho signal magnitudes were divided by the average adipose SD measured on the same slice, such that the liver signal at TE0 is normalized to liver-to-adipose SD ratio. Pixel-by-pixel R2* maps were calculated without and with SDP, on the same slice as FerriScan® R2 map. The calculated liver R2* maps were segmented, the mean R2* and standard deviation calculated, and compared against FerriScan® LIC as the reference standard.
RESULTS
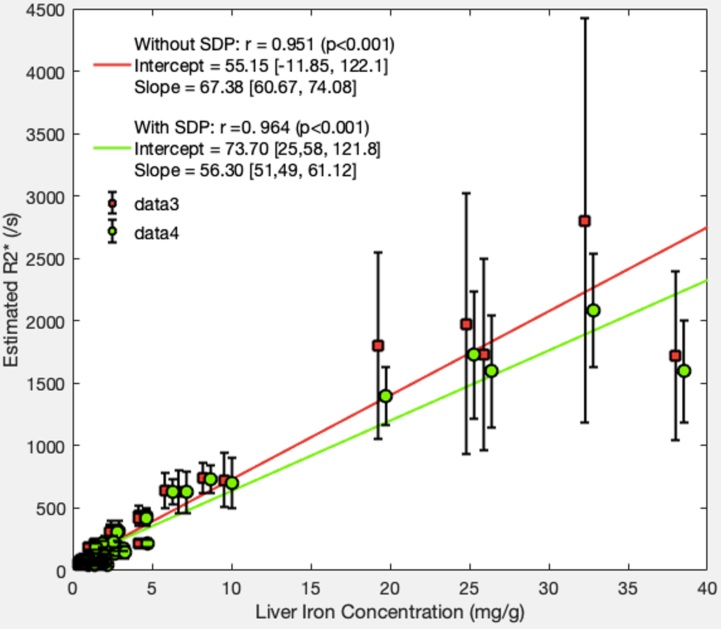
The study population had male/female ratio of 25/20, age 46.0±14.5 years. 33 subjects (73.3%) had LIC<3.2 mg/g, in whom the mean±standard deviation of the liver-to-adipose SD ratio was 0.54±0.07 with 95% CI of [0.40, 0.67]. Figure 1 shows R2* fitting of the simulated noise-signal mixtures, without and with SDP. Figure 2 illustrates the adipose SD measurement on water- and fat-only images, and resultant typical R2* maps in one subject with severe iron overload (LIC=32.3 mg/g). Figure 3 shows the mean and standard deviation of the liver R2* maps with and without SDP, as a function of LIC.DISCUSSION
The simulation results indicate SDP improves R2* fitting robustness, particularly in high R2* range. While human liver R2* data also suggest improved R2* standard deviation in patients with high LIC, data is limited due to small number of subjects with severe iron overload (n=5) with LIC>15 mg/g. The SD ratio reference range based on the T1-weighted GRE could be biased as iron-induced T1-shortening may occur in iron-loaded livers.CONCLUSION
SDP may improve R2* fitting in severe iron overload at 3T where precise R2* estimation is technically challenging. Further human studies are needed to determine the benefit of SDP in clinical practice.Acknowledgements
This study was supported in part by NIH research grant R01 DK100651-04.References
1. St Pierre TG, Clark PR, Chua-Anusorn W, Fleming AJ, Jeffrey GP, Olynyk JK, Pootrakul P, Robins E, Lindeman R. Noninvasive measurement and imaging of liver iron concentrations using proton magnetic resonance. Blood. 2005 Jan 15;105(2):855-61.
2. Wood JC, Enriquez C, Ghugre N, Tyzka JM, Carson S, Nelson MD, Coates TD. MRI R2 and R2* mapping accurately estimates hepatic iron concentration in transfusion-dependent thalassemia and sickle cell disease patients. Blood. 2005 Aug 15;106(4):1460-5.
3. Clark PR, Chua-anusorn W, St Pierre TG. Bi-exponential proton transverse relaxation rate (R2) image analysis using RF field intensity-weighted spin density projection: potential for R2 measurement of iron-loaded liver. Magn Reson Imaging. 2003 Jun;21(5):519-30.
Figures