1156
Multimodal MRI Combined with Liver Volume for Quantitative Assessment of Liver Function in Patients With CirrhosisChenxia Li1,2, Haitian Liu3, Xiang Li1, Rong Wang1, Jian Yang1,2, and Yuelang Zhang1
1Department of Medical Imaging, The First Affiliated Hospital of Xi'an Jiaotong University, Xi'an, China, 2Department of Biomedical Engineering, School of Life Science and Technology of Xi’an Jiaotong University, Xi'an, China, 3The Third Hospital of HeBei Medical University, Shi jiazhuang, China
Synopsis
This study aim to combine multimodal MRI with liver volume for quantitative assessment of liver function in patients with cirrhosis. Eighty-five subjects underwent GD-EOB-DTPA enhanced MR and IVIM-DWI.Through statistical analysis, RE, D* and Vliver/Vspleen from modeling group were selected as optimal indicators. Using multiple regression to establish a multi-parametric model for liver function assessing: F(x). The ROC analysis of the validation group showed that it had an AUC of 0.973 in distinguishing Child-Pugh A group and Child-Pugh B and C group. The results showed it could evaluate the overall liver function and expected to be a method for preoperative local liver function assessment.
INTRODUCTION
Current clinical assessment of liver function is based on systemic laboratory examinations and lacks a method for accurately assessing the function of the whole liver, liver lobe or liver segment. Gd-EOB-DTPA(Primovist, Bayer Schering Pharma, Germany) can be specifically taken up by normal liver cells. When liver function is impaired, the amount of Gd-EOB-DTPA absorbed by liver cells decreased. The resulting change in signal intensity can be used to assess liver function1. Intravoxel Incoherent Motion-Diffusion Weighted Imaging(IVIM-DWI) reflects both diffusion and perfusion of liver, which has certain potential for evaluating liver function2. Liver volume is another important clinical indicator of liver function3,4. This study aims to establish a non-invasive assessment model of liver function by combining Gd-EOB-DTPA enhanced MR, IVIM-DWI and liver volume to provide a reference for preoperative assessment of liver function.METHODS
METHODS: This retrospective study was approved by our institutional review board. Eighty-five subjects(63 in modeling group and 22 in validation group) performed MRI scan on a 3.0T scanner(GE Discover MR750, USA). Three-phase enhanced scan and 20-minute delayed scan were performed using Gd-EOB-DTPA(0.1 ml/kg). The b value of the IVIM-DWI sequence was set to 0, 20, 30, 50, 80, 100, 160, 200, 400, 600, 800 s/mm2. The signal intensity(SI) of liver, spleen and paravertebral muscles were measured at the same axial slice before and after enhancement(Figure 1). Relative enhancement (RE, SIpost liver-SIpre liver/SIpre liver) ,liver-spleen SI ratio after enhancement (SIliver/SIspleen), liver-muscle SI ratio after enhancement (SIliver/SImuscle), spleen contrast enhanced index (CEIspleen, (SIpost liver / SIpost spleen) / (SIpre liver / SIpre spleen) ) and muscle contrast enhancement index (CEImuscle, ( SIpost liver / SIpost muscle) / (SIpre liver / SIpre muscle) ) were acquired. D (real diffusion coefficient), f (perfusion fraction) , and D* (blood pseudodiffusion coefficient) were acquired by using GE AW Functool(Figure 2). Vliver, Vspleen, Vliver/Vspleen were obtained using 3D image generation software Mimics 16.0 (Materialise, Belgium)(Figure 3) . The subjects were divided into three groups :Child-Pugh A, Child-Pugh B and Child-Pugh C. Select one optimal parameter from each of the three methods to construct a multivariate model (F(x)) to assess liver function and validated. Statasis analysis was performed using SPSS 25.0. A P value less than 0.05 was considered statistically significant.RESULTS
Among all the parameters from GD-EOB-DTPA enhanced MR, RE displayed significant statistical differences between different liver function groups(P<0.05). Among the three parameters derived from IVIM-DWI, D* displayed significant statistical differences between different liver function groups(P<0.05). Among the three parameters from liver volume, Vliver/Vspleen displayed significant statistical differences between different liver function groups(P<0.05). ROC analysis showed that these three parameters displayed the highest value in distinguishing Child-Pugh A group and Child-Pugh B and C in the respective evaluation methods.The area under the curve(AUC) were 0.917, 0.929, and 0.885, respectively(Figure 4). RE, D*, and Vliver/Vspleen were selected as effective parameters for model establishment. The model was acquired by multiple regression: F(x)=3.96-1.243×RE-0.034×D*-0.080×Vliver/Vspleen(R2=0.811, P<0.001). The ROC analysis of the validation group showed that the AUC of F(x) in distinguishing Child-Pugh A group and Child-Pugh B and C group was 0.973(Figure 5).DISCUSSION
Hepatocytes are damaged during liver cirrhosis, and the expression of organic anion transport polypeptide on hepatocyte membrane is decreased. It affects the absorption of Gd-EOB-DTPA, resulting in a decrease in the degree of liver specific signal enhancement. Therefore, RE could be used as an effective indicator for evaluating liver function5,6. Different degrees of collagen fibrosis during liver cirrhosis, hepatic sinus stenosis, decreased capillary perfusion, which leads to a decrease in liver perfusion. All of these could be reflected by a decrease of D*, so D* was selected as an effective indicator for evaluating liver function7. As liver fibrosis progresses, hepatocyte regeneration is weakened, resulting in a decrease in liver volume8. At the same time, the volume of the spleen increases, so Vliver/Vspleen was selected as an indicator for evaluating liver function4. An ideal liver function assessment model should be a combination of metabolism and morphology. Therefore, this study combined functional changes in hepatocytes, tissue perfusion and liver morphological changes to establish a liver function assessment model. The results of the validation group showed that the model displayed excellent value in assessing overall liver function. In addition, these three parameters can be obtained by placing the ROI in a certain liver lobe or liver segment. Therefore, it is speculated that it could be used to evaluate the function of the liver lobe or liver segment.CONCLUSION
This study established a multi-parameteric model for assessing liver function. It could evaluate the overall liver function and expected to be a method for preoperative local liver function assessment.Acknowledgements
No acknowledgement found.References
- Van Beers B E, Pastor C M, Hussain H K. Primovist, Eovist: what to expect?. Journal of Hepatology, 2012, 57(2):421-429.
- Ichikawa S, Motosugi U, Morisaka H, et al. MRI-based staging of hepatic fibrosis: Comparison of intravoxel incoherent motion diffusion-weighted imaging with magnetic resonance elastography. Journal of Magnetic Resonance Imaging, 2015, 42(1):204-210.
- Li WX, Zhao XT, Chai WM, et al. Hepatitis B virus-induced liver fibrosis and cirrhosis: the value of liver and spleen volumetry with multi-detector spiral computed tomography. Journal of digestive diseases, 2010, 11(4): 215-223.
- Liu P, Li P, He W, et al. Liver and spleen volume variations in patients with hepatic fibrosis. World journal of gastroenterology, 2009, 15(26): 3298-3302.
- Wibmer A, Prusa AM, Nolz R, et al. Liver failure after major liver resection: risk assessment by using preoperative Gadoxetic acid-enhanced 3-T MR imaging. Radiology, 2013, 269(3):777-786.
- Verloh N, Utpatel K, Haimerl M, et al. Liver fibrosis and Gd-EOB-DTPA-enhanced MRI: A histopathologic correlation. Scientific Reports, 2015, 5:15408.
- Patel J, Sigmund EE, Rusinek H, et al. Diagnosis of cirrhosis with intravoxel incoherent motion diffusion MRI and dynamic contrast-enhanced MRI alone and in combination: preliminary experience. Journal of Magnetic Resonance Imaging, 2010, 31(3):589-600.
- Haimerl M, Schlabeck M, Verloh N, et al. Volume-assisted estimation of liver function based on Gd-EOB-DTPA–enhanced MR relaxometry. European Radiology, 2016, 26(4):1-9.
Figures

Figure 1 ROIs were placed at each lobe of the liver parenchyma(A). ROIs were placed at the center of the spleen and both sides of the paravertebral muscles(B).

Figure 2 According to the image of b=0 s/mm2 at the hilar level, ROIs were placed at each hepatic lobe(A). The ROIs were automatically copied to the pseudo-color maps of D, D* and f, and the corresponding parameters were obtained(B,C,D).

Figure 3 By delineating the boundary of liver and spleen on the axis and corona of liver(A), the three-dimensional solid model of liver and spleen was obtained(B).

Figure 4 ROC analysis of liver function evaluation by various parameters from GD-EOB-DTPA enhanced MR, IVIM-DWI and liver volume. Relative enhancement(RE) displayed highest AUC (0.917) among the five signal intensity related parameters(A). D* displayed highest AUC (0.929) among the three IVIM-DWI derived parameters(B). The Vliver/Vspleen displayed highest AUC (0.885) among the three liver volume related parameters(C).
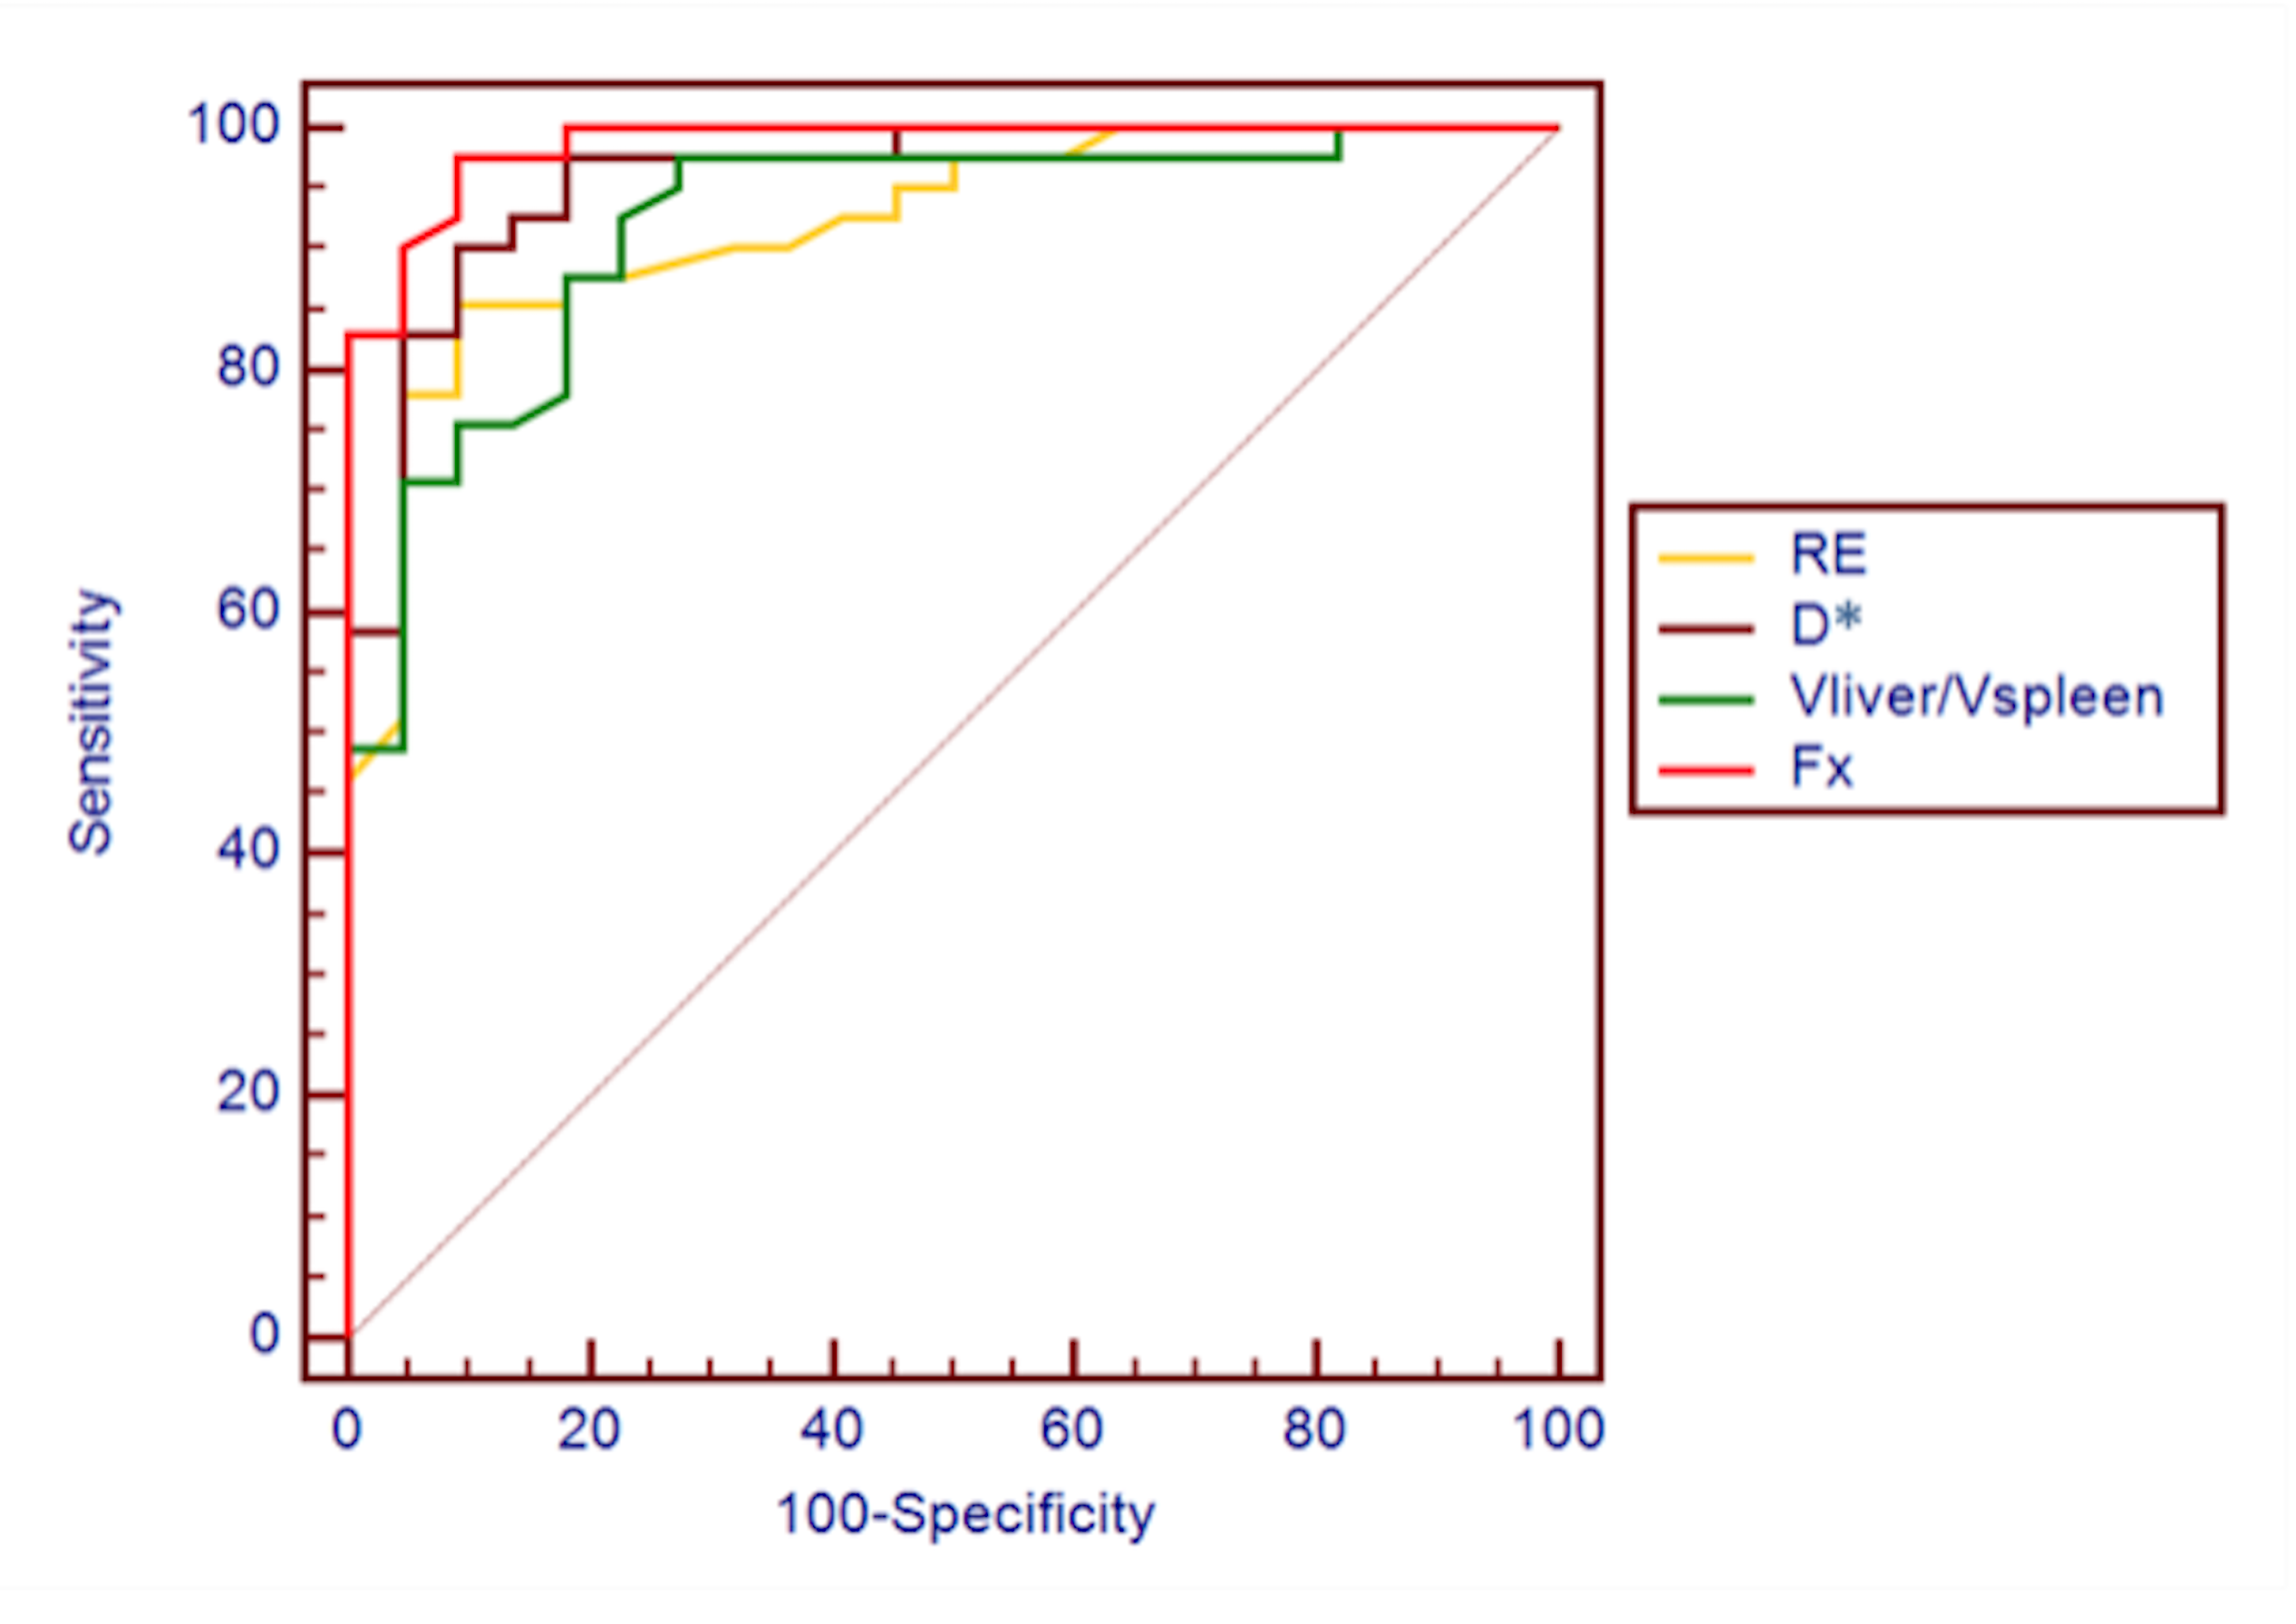
Figure 5 ROC analysis in distinguishing Child-Pugh A group and Child-Pugh B and C groups. Compared with the three parameters independently assessing liver function, F(x) displayed the highest AUC(0.973).