1155
Motion-Robust, High-SNR Fat Quantification using a Variable Flip Angle Approach1Radiology, University of Wisconsin-Madison, Madison, WI, United States, 2Medical Physics, University of Wisconsin-Madison, Madison, WI, United States, 3Biomedical Engineering, University of Wisconsin-Madison, Madison, WI, United States, 4Emergency Medicine, University of Wisconsin-Madison, Madison, WI, United States, 5Medicine, University of Wisconsin-Madison, Madison, WI, United States
Synopsis
Current chemical shift encoded (CSE)-MRI techniques enable quantification of liver fat using 3D breath-hold methods. However, many patients are unable to sustain breath-holds, leading to motion artifacts that cause variability and bias in fat quantification. A recently developed 2D sequential CSE-MRI technique is motion-robust with short temporal footprint but suffers from low SNR due to the small flip angles used to avoid T1 bias. To overcome this limitation, we propose a novel centric encoding variable flip angle (CEVFA) technique that minimizes T1 bias in fat quantification while achieving higher SNR performance and validate this technique in phantoms and in-vivo scans.
Introduction:
Accurate liver fat quantification is needed for the assessment of non-alcoholic fatty liver disease (NAFLD)1. Conventional confounder-corrected chemical shifted encoded-MRI (CSE-MRI) enables quantification of proton-density fat fraction (PDFF) from 3D breath-hold multi-echo spoiled gradient echo (SGRE) acquisitions2,3,4,5. However, many patients are unable to perform prolonged breath-holds, leading to artifacts, variability and bias in PDFF measures.
In contrast, recently developed 2D sequential CSE-MRI with short temporal footprint enables motion-robust PDFF mapping6,7. Unfortunately, this technique has low signal-to-noise ratio (SNR) because it combines short TR, low flip angles (FAs), and linear phase encoding to avoid T1-related bias in PDFF.
Alternatively, centric phase encoding (non-steady state imaging) with higher FAs may provide increased SNR, however this will generally introduce blurring due to the signal decay during the approach to steady state. Therefore, the tradeoff between T1 bias, SNR and image blurring presents a fundamental limitation for constant-FA 2D sequential CSE-MRI.
In this study, a novel Centric Encoding Variable Flip Angle (CEVFA) acquisition is proposed to simultaneously: 1) minimize T1 bias, 2) maximize SNR and 3) minimize image blurring, within a short temporal footprint. This work describes the CEVFA technique and validates it in phantoms and in-vivo.
Methods:
Proposed CEVFA Pulse Sequence Design:
In CEVFA, centric phase encoding order is applied, and an optimization formulation seeks the optimal VFA design by balancing the three goals (low T1 bias, high SNR, and low blurring) described above:
$$\textbf{θ} = argmin(\sum\lambda_{1}\cdot\mid S_{i,fat}-S_{i,water}\mid^{2}-\sum\lambda_{2}\cdot(\mid S_{i,fat}\mid+\mid S_{i,water}\mid)^{2}+\sum\lambda_{3}\sum(\mid S_{i,fat\ or\ water}\mid-\frac{f_{i}}{mean(S_{i,fat\ or\ water})})^{2})$$
where $$$\theta_{i}$$$ is the flip angle at the $$$i_{th}$$$ TR and θ is a vector of $$$\theta_{i}$$$. The fat/water signals ( Si,fat/Si,water) are determined sequentially through Bloch equation simulation. Also, $$$f_{i}$$$ defines the desired k-space window function (leading to moderate smoothing; a Gaussian function in our implementation). The $$$\lambda_{1,2,3}$$$ parameters control the balance between T1 bias, SNR, and blurring, respectively.
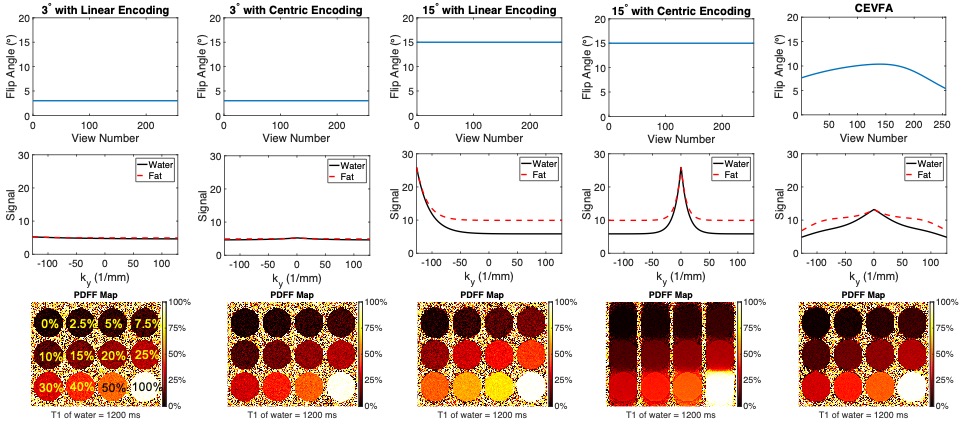
Given a fixed TR, assumed T1,water and T1,fat values, a fixed number of phase encoding lines, and the desired k-space windowing profile, the optimal VFA design is obtained by nonlinear minimization (MATLAB, MathWorks, Natick, MA). Numerical simulation results with five different FA designs (including CEVFA) are shown in Figure 1.
Phantom Study:
A phantom consisting of varying T1 of water and PDFF was constructed using varying concentrations of CuSO4, and varying concentrations of peanut oil in an agar-based emulsion8. Specifically, the phantom includes 4 sets of vials with $$$T_{1,water}\approx 1200ms, 1000ms, 650ms, and\ 300ms$$$ respectively. Each set contains 8 vials with varying PDFF (nominal PDFF = 0%, 5%, 10%, 20%, 30%, 40%, 50%, 60%).
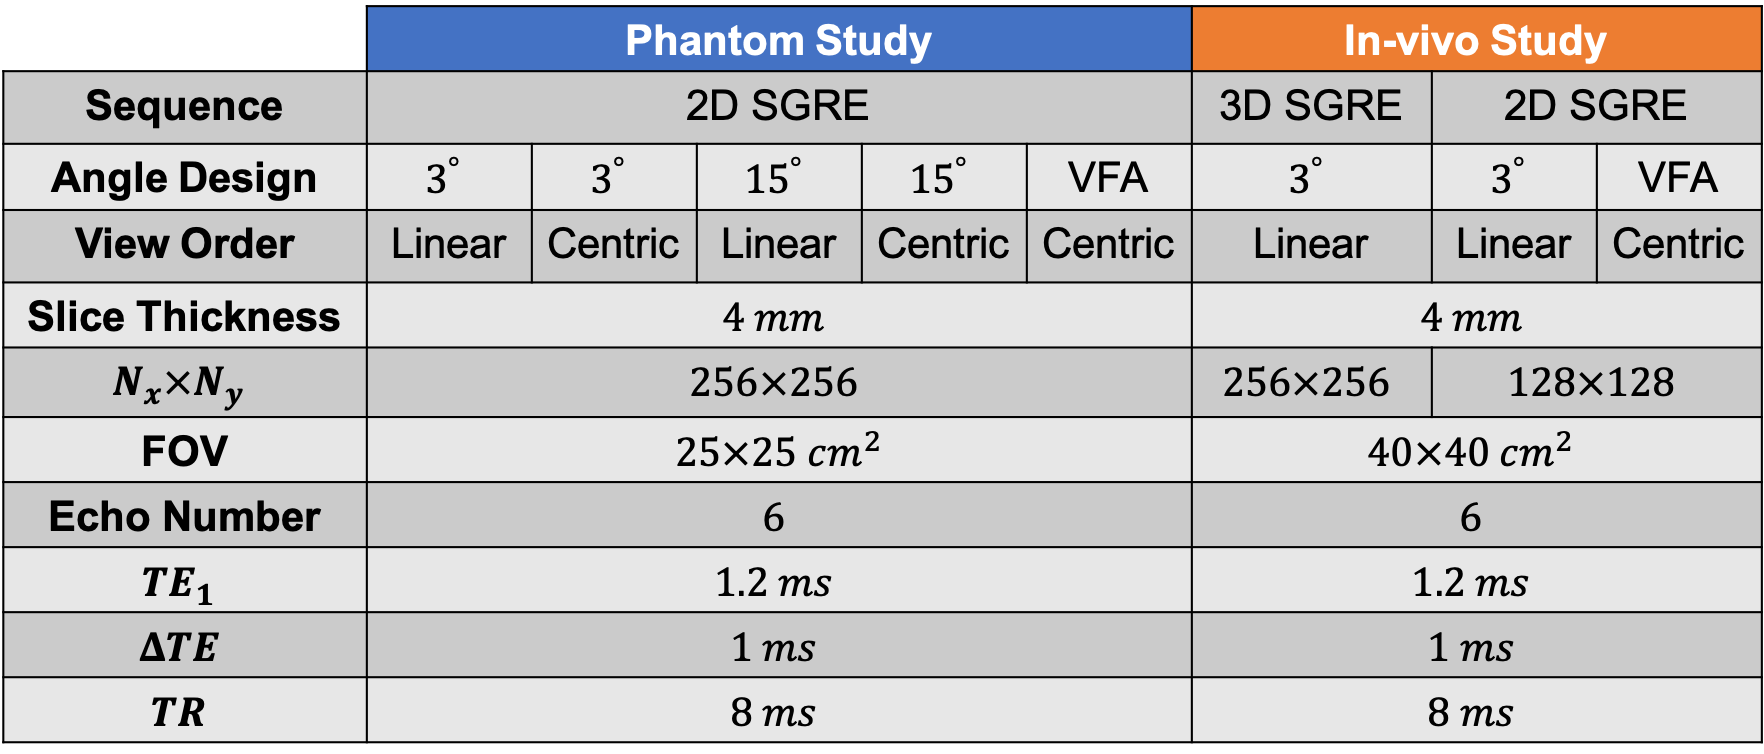
The phantom was scanned on a 3.0T MRI system (MR750, GE Healthcare, Waukesha, WI) using an 8-channel phased-array head coil. Multi-echo 2D CSE data were acquired for PDFF mapping. Five different CSE acquisitions were performed (see Table 1). For each acquisition, ten repetitions were performed in order to obtain pixel-by-pixel assessment of noise performance.
In-vivo Study:
With IRB approval and informed written consent, two volunteers were imaged on the same 3.0T system described above, using a 32-channel phased-array torso coil. Two different multi-echo 2D CSE acquisitions and a standard breath-hold 3D CSE acquisition were performed for PDFF mapping (see Table 1).
Reconstruction and Analysis:
The source CSE-MRI data were processed using a complex-fitting, fat-corrected PDFF quantification algorithm9 implemented in MATLAB (MathWorks, Natick, MA).
From the phantom data, pixel-wise mean and standard deviation of PDFF were calculated from the 10 repeated acquisitions. A region of interest (ROI) was placed in the center of each vial to measure overall mean PDFF value and standard deviation. The reference PDFF value for each vial was obtained from the constant low flip angle-based PDFF, corrected for the vial-specific T1.
Results:
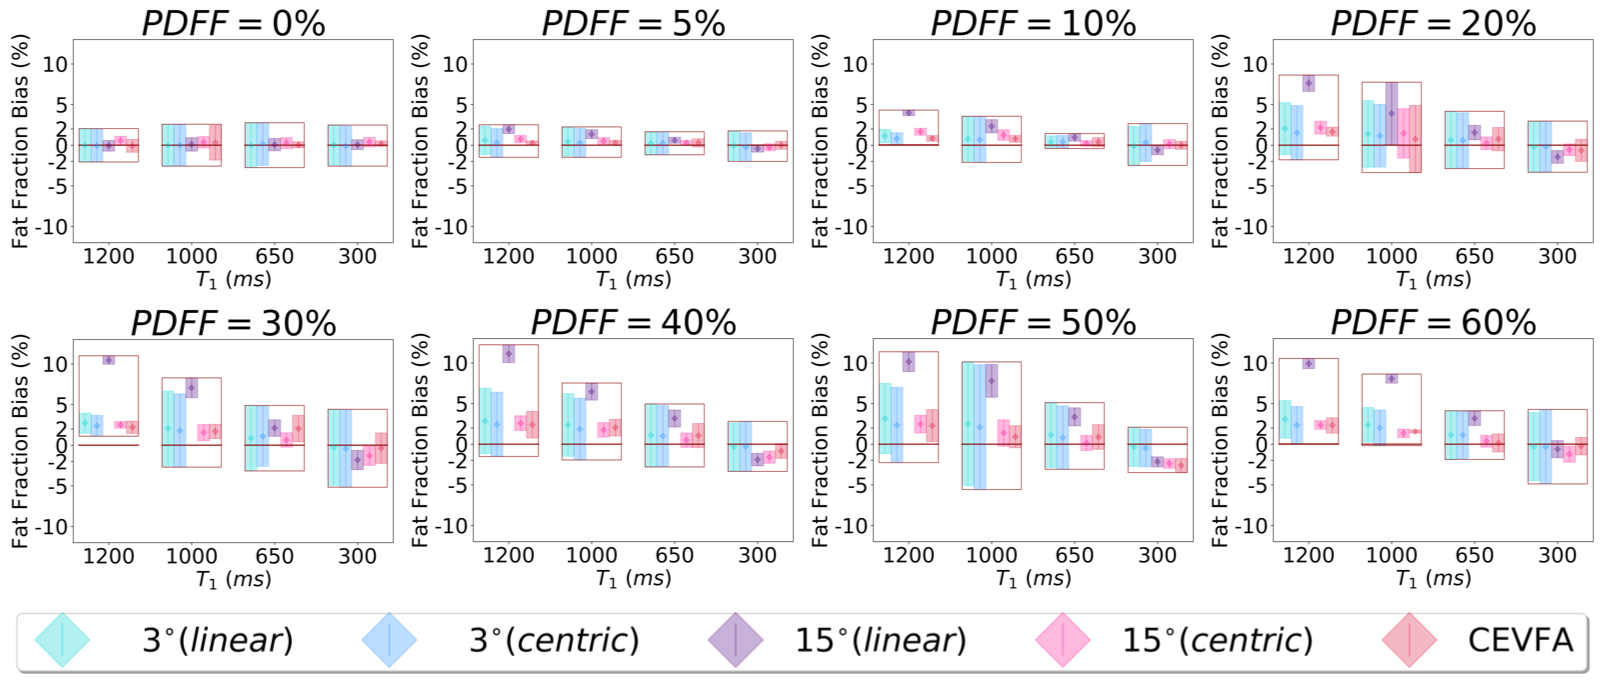
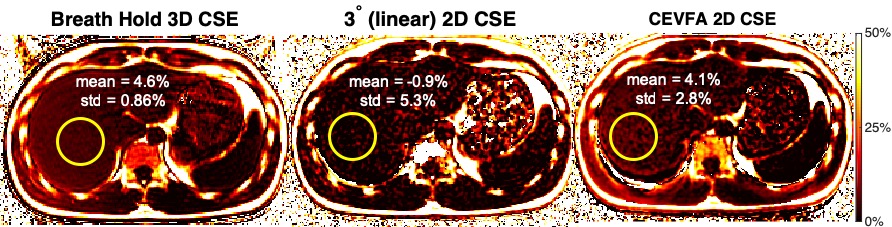
From the comparison between four various T1,water sets of vials at each PDFF in Figure 2, CEVFA method was observed to minimize T1 bias (closest to T1-corrected reference PDFF value) and maximize SNR (smallest standard deviation). As shown in Figure 3 for one representative volunteer slice, CEVFA PDFF showed similar average PDFF compared to the reference low flip angle approach (PDFF = 4.1% vs 4.6%) but with higher SNR (standard deviation: 2.8% vs 5.3%), in agreement with simulations and phantom results.Discussion:
In this work, we have developed a novel CEVFA fat quantification technique that overcomes the limitations of current 2D CSE-MRI techniques. CEVFA is able to optimally balance low T1 bias, high SNR, and low blurring, as demonstrated in phantoms and in-vivo. On-going studies will be required to fully validate this technique in patients. Upon further validation, this technique may enable reliable abdominal fat quantification without the need for breath-holds or triggering.Acknowledgements
The authors wish to acknowledge support from the NIH (grants UL1-TR000427, R41-EB025729, R01-DK117354, R01-DK100651, K24-DK102595, R01-DK083380, and R01-DK088925). Additionally, the authors acknowledge GE Healthcare who provides research support to the University of Wisconsin-Madison.References
1. Rehm JL, Wolfgram PM, Hernando D, Eickhoff JC, Allen DB, Reeder SB. Proton density fat-fraction is an accurate biomarker of hepatic steatosis in adolescent girls and young women. European radiology. 2015;25(10):2921-30.
2. Meisamy S, Hines CD, Hamilton G, Sirlin CB, McKenzie CA, Yu H, et al. Quantification of hepatic steatosis with T1-independent, T2-corrected MR imaging with spectral modeling of fat: blinded comparison with MR spectroscopy. Radiology. 2011;258(3):767-75.
3. Hines CD, Frydrychowicz A, Hamilton G, Tudorascu DL, Vigen KK, Yu H, et al. T(1) independent, T(2) (*) corrected chemical shift based fat-water separation with multi-peak fat spectral modeling is an accurate and precise measure of hepatic steatosis. Journal of magnetic resonance imaging: JMRI. 2011;33(4):873-81.
4. Yokoo T, Bydder M, Hamilton G, Middleton MS, Gamst AC, Wolfson T, et al. Nonalcoholic fatty liver disease: diagnostic and fat-grading accuracy of low-flip-angle multiecho gradient-recalled-echo MR imaging at 1.5 T. Radiology. 2009;251(1):67-76.
5. Yokoo T, Shiehmorteza M, Hamilton G, Wolfson T, Schroeder ME, Middleton MS, et al. Estimation of hepatic proton-density fat fraction by using MR imaging at 3.0 T. Radiology. 2011;258(3):749-59.
6. Ruby J, Hernando D, Campo C, Shimakawa A, Vigen K, Holmes J, et al. Motion insensitive quantification of liver proton density fat-fraction using a single-shot 2D technique. Proceedings of the 24th Annual Meeting of ISMRM; Singapore2016.
7. Luo H, Wiens C, Campo C, Shimakawa A, Reeder S, Johnson K, et al. A novel fat and iron quantification technique with non-rigid motion-corrected averaging based on non-local means. Proceedings of the 25th Annual Meeting of ISMRM; Honolulu, HI2017.
8. Hernando D, Sharma SD, Aliyari Ghasabeh M, Alvis BD, Arora SS, Hamilton G, et al. Multisite, multivendor validation of the accuracy and reproducibility of proton-density fat-fraction quantification at 1.5T and 3T using a fat-water phantom. Magnetic resonance in medicine: official journal of the Society of Magnetic Resonance in Medicine / Society of Magnetic Resonance in Medicine. 2016.
9. Hernando D, Kellman P, Haldar JP, Liang ZP. Robust water/fat separation in the presence of large field inhomogeneities using a graph cut algorithm. Magnetic resonance in medicine: official journal of the Society of Magnetic Resonance in Medicine / Society of Magnetic Resonance in Medicine. 2010;63(1):79-90.
Figures