1154
Rapid and Accurate CEST and NOE MRI of Injured Spinal Cord Using Multi-Pool Fitting1Vanderbilt University Institute of Imaging Science, Vanderbilt University Medical Center, Nashville, TN, United States, 2Department of Radiology and Radiological Sciences, Vanderbilt University Medical Center, Nashville, TN, United States, 3Department of Biomedical Engineering, Vanderbilt University, Nashville, TN, United States
Synopsis
This study aims to evaluate the accuracy of estimates of the amplitudes of specific CEST and NOE effects in Z-spectra derived from multi-pool fitting using down sampled data, and their sensitivity for assessing injury-associated changes in spinal cords of squirrel monkeys. An inverse subtraction analysis corrected for changes in the apparent water longitudinal relaxation rate R1obs (AREXmfit) was used to quantify regional spectra around lesion sites. The results provide an optimized rapid, sensitive, and accurate protocol for deriving both NOE and CEST effects in spinal cord imaging at high field.
Purpose
Chemical exchange saturation transfer (CEST) and relayed nuclear Overhauser enhancement (NOE) effects in Z-spectra provide information on metabolites, mobile proteins and membrane lipids that may characterize spinal cords after injury. Accurate and specific quantifications of CEST and NOE signals are important for practical applications1 but complete, high resolution Z-spectra require multiple acquisitions. Multi-pool fitting of the various resonances can separate different CEST and NOE effects from direct water saturation (DS) and semi-solid MT effects. It is also critical to reduce effects of R1 variations to CEST and NOE measurements. This study aims to evaluate the accuracy and sensitivity of multi-pool fitting from a reduced set of measurements obtained by down sampling the number of RF offsets used for CEST imaging of injured spinal cord, and to assess injury-associated spatiotemporal changes in CEST and NOE measures in cervical spinal cords of non-human primates (NHP).Methods
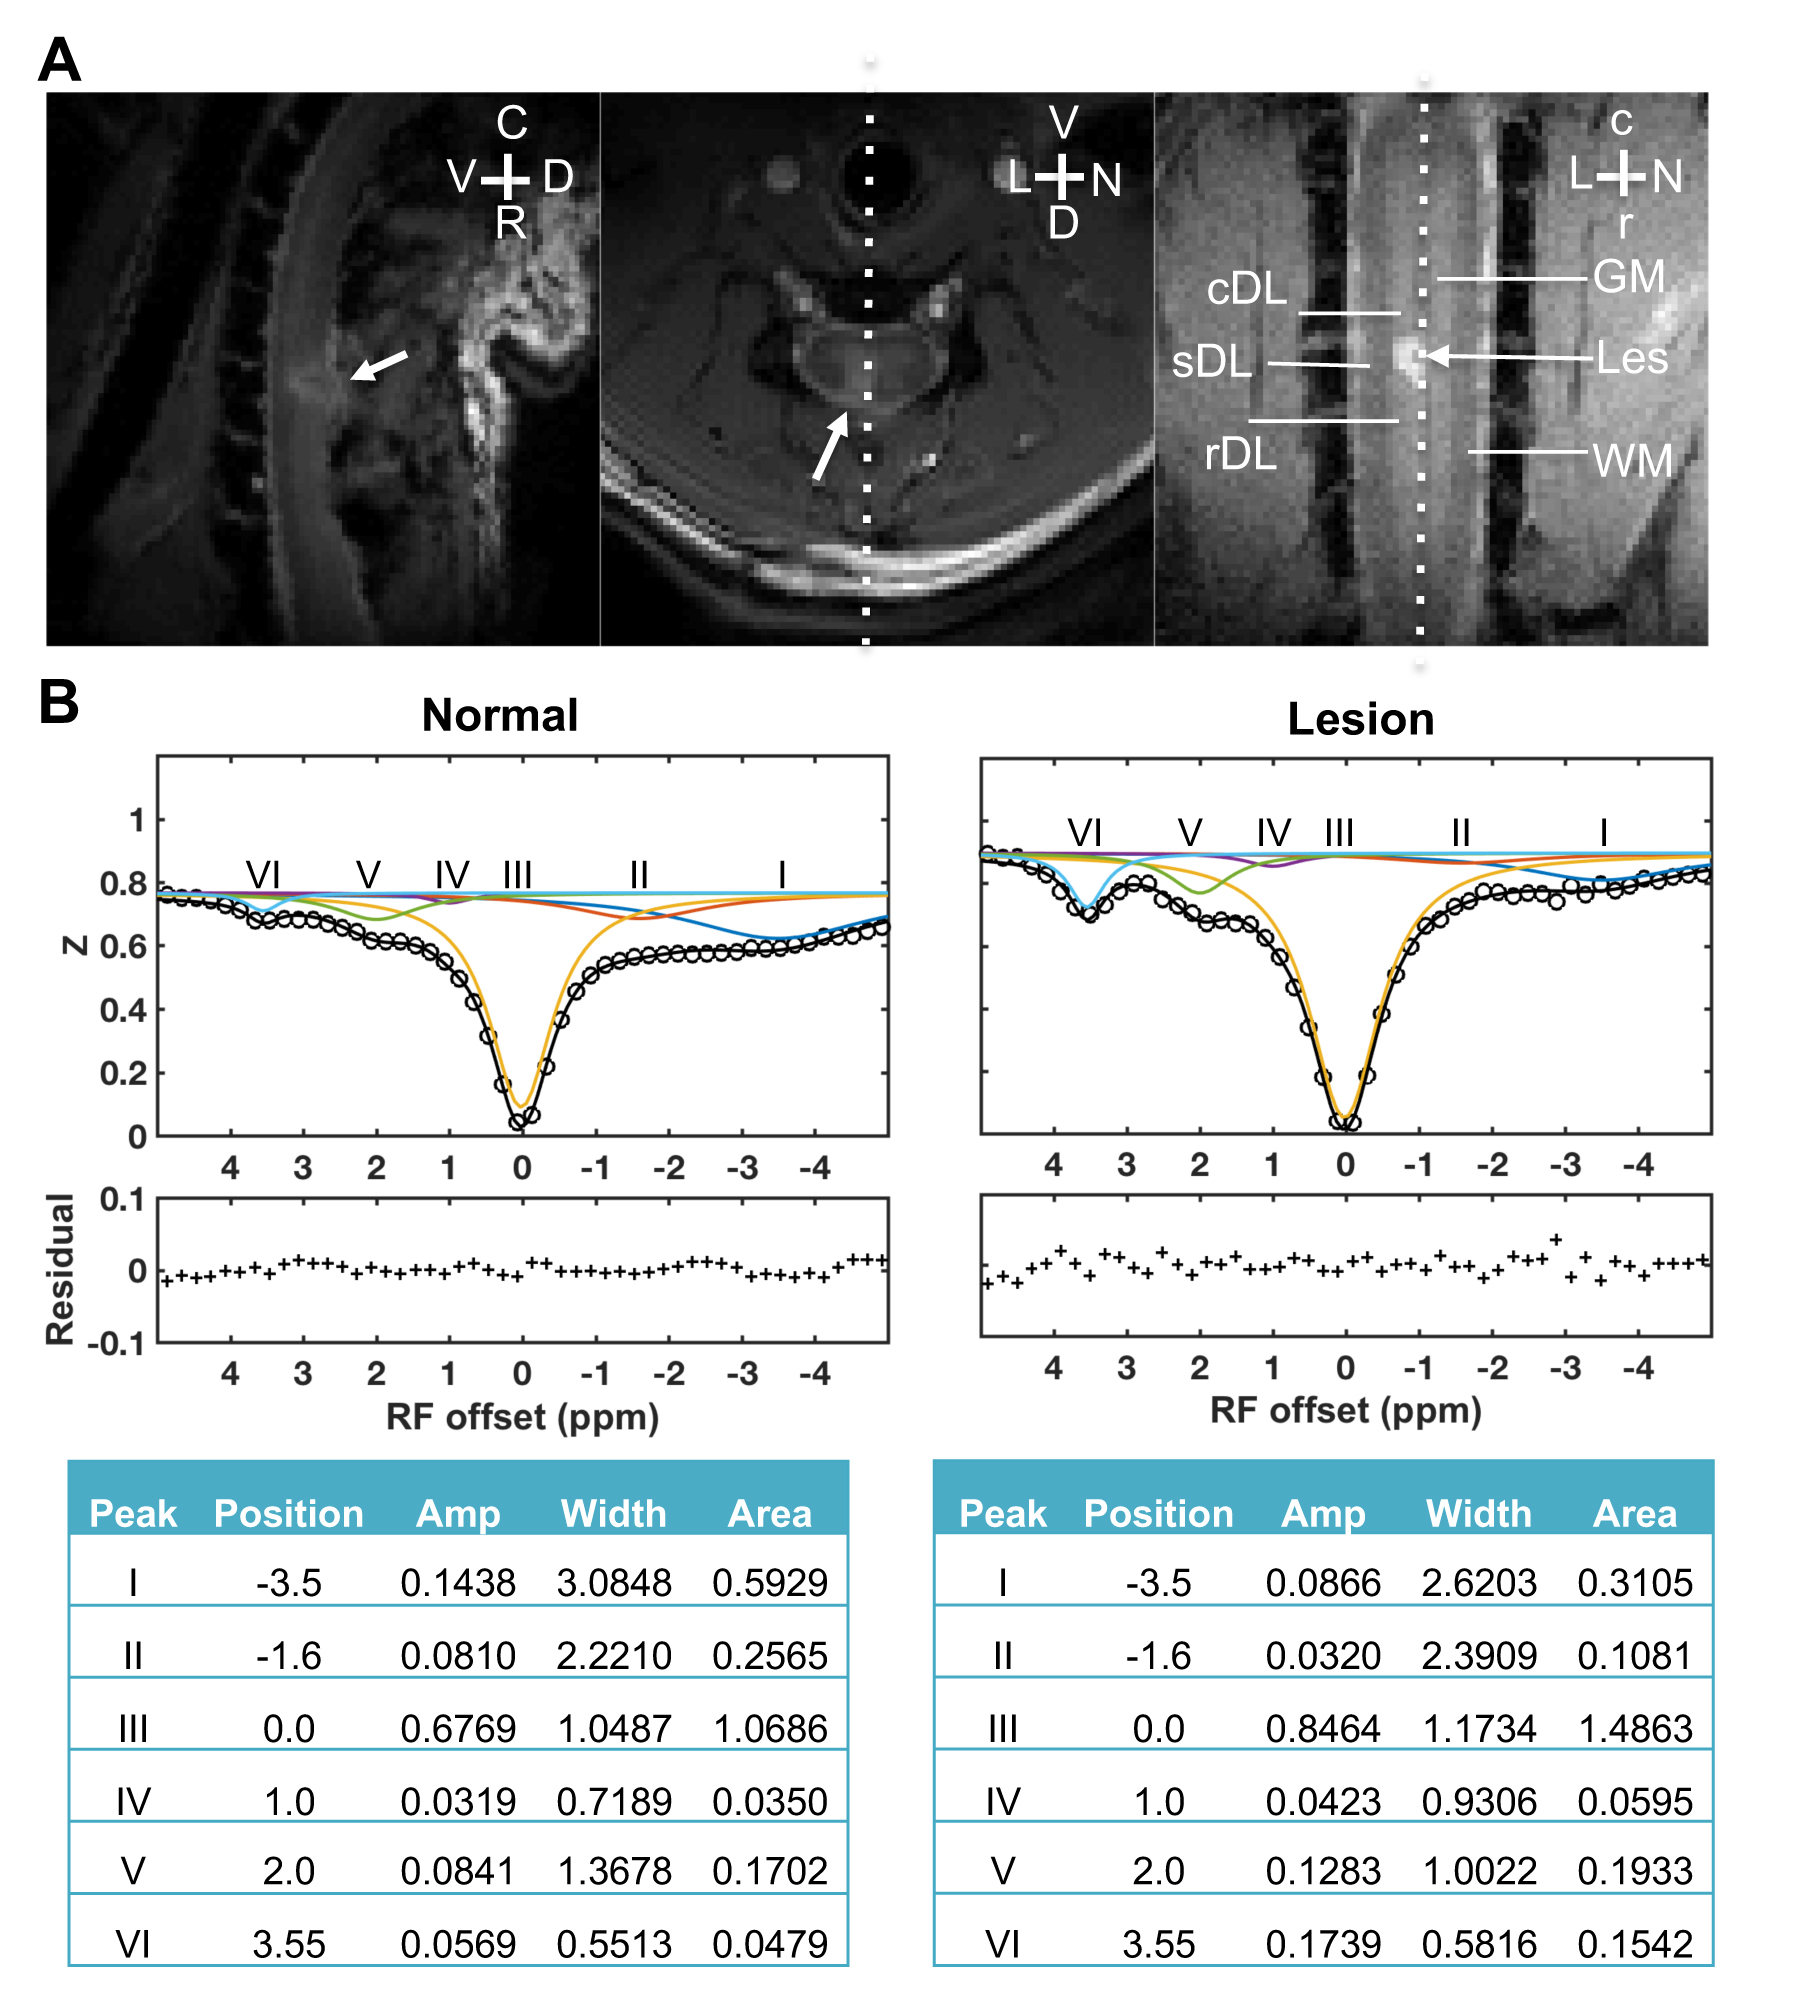
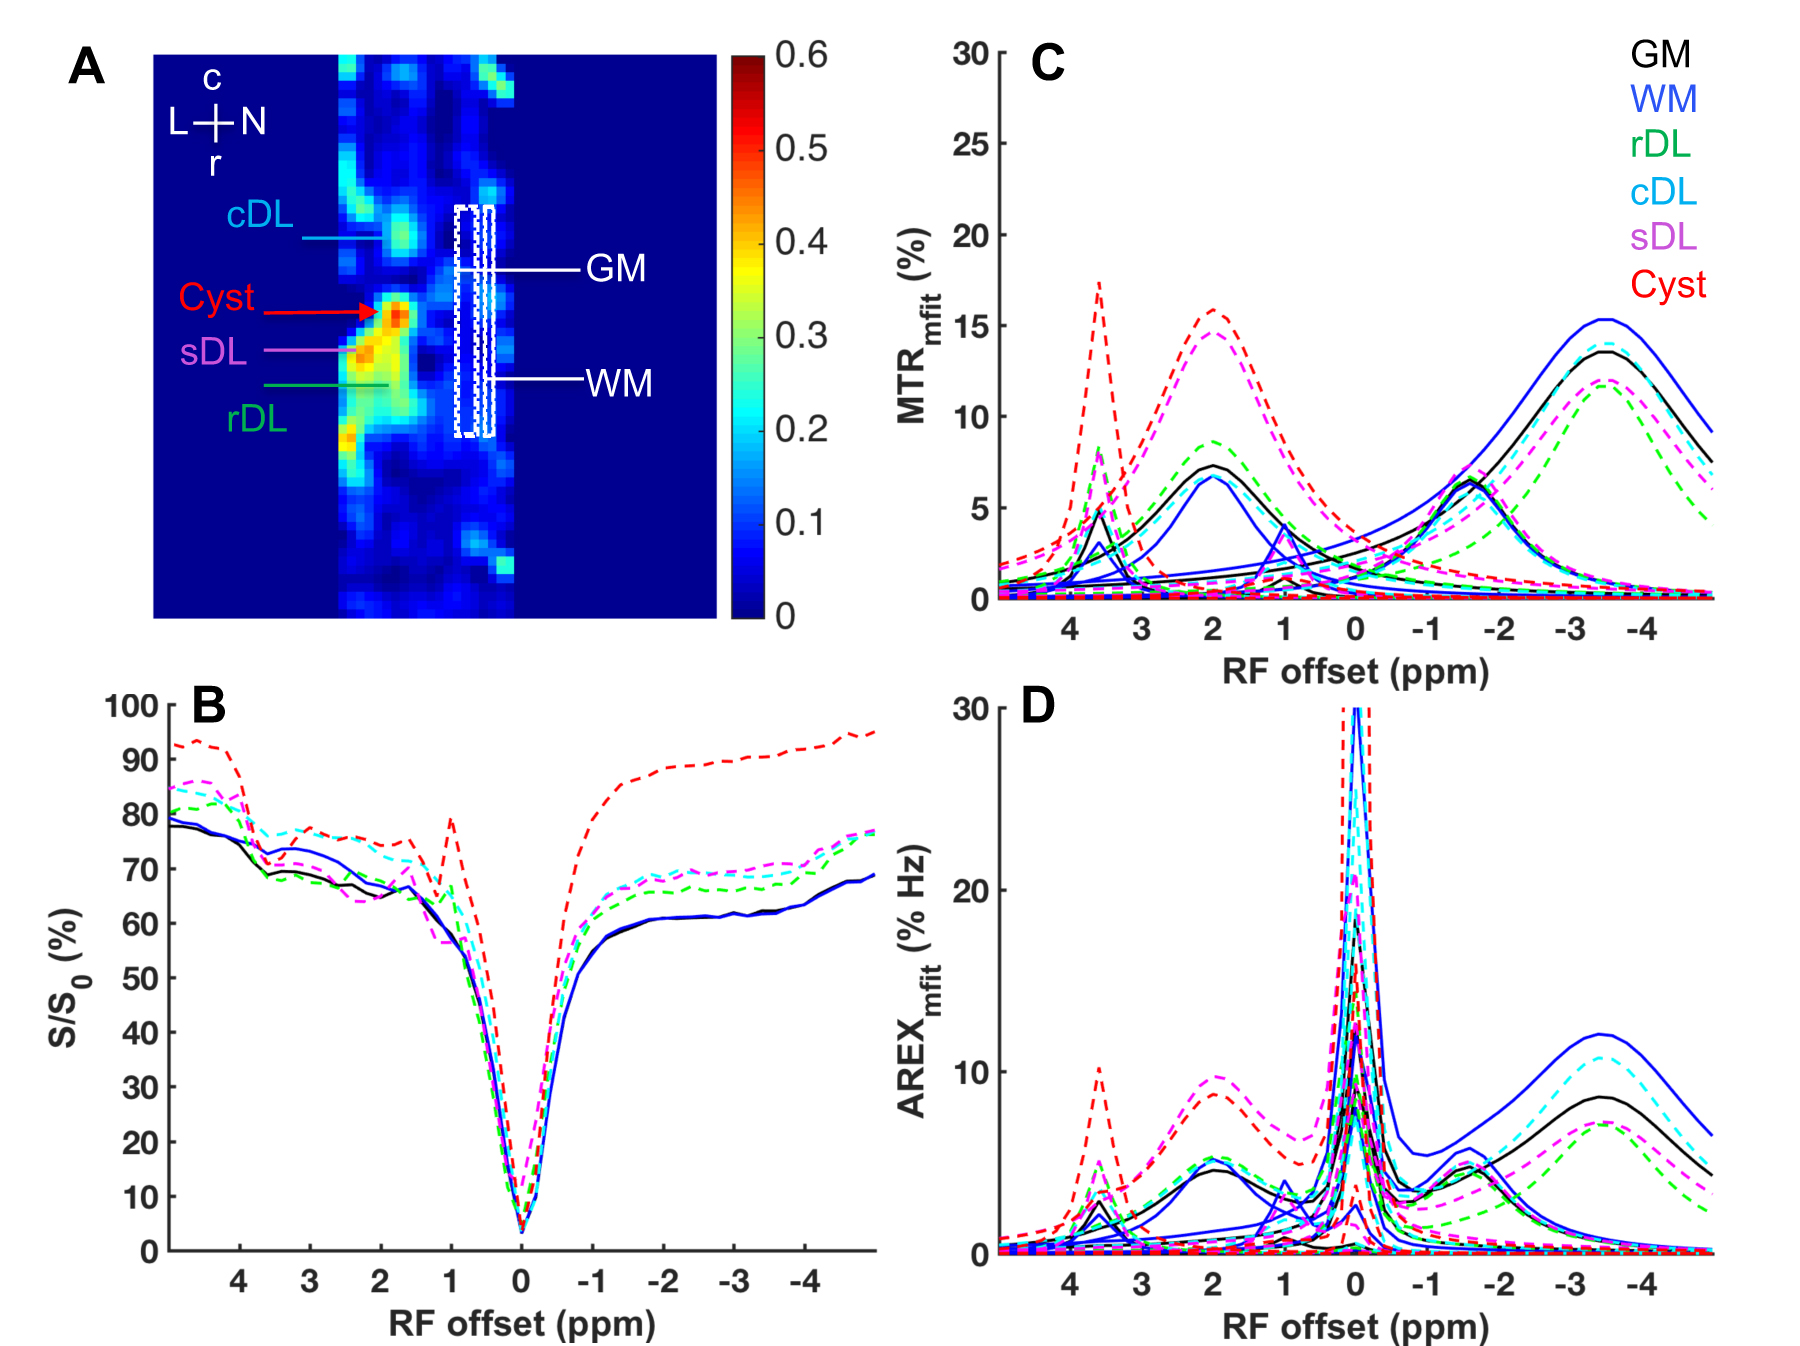
MRI scans were recorded of anesthetized squirrel monkeys (N = 9) at 9.4T, before and after a unilateral dorsal column sectioning (~2 mm) of the cervical spinal cord (Fig. 1A). CEST images were acquired using a 5s continuous wave (CW) saturation of amplitude 1.0 μT (51 RF offsets equally spaced from -5 ppm to 5 ppm) followed by a spin-echo echo-planar-imaging acquisition (TR/TE = 7500/18 ms, 2 shots, resolution = 0.5x0.5 mm2, slice thickness = 1 mm). The amplitudes of CEST and NOE effects from multiple proton pools were quantified using a six-pool Lorenzian fitting of each Z-spectrum2. The down-sampled data with different reduced selections of RF offsets were analyzed and compared. The correlation between results derived from down-sampled data (about 1/2 and 1/3 reductions) and data with all 51 RF offsets (P51e) for each specific CEST and NOE effect was evaluated using linear regression, with the assumption that fitting results based on all sampling data with 51 RF offsets provide the best results. The inverse subtraction analysis with correction of apparent water longitudinal relaxation rates R1obs (AREXmfit) and multi-pool MTRmfit were calculated for comparison1. The significance of differences in regional pool amplitudes was evaluated using Student’s t-tests.Results
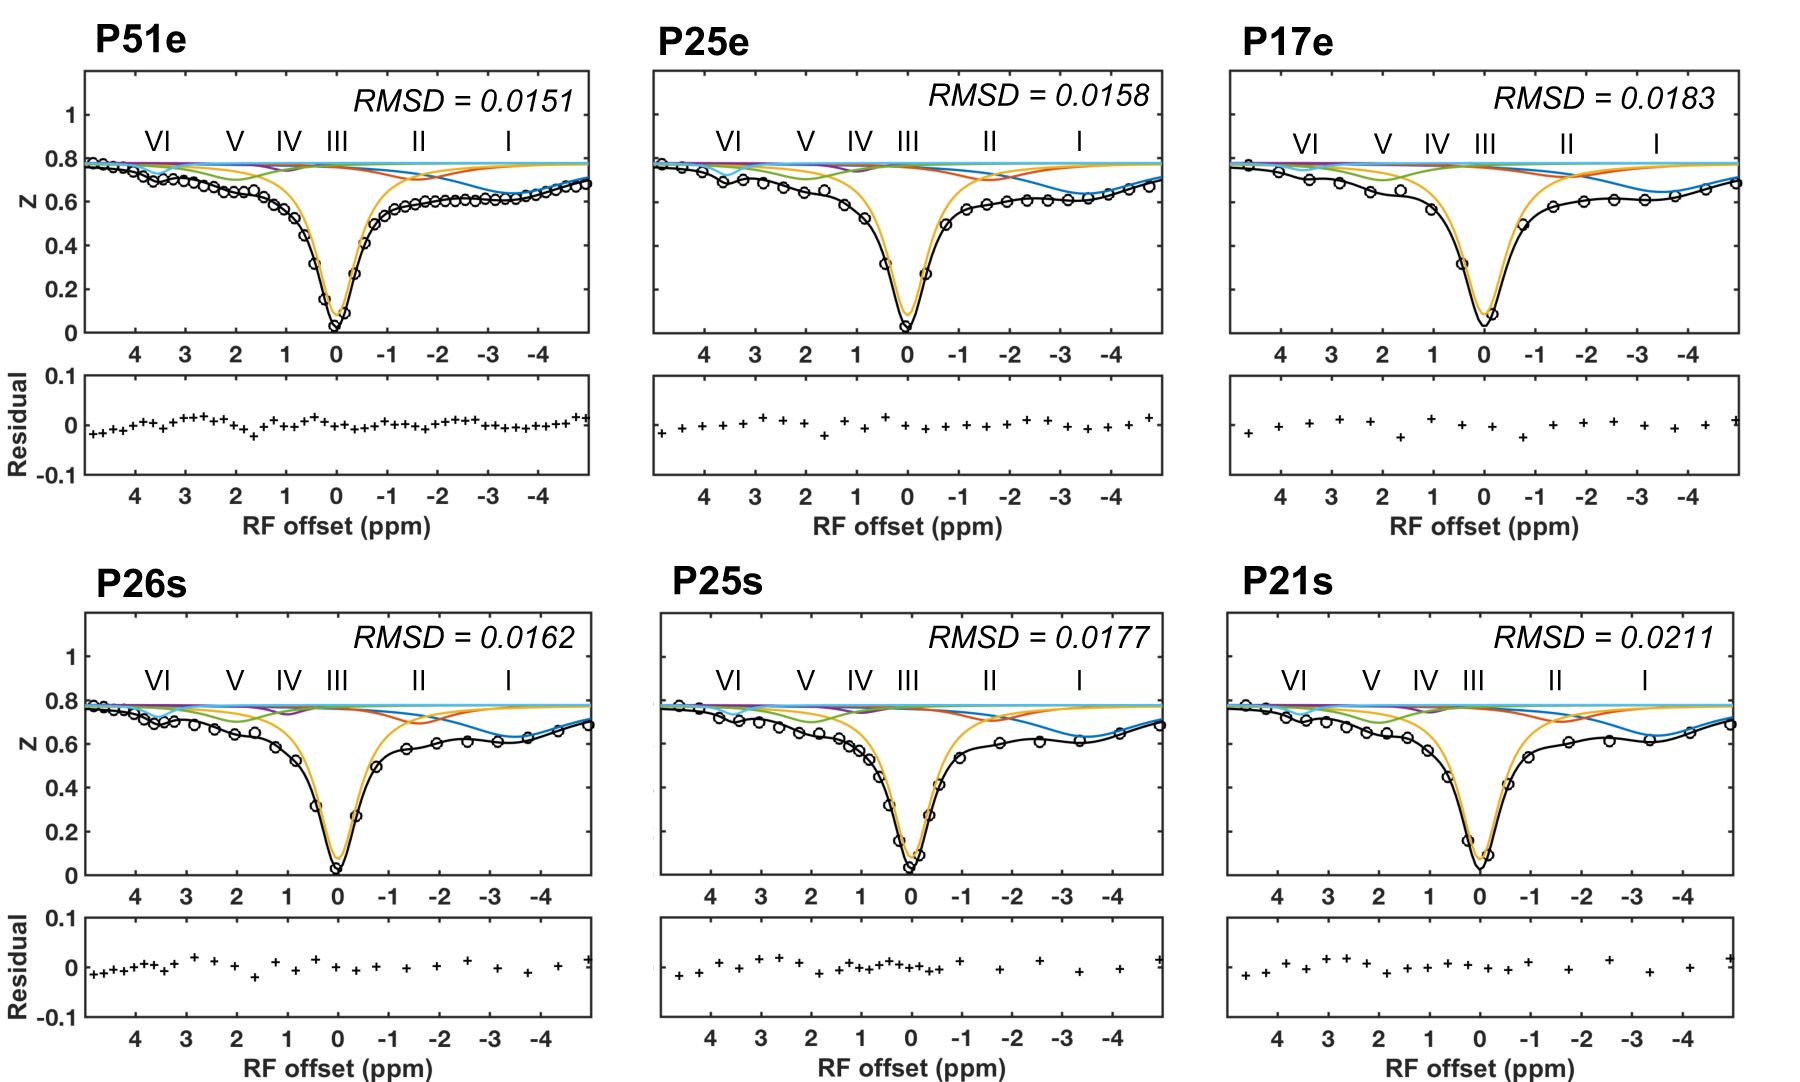
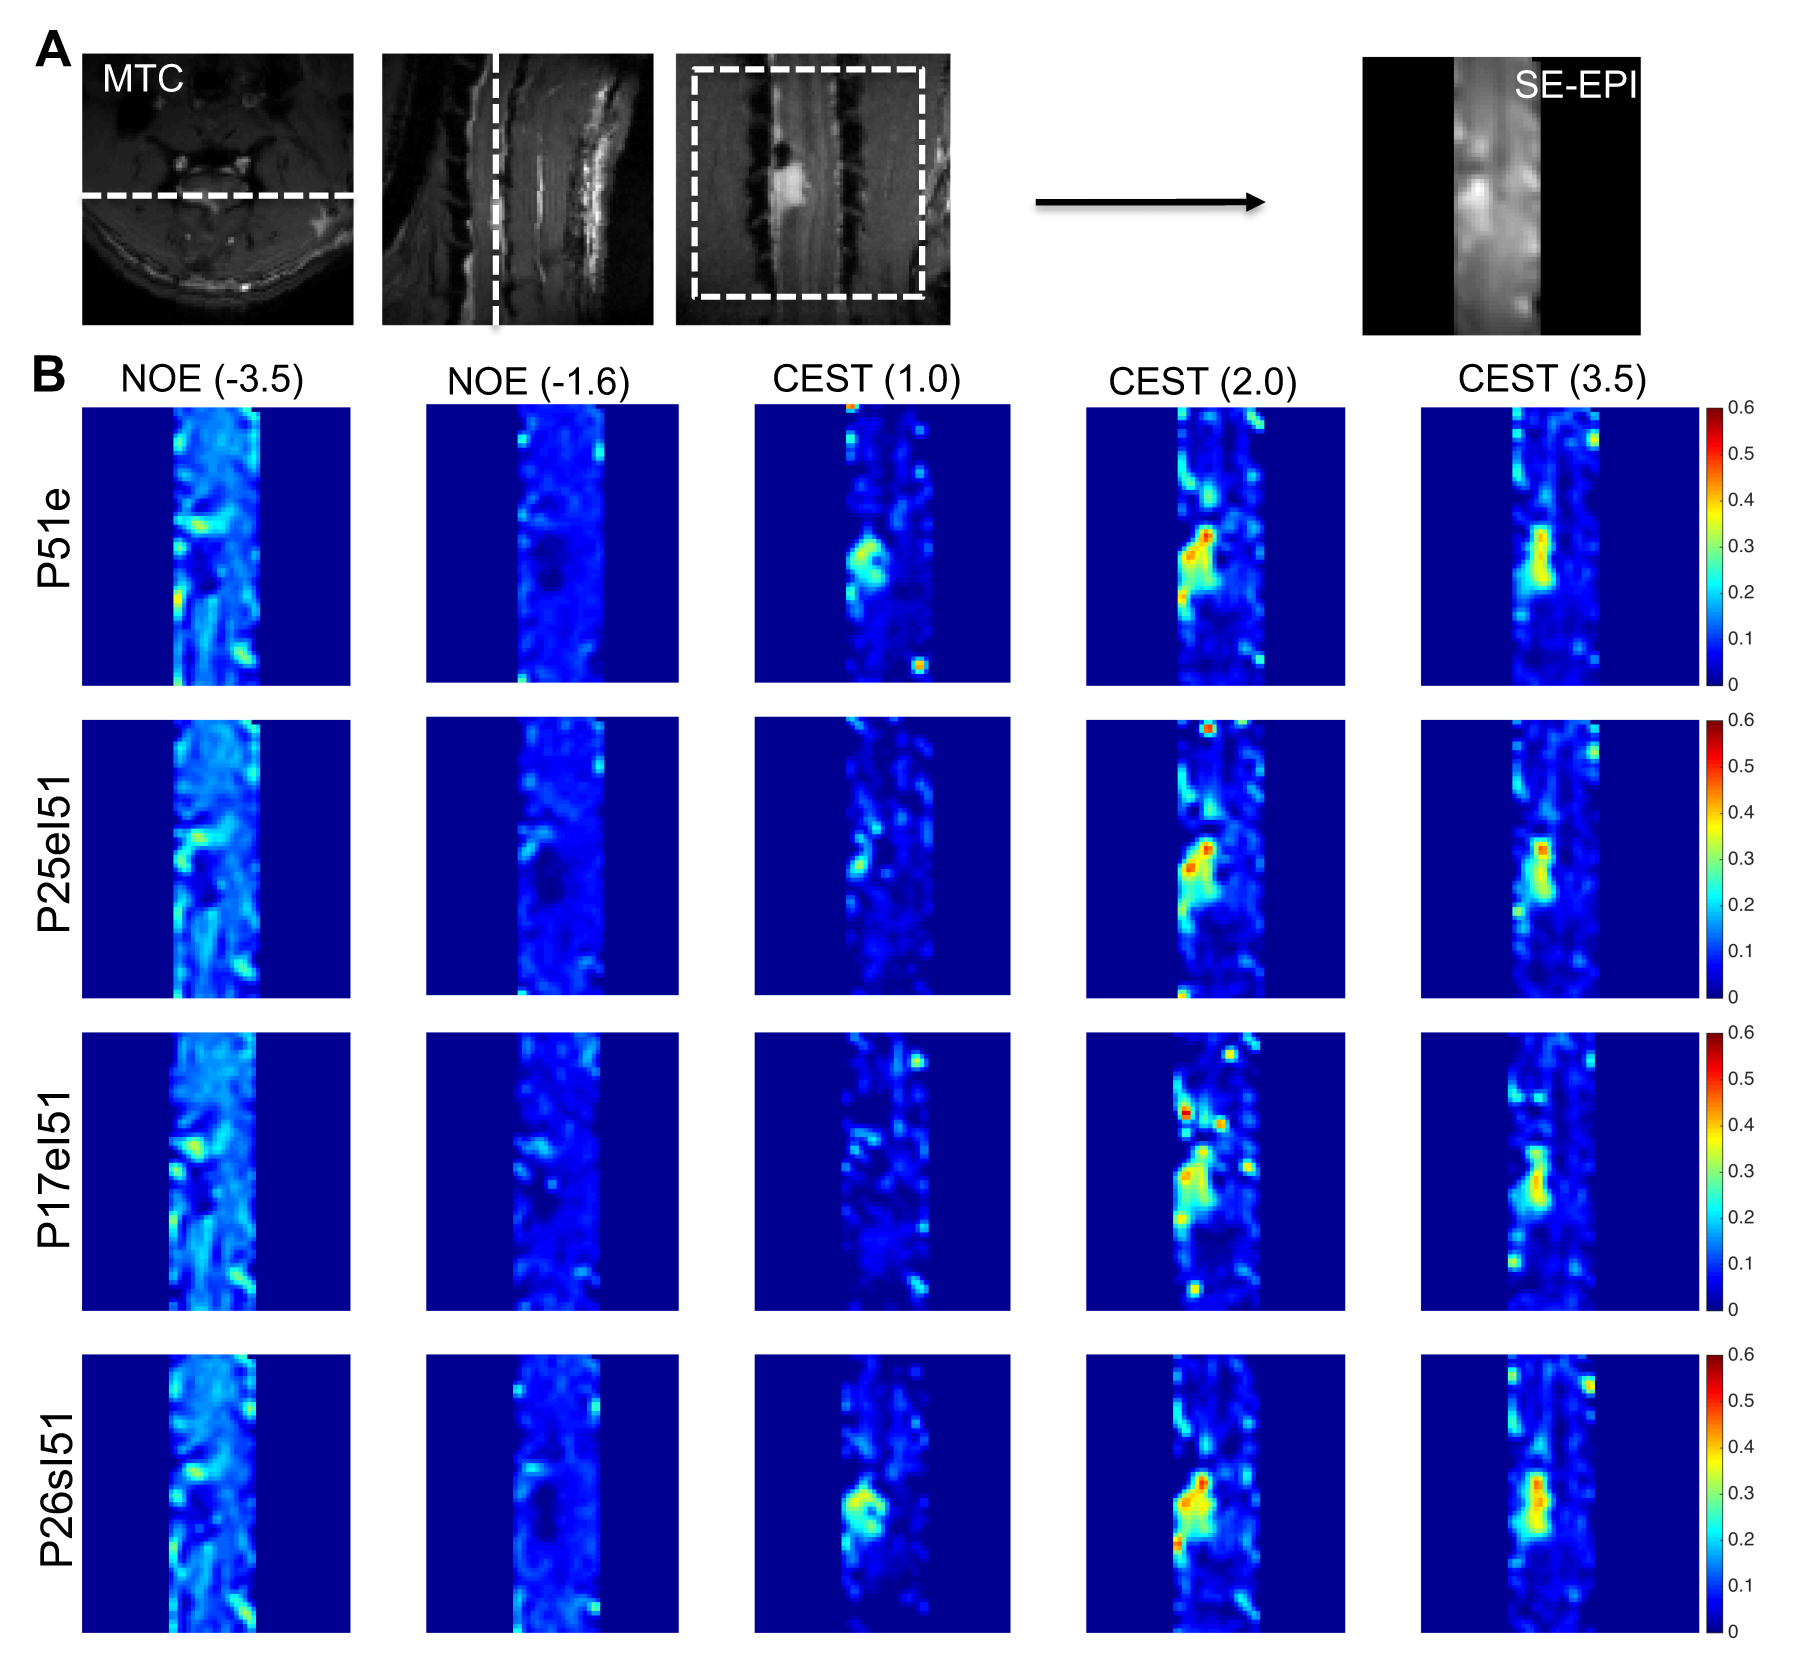
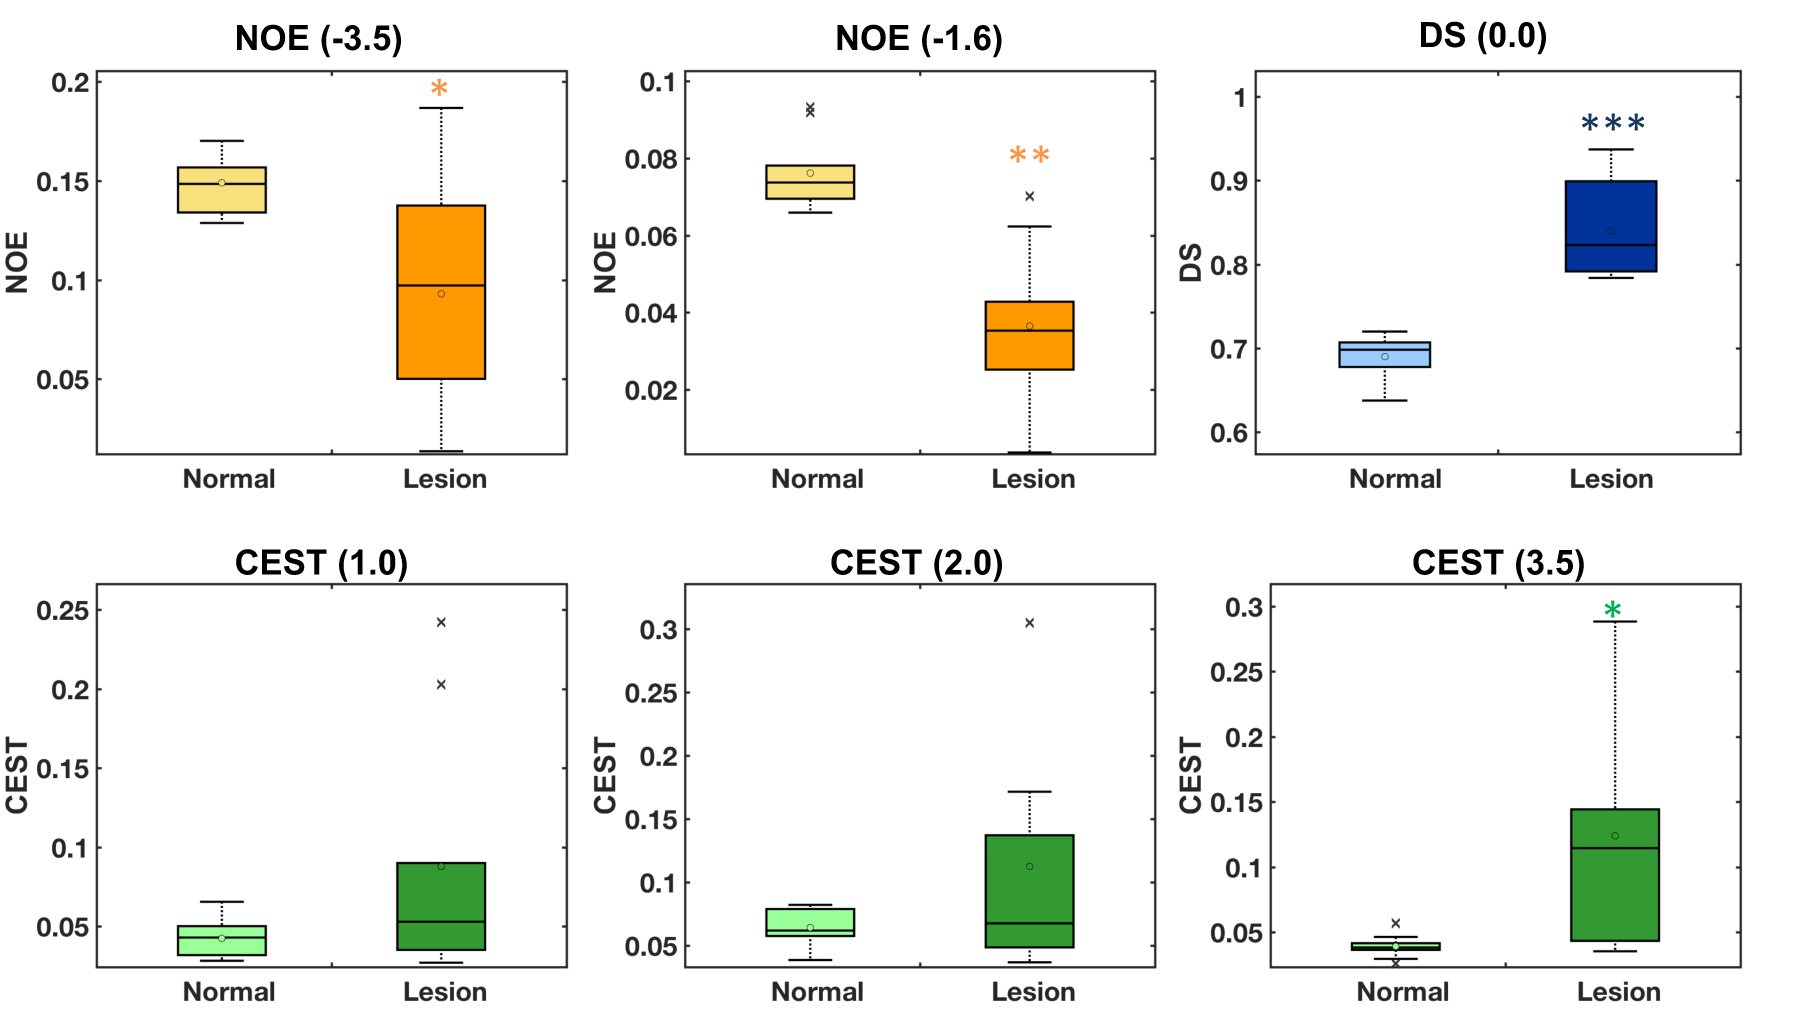
Figure 1B shows representative fitting results for normal and abnormal tissues with complete sampling data (P51e) delineating the peak amplitude and width of each CEST or NOE resonance in cervical spinal cord of NHP after injury. The peak amplitude and width can be used to guide the selection of sampling rate in each RF offset domain of the six pools for down sampling. The influences of number of RF offsets and gaps in different RF offset domains on fitting and mapping were evaluated, and the twofold reduction in number of RF offsets (P25e and P26s) yielded comparable accuracy with P51e (Fig. 2). Appropriate interpolation improved the accuracy of the modeling results. All the maps from multi-pool fitting detected unilateral changes at the site of injury, especially in the dorsal pathway and dorsal horns on the side of injury for this particular subject (Fig. 3). Significant decreases in NOE(-3.5) and NOE(-1.6) and increases in CEST(1.0), CEST(2.0), and CEST(3.5) were detected at the lesion site (Fig. 3). The map derived from twofold down-sampled data P26sI51 showed quite similar spatial distribution as that obtained using P51e at each RF offset (Fig. 3). The results from P26sI51 of 9 subjects were highly correlated to those using P51e. Across 9 subjects, although both CEST(2.0) and CEST(1.0) increased at the lesion site, they were not as significant as CEST(3.5), compared to relative measures of the tissues on the non-lesion side after the spinal cord injury (Fig. 4). Representative R1-corrected AREXmfit of cyst regions also showed significant increases at 3.5 and 2.0 ppm and decreases at -1.6 and -3.5 ppm (Fig. 5). Some abnormal tissues around the lesion site also exhibited significant changes in AREXmfit, especially at 3.5 and -3.5 ppm RF offsets. Spatiotemporal variations in the measurements across individual subjects are still under investigation.Conclusion
These results support the selection of RF offsets and down sampling in CEST imaging of injured spinal cord as a means to reduce total imaging time and/or permit additional signal averaging. AREXmfit provides multiple specific effects without R1 contamination. The current approach allows a fast (~13 mins) and robust approach to characterize the tissue property changes caused by injury at 9.4T.Acknowledgements
We thank Mrs. Chaohui Tang and Mr. Fuxue Xin of the Vanderbilt University Institute of Imaging Science for their assistance in animal preparation and care in MRI data collection. This study is supported by DOD grant W81XWH-17-1-0304, and NIH grants NS092961 and NS078680.References
1. Zhang XY, Wang F, Li H, et al. Accuracy in the quantification of chemical exchange saturation transfer (CEST) and relayed nuclear Overhauser enhancement (rNOE) saturation transfer effects. NMR Biomed. 2017;30.
2. Wang F, Zu ZL, Wu RQ, Wu TL, Gore JC, Chen LM. MRI evaluation of regional and longitudinal changes in Z-spectra of injured spinal cord of monkeys. Magn Reson Med. 2018;79:1070-1082.
Figures