1149
Learning-induced microstructural changes in specific layers of primary motor cortex revealed by diffusion kurtosis tensor imaging1Champalimaud Neuroscience Programme, Champalimaud Centre for the Unknown, Lisbon, Portugal, 2Johns Hopkins University, Baltimore, MD, United States
Synopsis
Motor skill acquisition is known to induce microstructural changes in the motor cortex grey matter, which yield the encoding of new motor memories. Whether such alterations can be measured with diffusion magnetic resonance imaging (dMRI) is still an open question. Here, diffusion kurtosis tensor imaging is used to detect specific layer changes ex-vivo in mice after learning a new lateralized motor prehension task. Mean Kurtosis (MK) was found to increase with learning in M1 layers 5b and 6. Such changes were not observed in non-task-related regions. Moreover, single subject MK distributions appear to correspond with behaviour performance.
Introduction
Motor skill acquisition reorganizes cortical motor maps1,2 and is accompanied by microstructural remodelling such as synaptogenesis and dendritic branching2–4. In rodents, learning a lateralized motor task modulates these features in primary motor cortex (M1) contralateral to the trained paw3,4. Given that motor control involves broadly distributed networks5–7, MRI arises as an appealing tool to study brainwide plasticity. Microstructural changes upon motor learning were revealed by diffusion MRI (dMRI) in humans8,9 and rodents10 in white matter. Here, we trained mice on a motor prehension task, and using diffusion kurtosis imaging (DKI)11, we report layer-specific alterations in M1 consistent with previous histological metrics underpinning cortical representation map modulations12,13. Our findings suggest a role for dMRI in mapping and understanding motor task-related plasticity.Methods
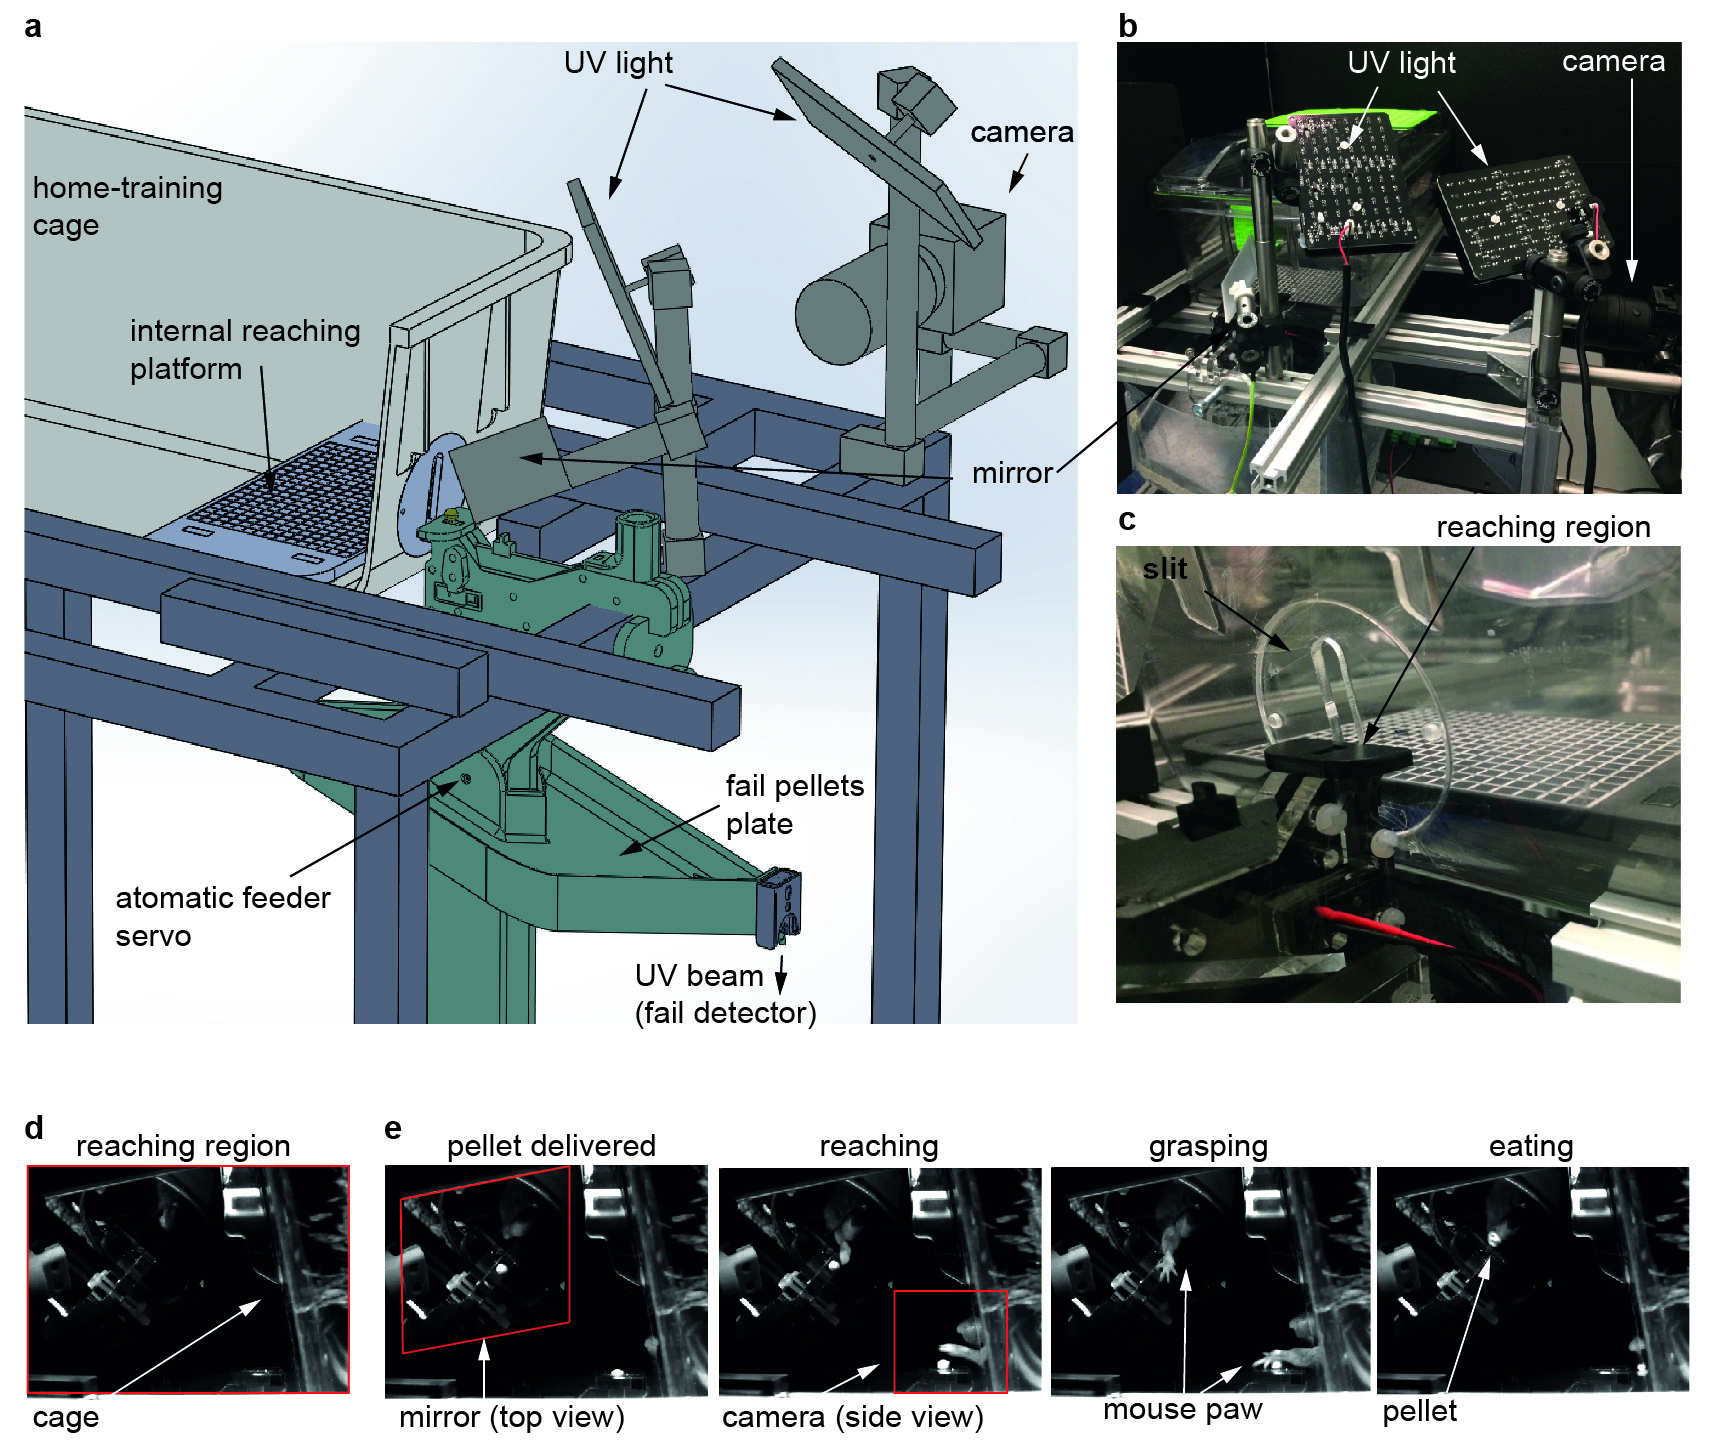
Task and sample preparation. All animal experiments were preapproved by the institutional and national authorities and were carried out according to European Directive 2010/63. Male C57BL/6 mice (N=3) were trained to perform a previously described reaching task14,15. Paw-preference discrimination14,15 preceded training. Animals were trained over 7 days (one session/day) in a home-built automatic setup (Fig. 1). After the last session, the brains were extracted via standard transcardial perfusion, kept in 4% PFA (2-3 days) and then transferred to PBS (8-10 days). Before scanning, brains were placed in a 10 mm NMR tube filled with Fluorinert (Sigma Aldrich, Portugal).
MRI experiments. A 16.4 T Bruker Aeon scanner equipped with a 10 mm micro5 probe and gradients capable of producing up to 3000 mT/m (isotropic) was used. Diffusion data were acquired with a remmiRARE sequence (kindly provided by Prof. Mark Does), RARE factor=8, first TE=29 ms (echo spacing=5.25 ms), TR=4200 ms, resolution=(61x61x275) mm3 (55 slices). Five b-values=600, 1200, 1800, 2400 and 3000 s/mm2 were acquired at random order, each with 30 different directions, Δ/δ=22/2 ms. Two b=0 images were acquired per b-value to account for potential scanner drifts. Raw data was denoised16 and Gibbs unrung17. The kurtosis tensor was estimated voxel-by-voxel via weighted linear least squares fit18,19. Five regions-of-interest (ROIs) delineating M1, layers 2/3, 5a, 5b, and 6 were drawn in each hemisphere of four M1-containing slices. Contralateral hemispheres (to the learned paw) were grouped and compared to ipsilateral hemispheres. Parametric distributions were non-normal, thus statistical analyses were conducted using a Mann-Whitney U test. A similar analysis was performed in bilateral visual cortex ROIs.
Results
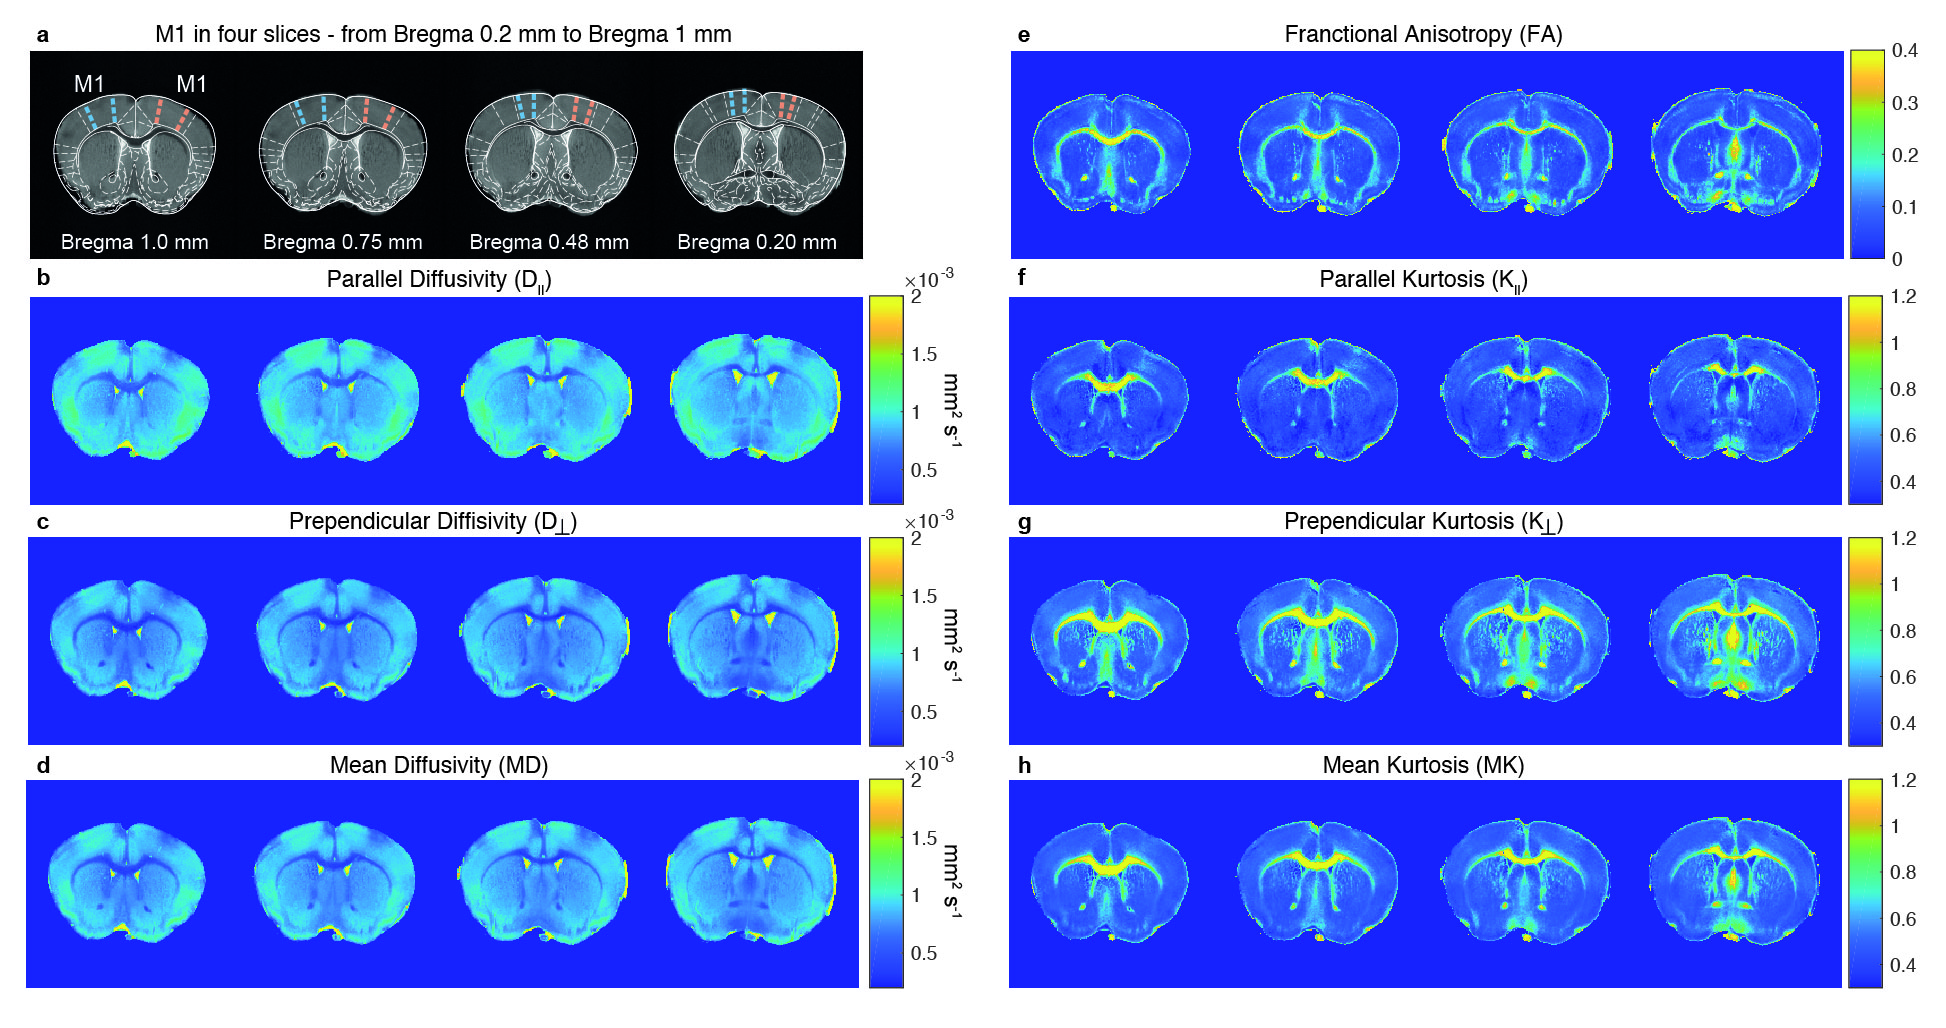
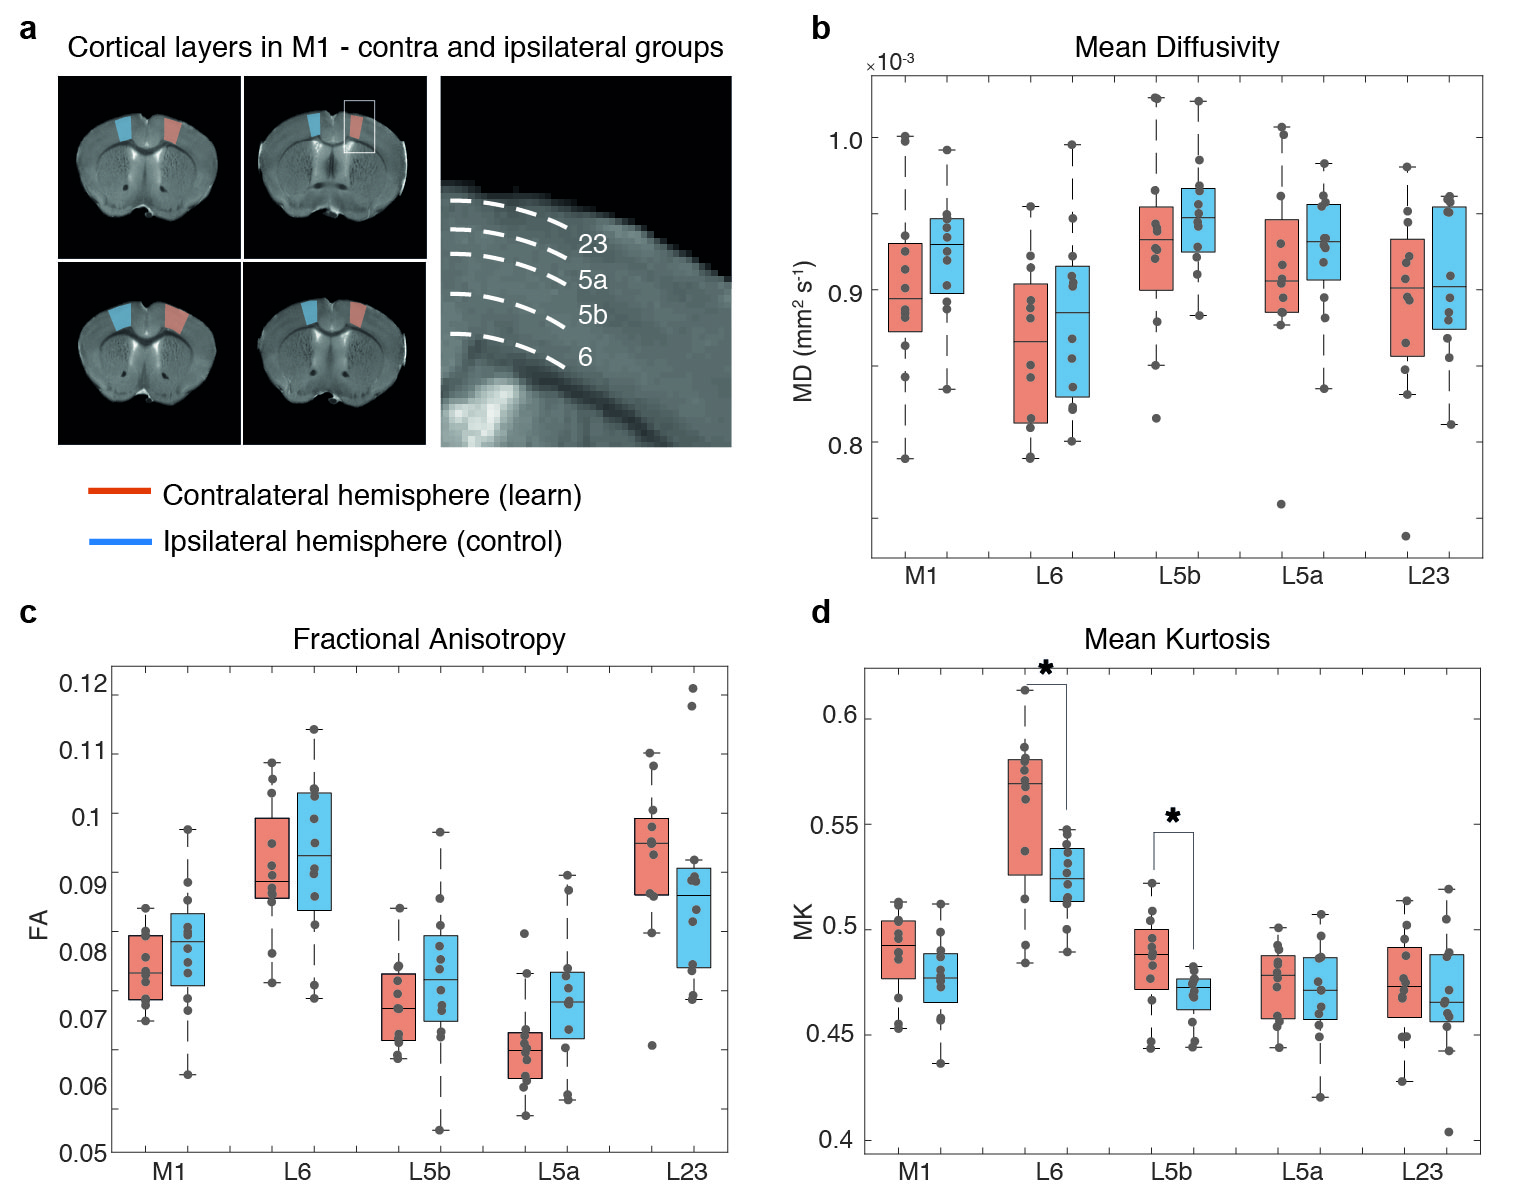
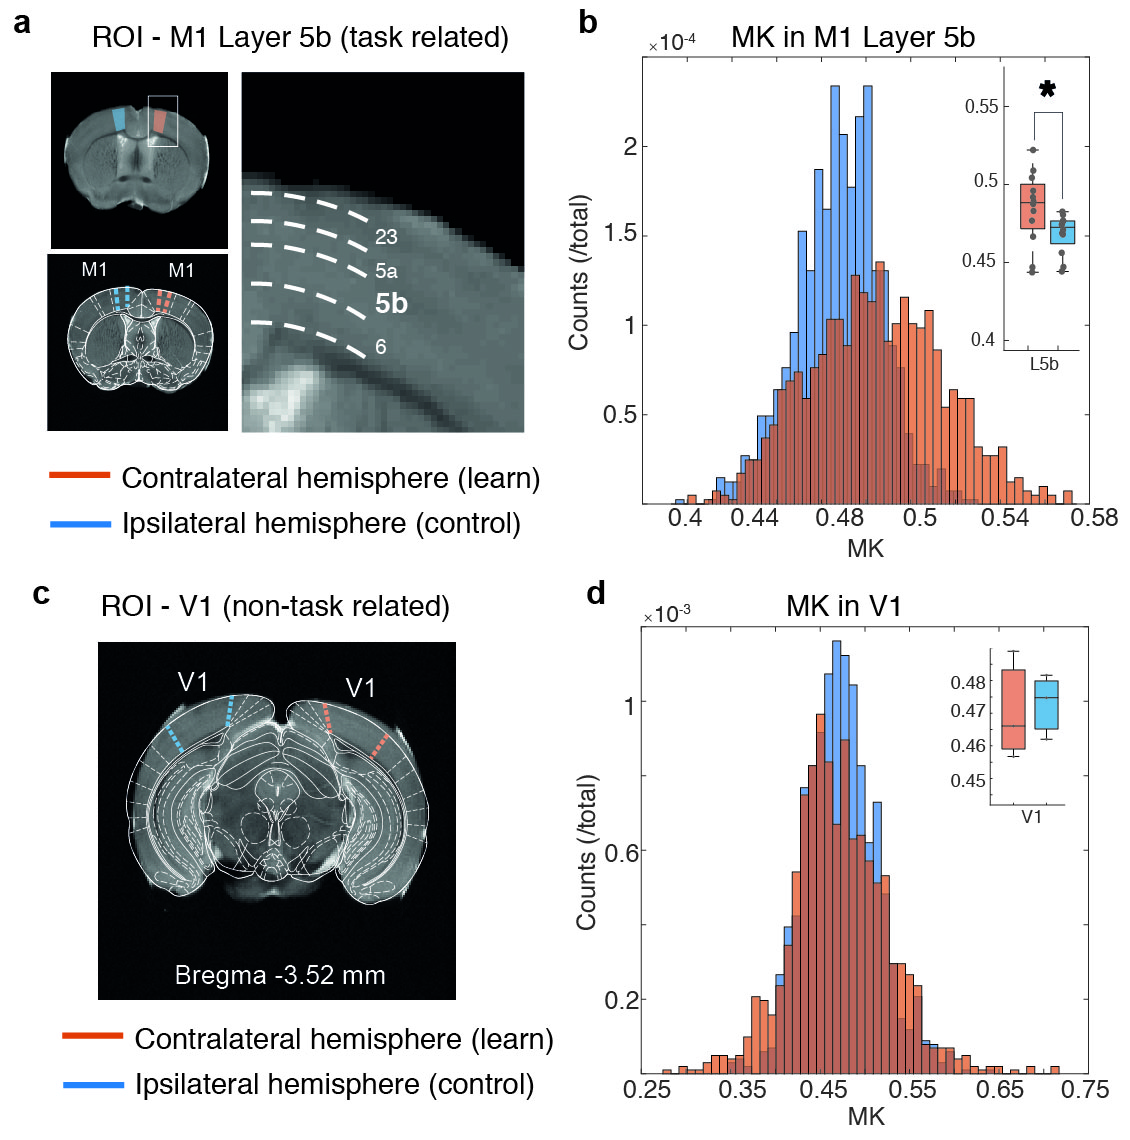
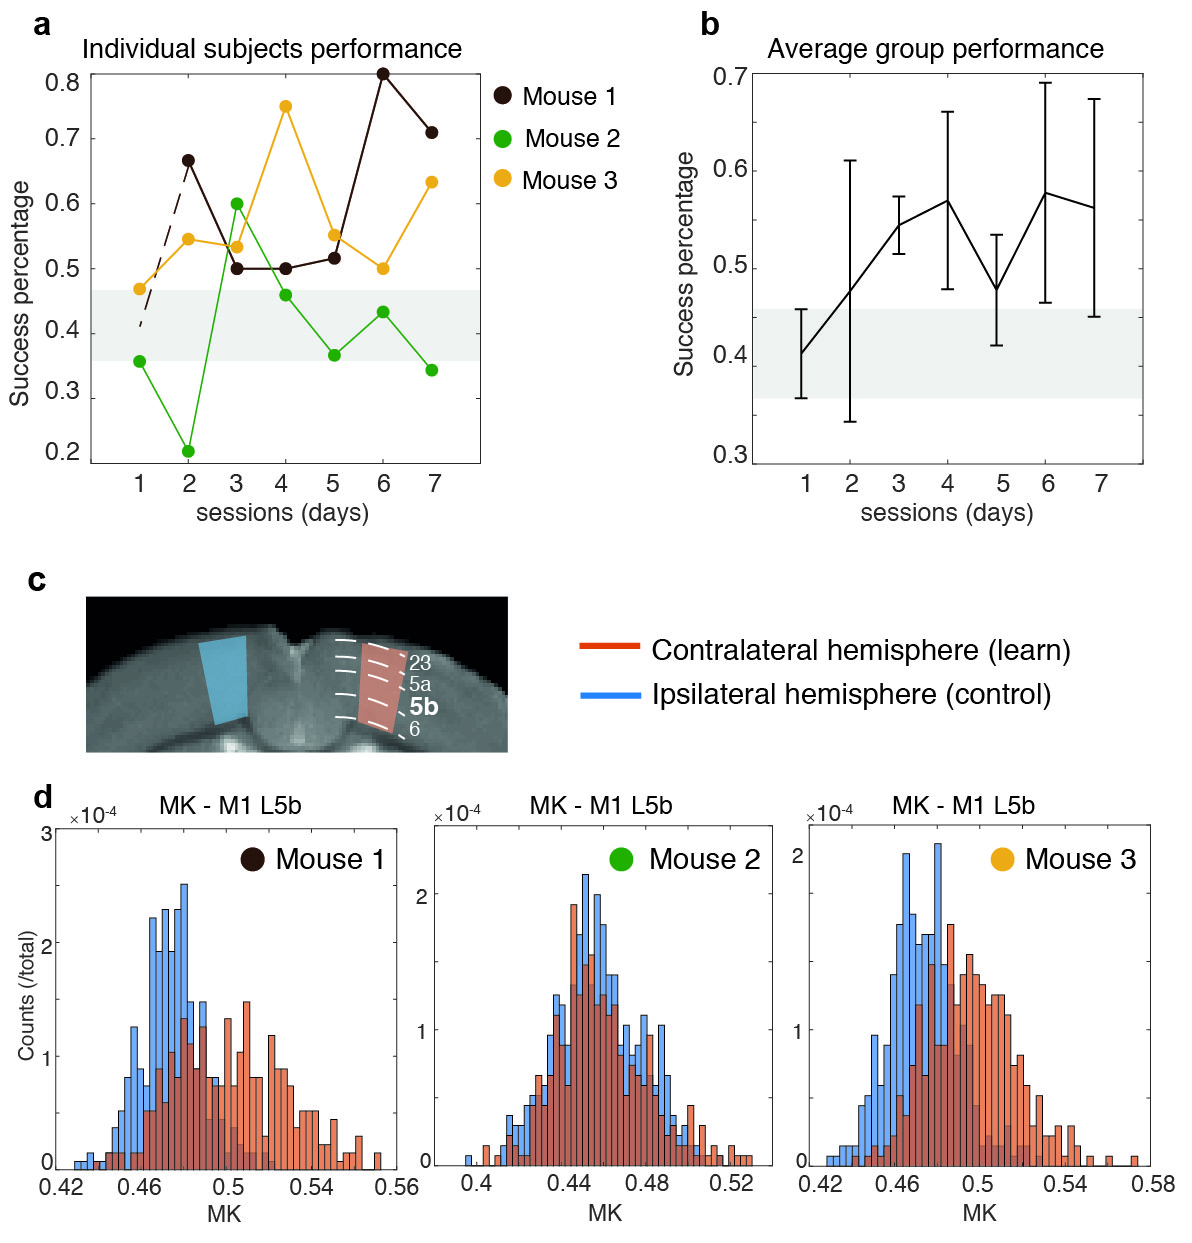
Motor skill performance increased over the training period. Fig. 2 shows parametric maps obtained from diffusion kurtosis imaging. Statistically significant differences between contra and ipsilateral hemispheres were found in mean kurtosis (MK) of M1 layer 5b (p-value=0.030), while in M1 layer 6 both perpendicular kurtosis (p-value=0.026) and MK (p-value=0.030) varied significantly. Fig. 3 shows the boxplots of fractional anisotropy (FA), mean diffusion (MD) and MK for each ROI. FA shows visible differences among layers but not between groups, while kurtosis parameters were most sensitive to learning. Such changes were not observed in (assumingly) uninvolved cortical regions such as V1 (Fig. 4). MK distributions were consistent between subjects in V1. Conversely, M1 variability depended on learning performance: the mouse with poor learning evidenced little changes in M1 (Fig. 5).Discussion
Motor skill acquisition induces lateralized microstructural changes in M1 layer 53,4. Here, we demonstrated that dMRI can reveal these learning-induced changes. Interestingly, the diffusion parameters better resolving cortical layers (FA) were not sensitive to learning. In particular, MK was most sensitive to learning, and appears to arise mainly from radial kurtosis (data not shown). Two-photon microscopy data demonstrated a transient increase in spine formation and dendritic reorganization followed by a selective stabilization of spines, hypothesized to encode motor memories4. Increased kurtosis may reflect these (or related) phenomena. The observation of a relationship between behavioural performance and changes in kurtosis – even if confounded by the small number of animals – is an encouraging first step. Given these results, experiments are underway to further correlate the variability between learning performance and MK, expand the statistical analysis to the whole-brain and elucidate the origins of the changes observed via histology. Still, this first observation of layer-specific microstructural changes induced by motor learning in GM sets the ground for future applications.Conclusions
Layer-specific microstructural changes in M1 upon learning a motor task were detected using DKI. Such alterations were specific to cortical areas involved in the task. Moreover, behavioural performance is related to the MK modulation magnitude. These preliminary results highlight the potential of dMRI to study plasticity from a global-brain perspective and in a longitudinal fashion.Acknowledgements
This study was supported through funding from Fundação da Ciência e Tecnologia (FCT), Portugal (SFRH/BD/124637/2016). TSD would like to thank Dr. Rui Simões for the insightful discussions, and Robert Hubbard from Johns Hopkins University for help setting the behavioural task. The authors are thankful to the Hardware and Software Platform (Champalimaud Centre for the Unknown), particularly to Paulo Carriço, and to João Frazão for their help building the automatic setup. The authors are also grateful to Prof. Mark D. Does and Dr. Kevin Harkins from Vanderbilt University for the remmiRARE pulse sequence that were supported through grant number NIH EB019980.References
1. Kleim, J. A., Barbay, S. & Nudo, R. Functional reorganization of the rat motor cortex following motor skill learning. J. Neurophysiol. 80, 3321–3325 (1998).
2. Kleim, J. A. et al. Cortical Synaptogenesis and Motor Map Reorganization Occur during Late, But Not Early, Phase of Motor Skill Learning. J. Neurosci. 24, 628–633 (2004).
3. Greenough, W. T., Larson, J. R. & Withers, G. S. Effects of unilateral and bilateral training in a reaching task on dendritic branching of neurons in the rat motor-sensory forelimb cortex. Behav. Neural Biol. 44, 301–314 (1985).
4. Xu, T. et al. Rapid formation and selective stabilization of synapses for enduring motor memories. Nature 462, 915–919 (2009).
5. Guo, J. Z. et al. Cortex commands the performance of skilled movement. Elife 4, 1–18 (2015).
6. Grillner, S. Action: The Role of Motor Cortex Challenged. Curr. Biol. 25, R508–R511 (2015).
7. Kawai, R. et al. Motor cortex is required for learning but not executing a motor skill. Neuron 86, 800–812 (2015).
8. Draganski, B. & May, A. Training-induced structural changes in the adult human brain. Behav. Brain Res. 192, 137–142 (2008).
9. Zatorre, R. J., Fields, R. D. & Johansen-Berg, H. Plasticity in gray and white: Neuroimaging changes in brain structure during learning. Nat. Neurosci. 15, 528–536 (2012).
10. Sampaio-Baptista, C. et al. Motor Skill Learning Induces Changes in White Matter Microstructure and Myelination. J. Neurosci. 33, 19499–19503 (2013).
11. Jensen, J. H., Helpern, J. A., Ramani, A., Lu, H. & Kaczynski, K. Diffusional kurtosis imaging: The quantification of non-Gaussian water diffusion by means of magnetic resonance imaging. Magn. Reson. Med. 53, 1432–1440 (2005).
12. Buonomano, D. V & Merzenich, M. M. Cortical plasticity: from synapses to maps. Annu. Rev. Neurosci. 21, 149–186 (1998).
13. Sanes, J. N. & Donoghue, J. P. Plasticity and Primary Motor Cortex. Annu. Rev. Neurosci. 393–415 (2000).
14. Zeiler, S. R. et al. Paradoxical Motor Recovery From a First Stroke After Induction of a Second Stroke: Reopening a Postischemic Sensitive Period. Neurorehabil. Neural Repair (2015).
15. Zeiler, S. R. et al. Medial premotor cortex shows a reduction in inhibitory markers and mediates recovery in a mouse model of focal stroke. Stroke 44, 483–489 (2013).
16. Veraart, J. et al. Denoising of diffusion MRI using random matrix theory. Neuroimage 142, 394–406 (2016).
17. Kellner, E., Dhital, B., Kiselev, V. G. & Reisert, M. Gibbs-ringing artifact removal based on local subvoxel-shifts. Magn. Reson. Med. 76, 1574–1581 (2016).
18. Neto Henriques, R., Correia, M. M., Nunes, R. G. & Ferreira, H. A. Exploring the 3D geometry of the diffusion kurtosis tensor-Impact on the development of robust tractography procedures and novel biomarkers. Neuroimage 111, 85–99 (2015).
19. Veraart, J., Sijbers, J., Sunaert, S., Leemans, A. & Jeurissen, B. Weighted linear least squares estimation of diffusion MRI parameters: Strengths, limitations, and pitfalls. Neuroimage 81, 335–346 (2013).
20. Paxinos, G. & Franklin, K. B. J. The Mouse Brain in Stereotaxic Coordinates. (2001).
Figures