1148
Heritability of the mouse connectome1Center for In Vivo Microscopy, Department of Radiology, Duke University, Durham, NC, United States, 2Department of Genetics, Genomics and Informatics, University of Tennessee Health Science Center, Memphis, TN, United States, 3Institute for Computational Medicine, Johns Hopkins University, Baltimore, MD, United States
Synopsis
The human connectome project has demonstrated the enormous potential of functional and structural connectomics in understanding the brain. Extension of connectomics to mouse models has analogous potential, particularly where genetic variation can be controlled and manipulated. But the methods developed for human are not immediately extensible to the mouse models. We have developed a long term strategy, methods and infrastructure to make mouse connectomics routine with validation against tracer techniques. This project represents our first effort to deploy the methods in a study of heritability in a controlled collection of 4 genetically different strains.
Purpose
To evaluate the heritability of individual connections in 4 different mouse strains using diffusion magnetic resonance histology (MRH).Introduction
Structural connectomes generated in MRI are all derived from tractography1. In clinical diffusion scans, MRI voxels even at 1mm3 are too large to enable the resolution of axons, where thousands of neurons coexist in a single imaging voxel2. Recently, MRH has been used to generate a mesoscale connectome of the whole mouse brain at spatial resolution about ~ 12,000 times great than the clinical scans3. This method has been streamlined using compressed sensing to reduce the acquisition time without compromising the validity of the resulting connectomes4.Methods
Animal experiments were carried out in compliance with the Duke University Institutional Animal Care and Use Committee. Adult C57, DB2, CAST, and BTBR, mice (n=8/group) were actively stained and scanned at 9.4T (Oxford 8.9-cm vertical bore) using a modified 3D diffusion-weighed spin-echo pulse sequence using compressed sensing (CS) to accelerate the scan. The diffusion sampling protocol included 46 unique diffusion directions (b-value of 4000 s/mm2) and 5 non-diffusion-weighted (b0) measurements. The total acquisition time was 23.2 hours for one complete data set. CS reconstruction was applied to the under sampled k-space data slice by slice as described previously5. Tractography using generalized Q-sampling imaging (GQI) was generated in DSI Studio6. Whole brain connectivity maps were generated with 166 regions of interest (ROIs. The individual node strength was calculated using Brain Connectivity Toolbox7. Heritability matrix is estimated using the intra-class correlation coefficient, which is essentially a one-way repeated measures analysis of variance (ANOVA) of the reliability of the connectivity maps from 4 strains.Results
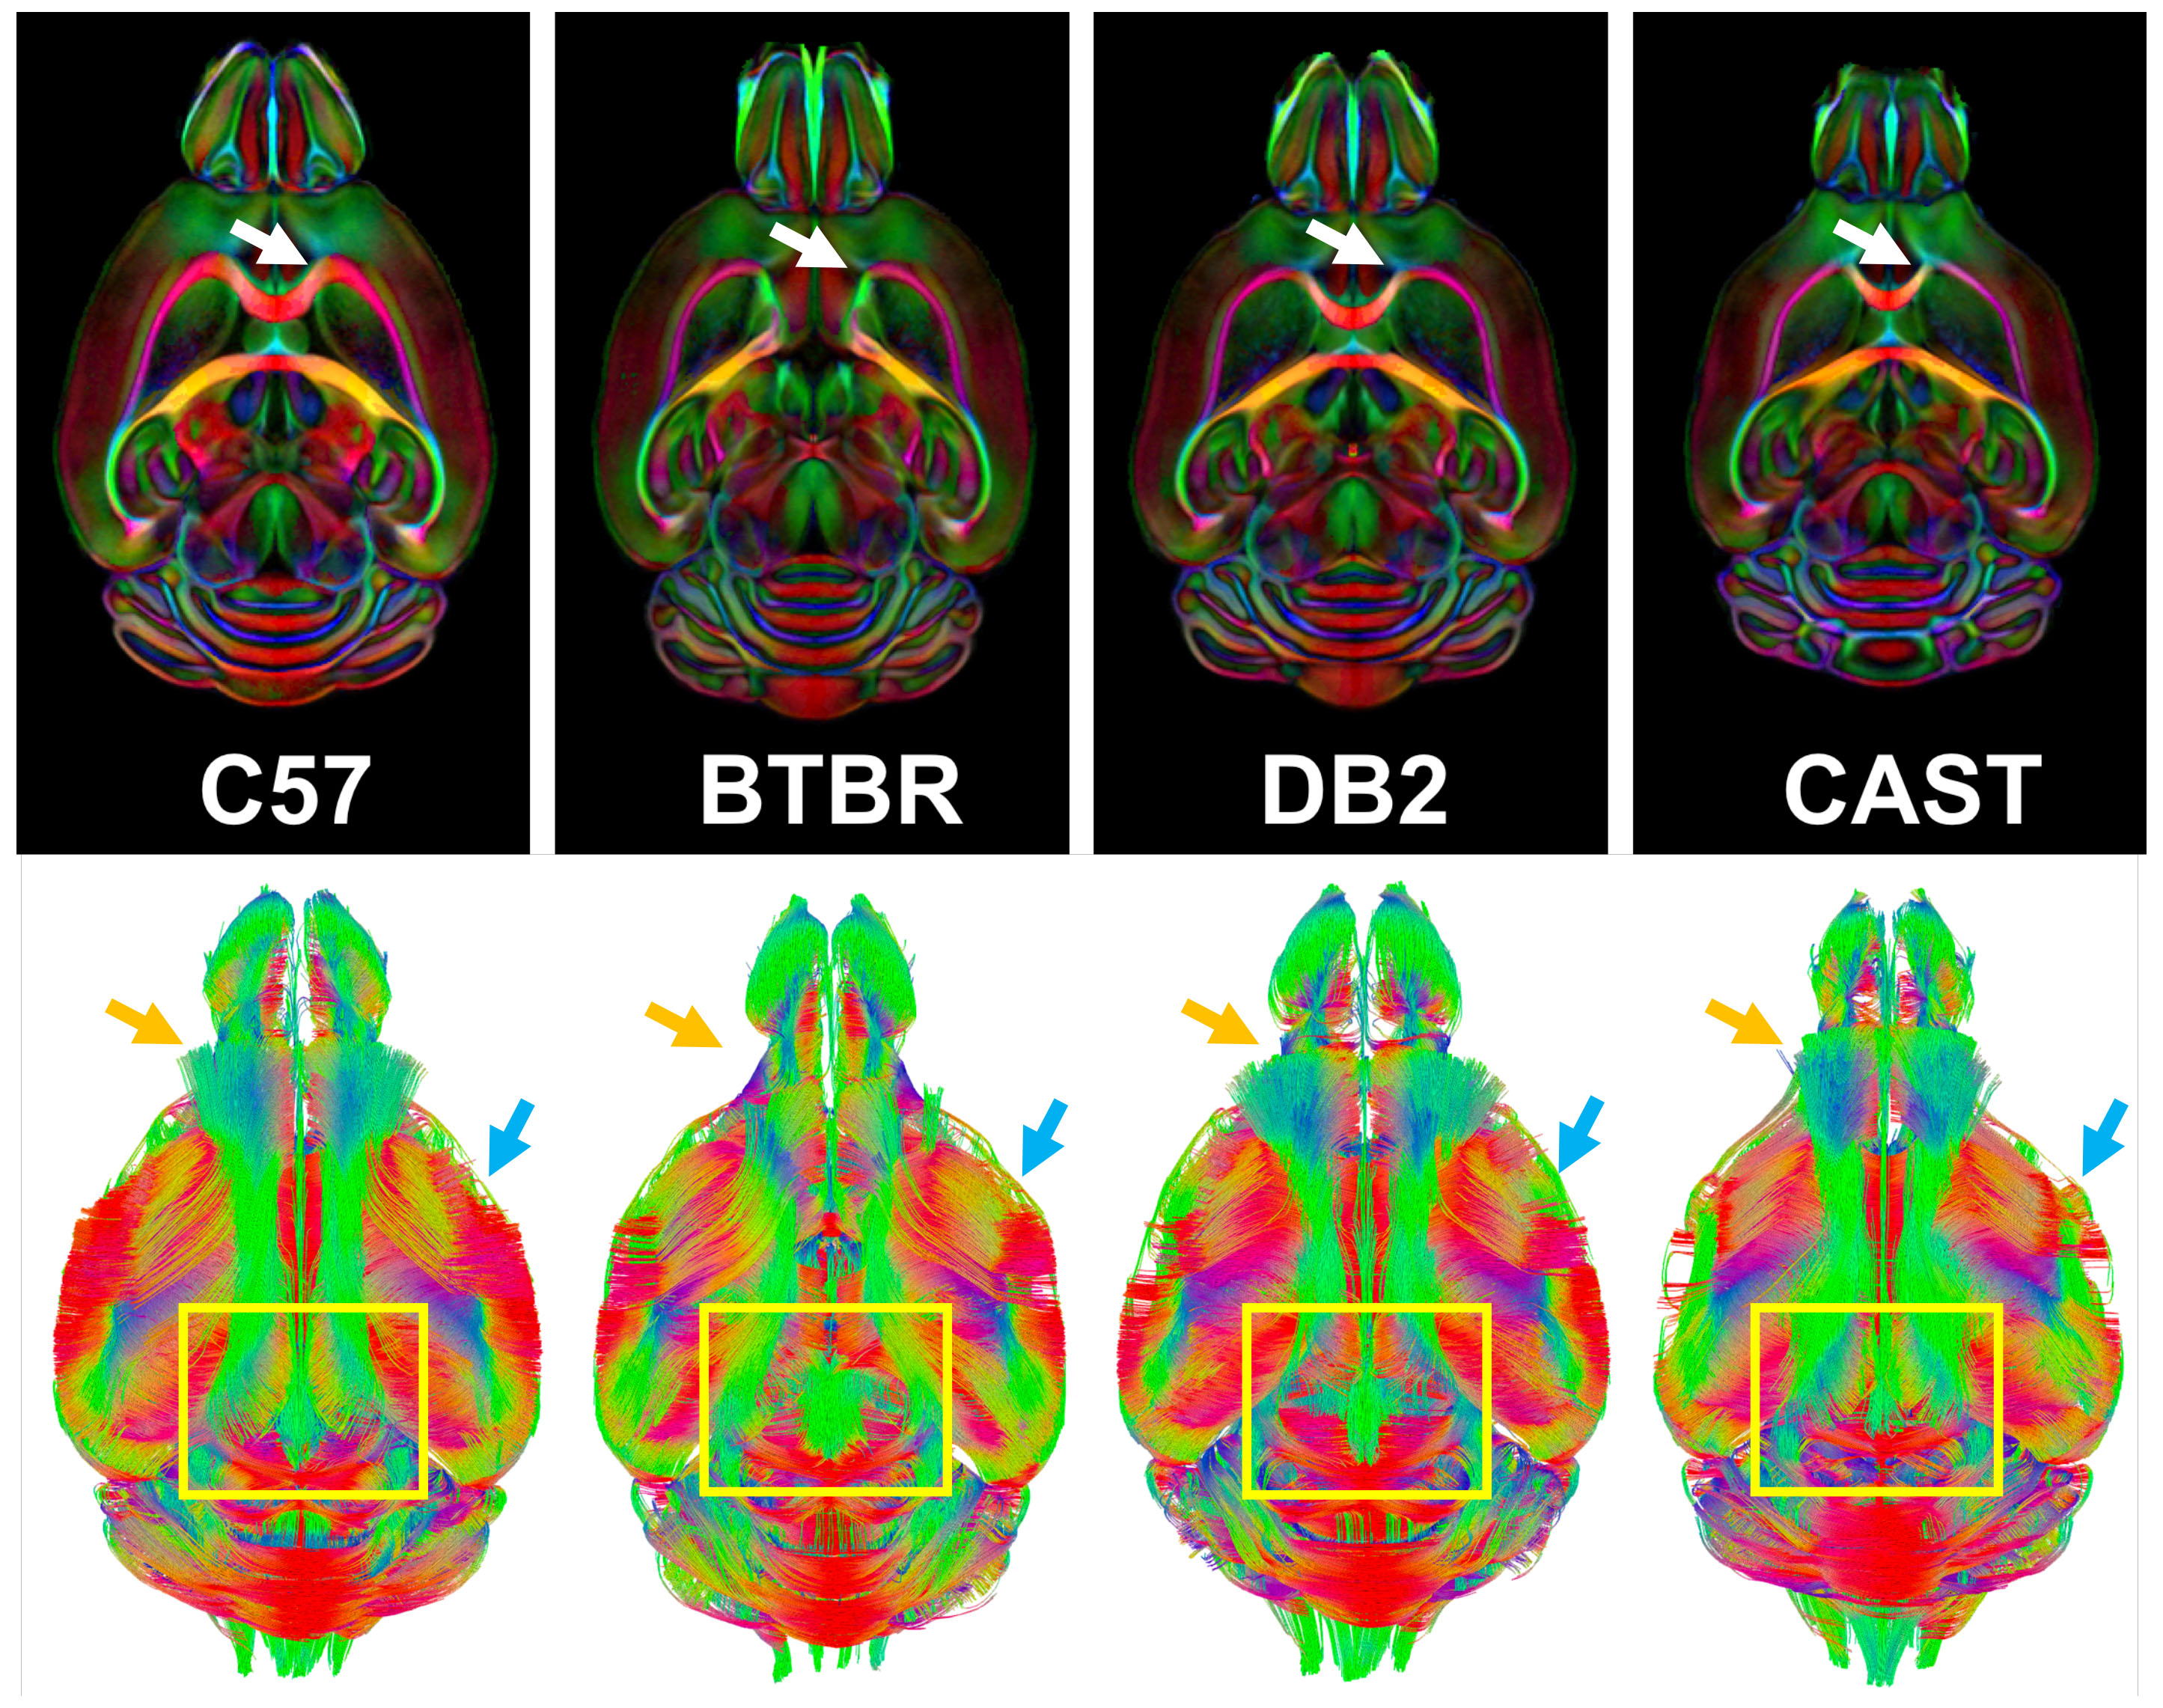
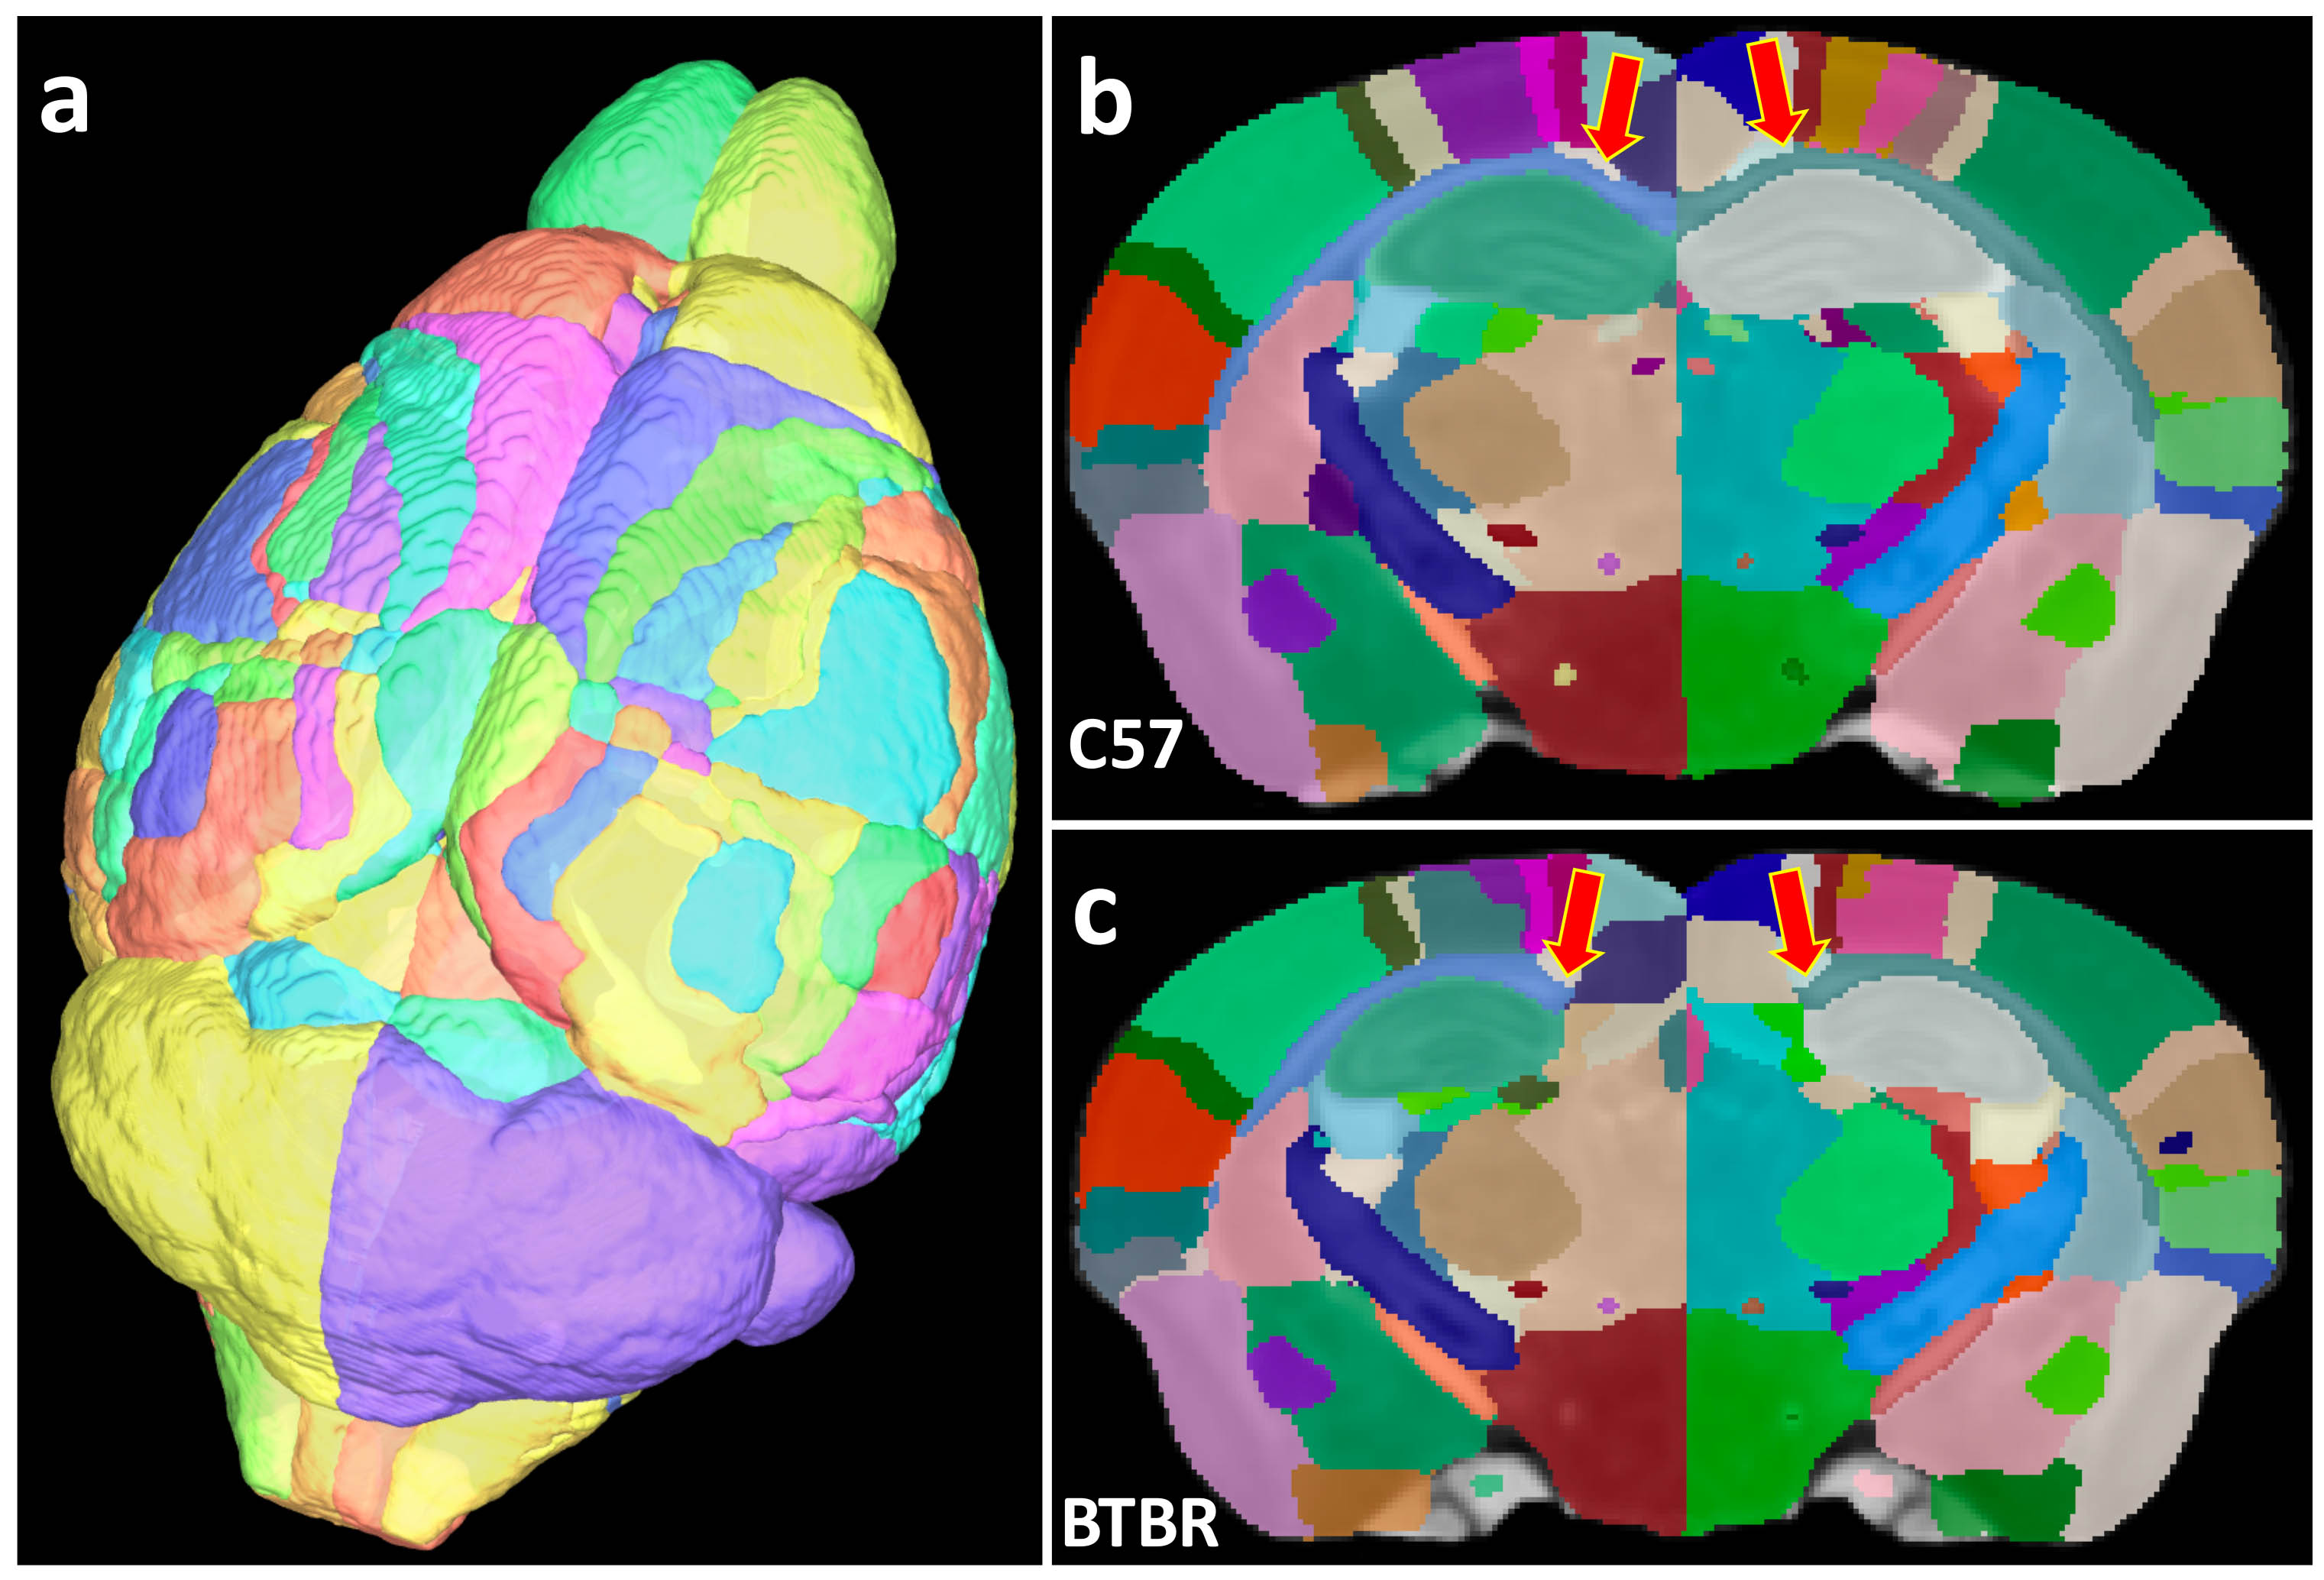
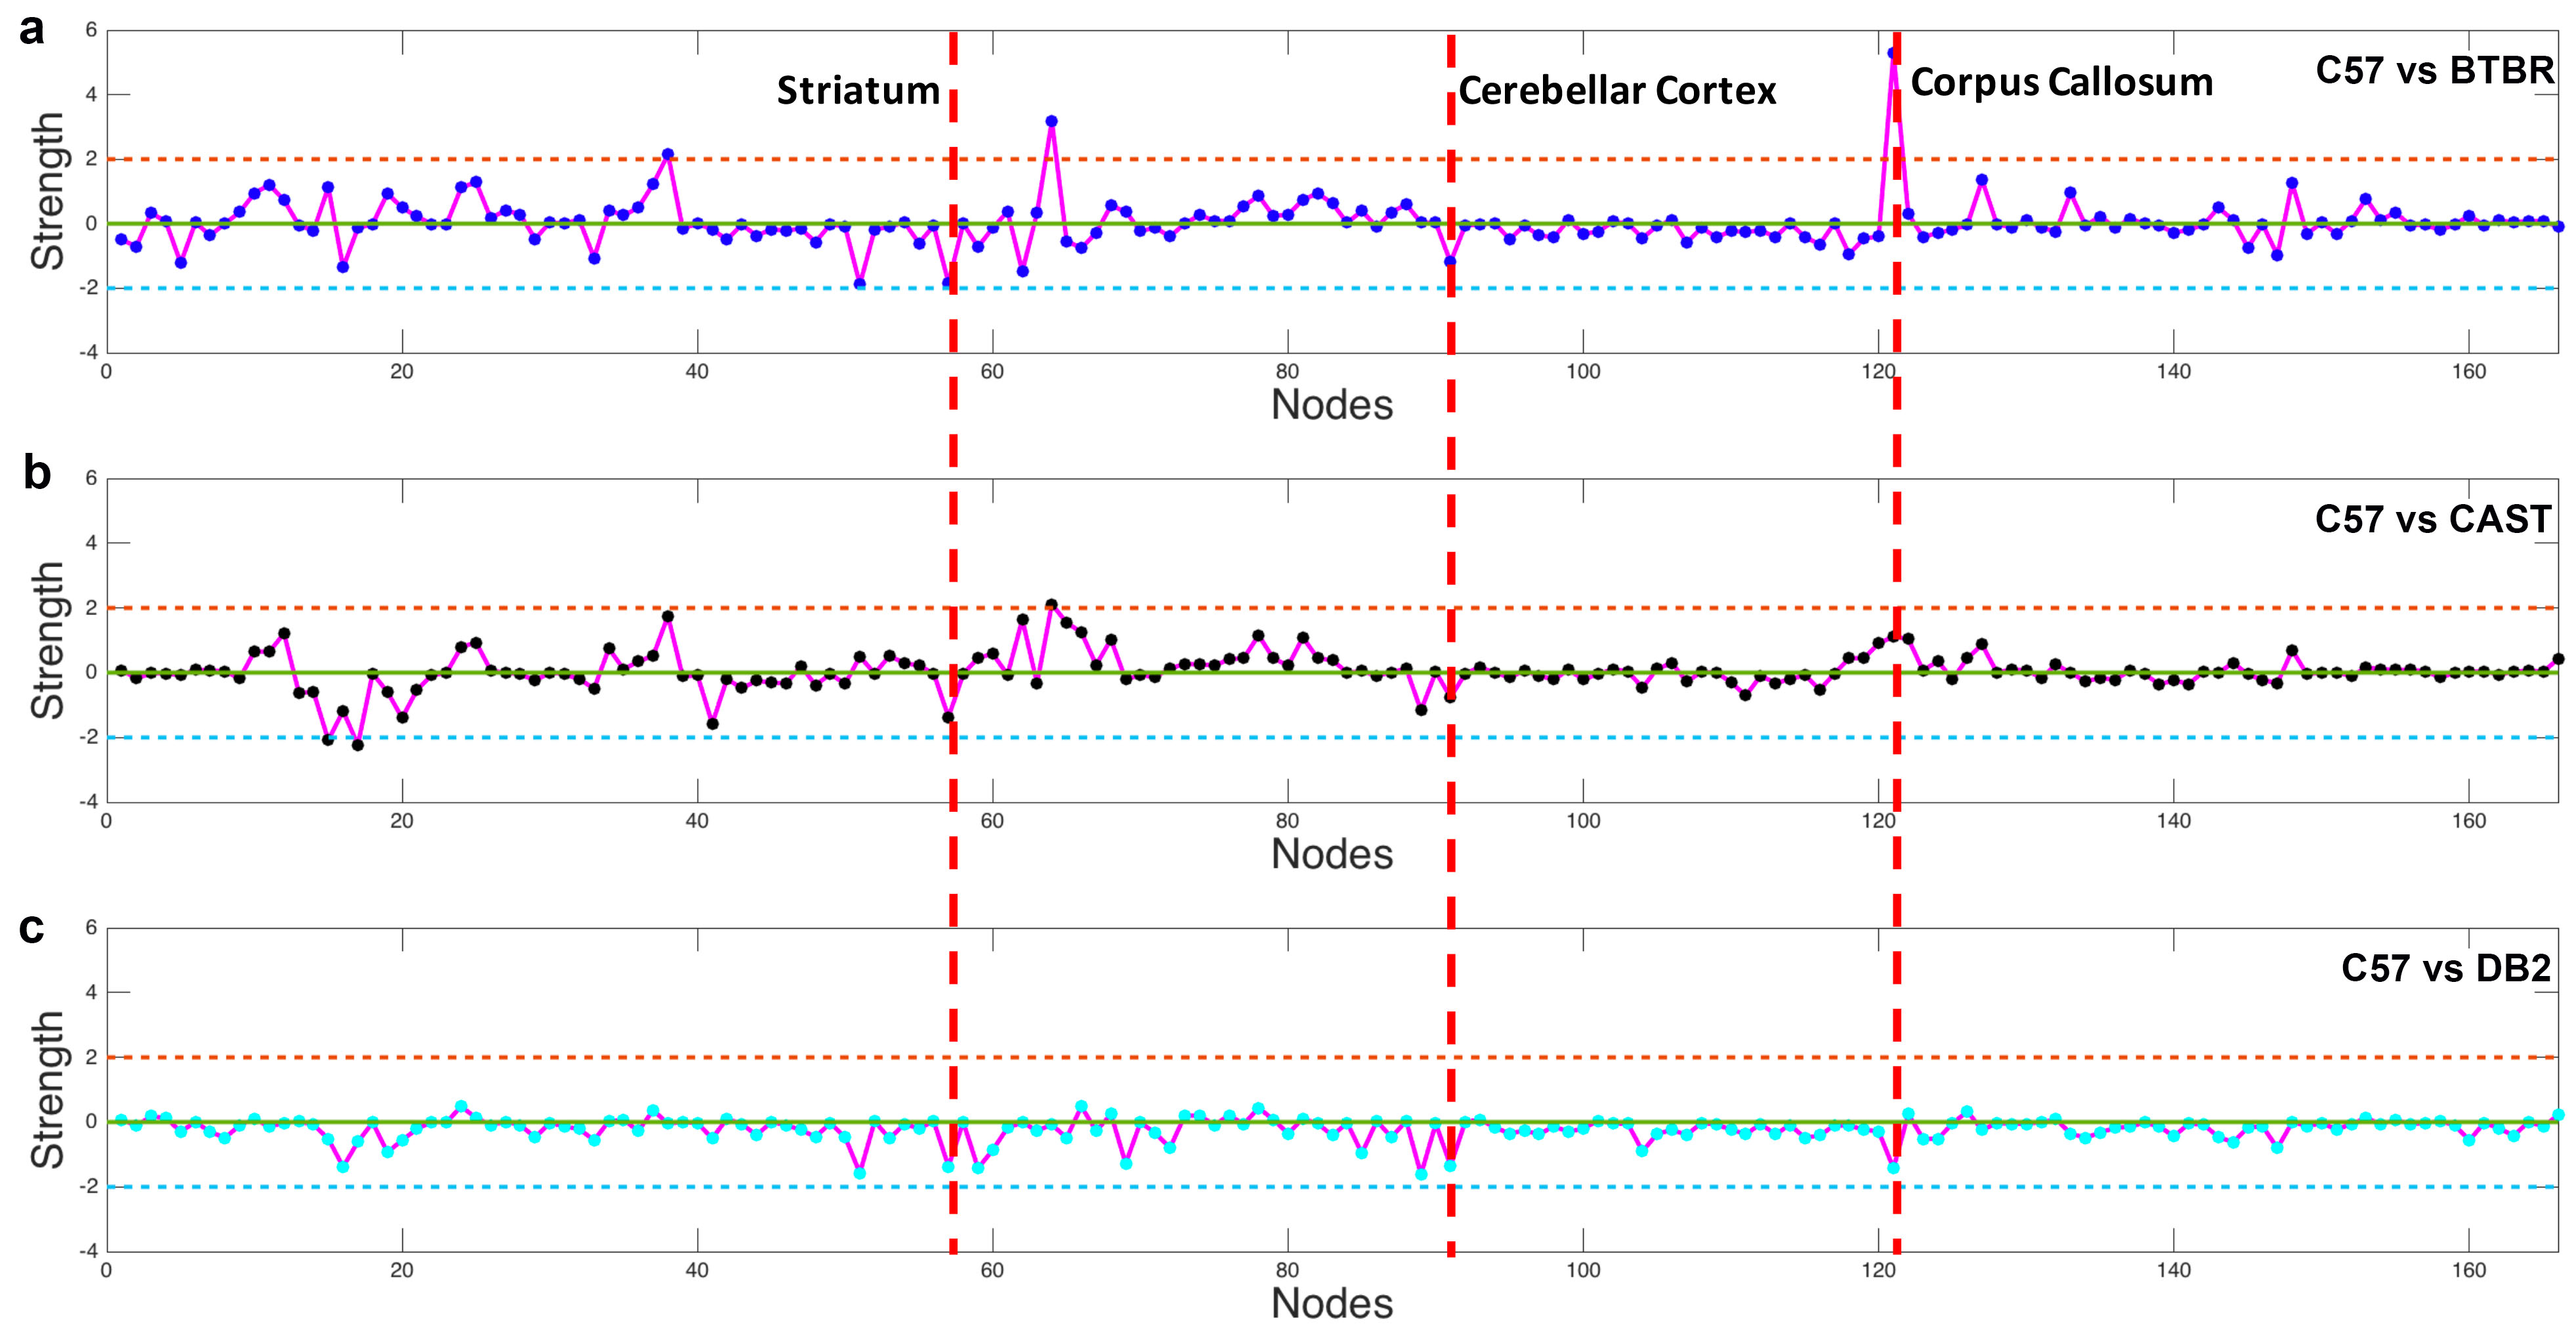
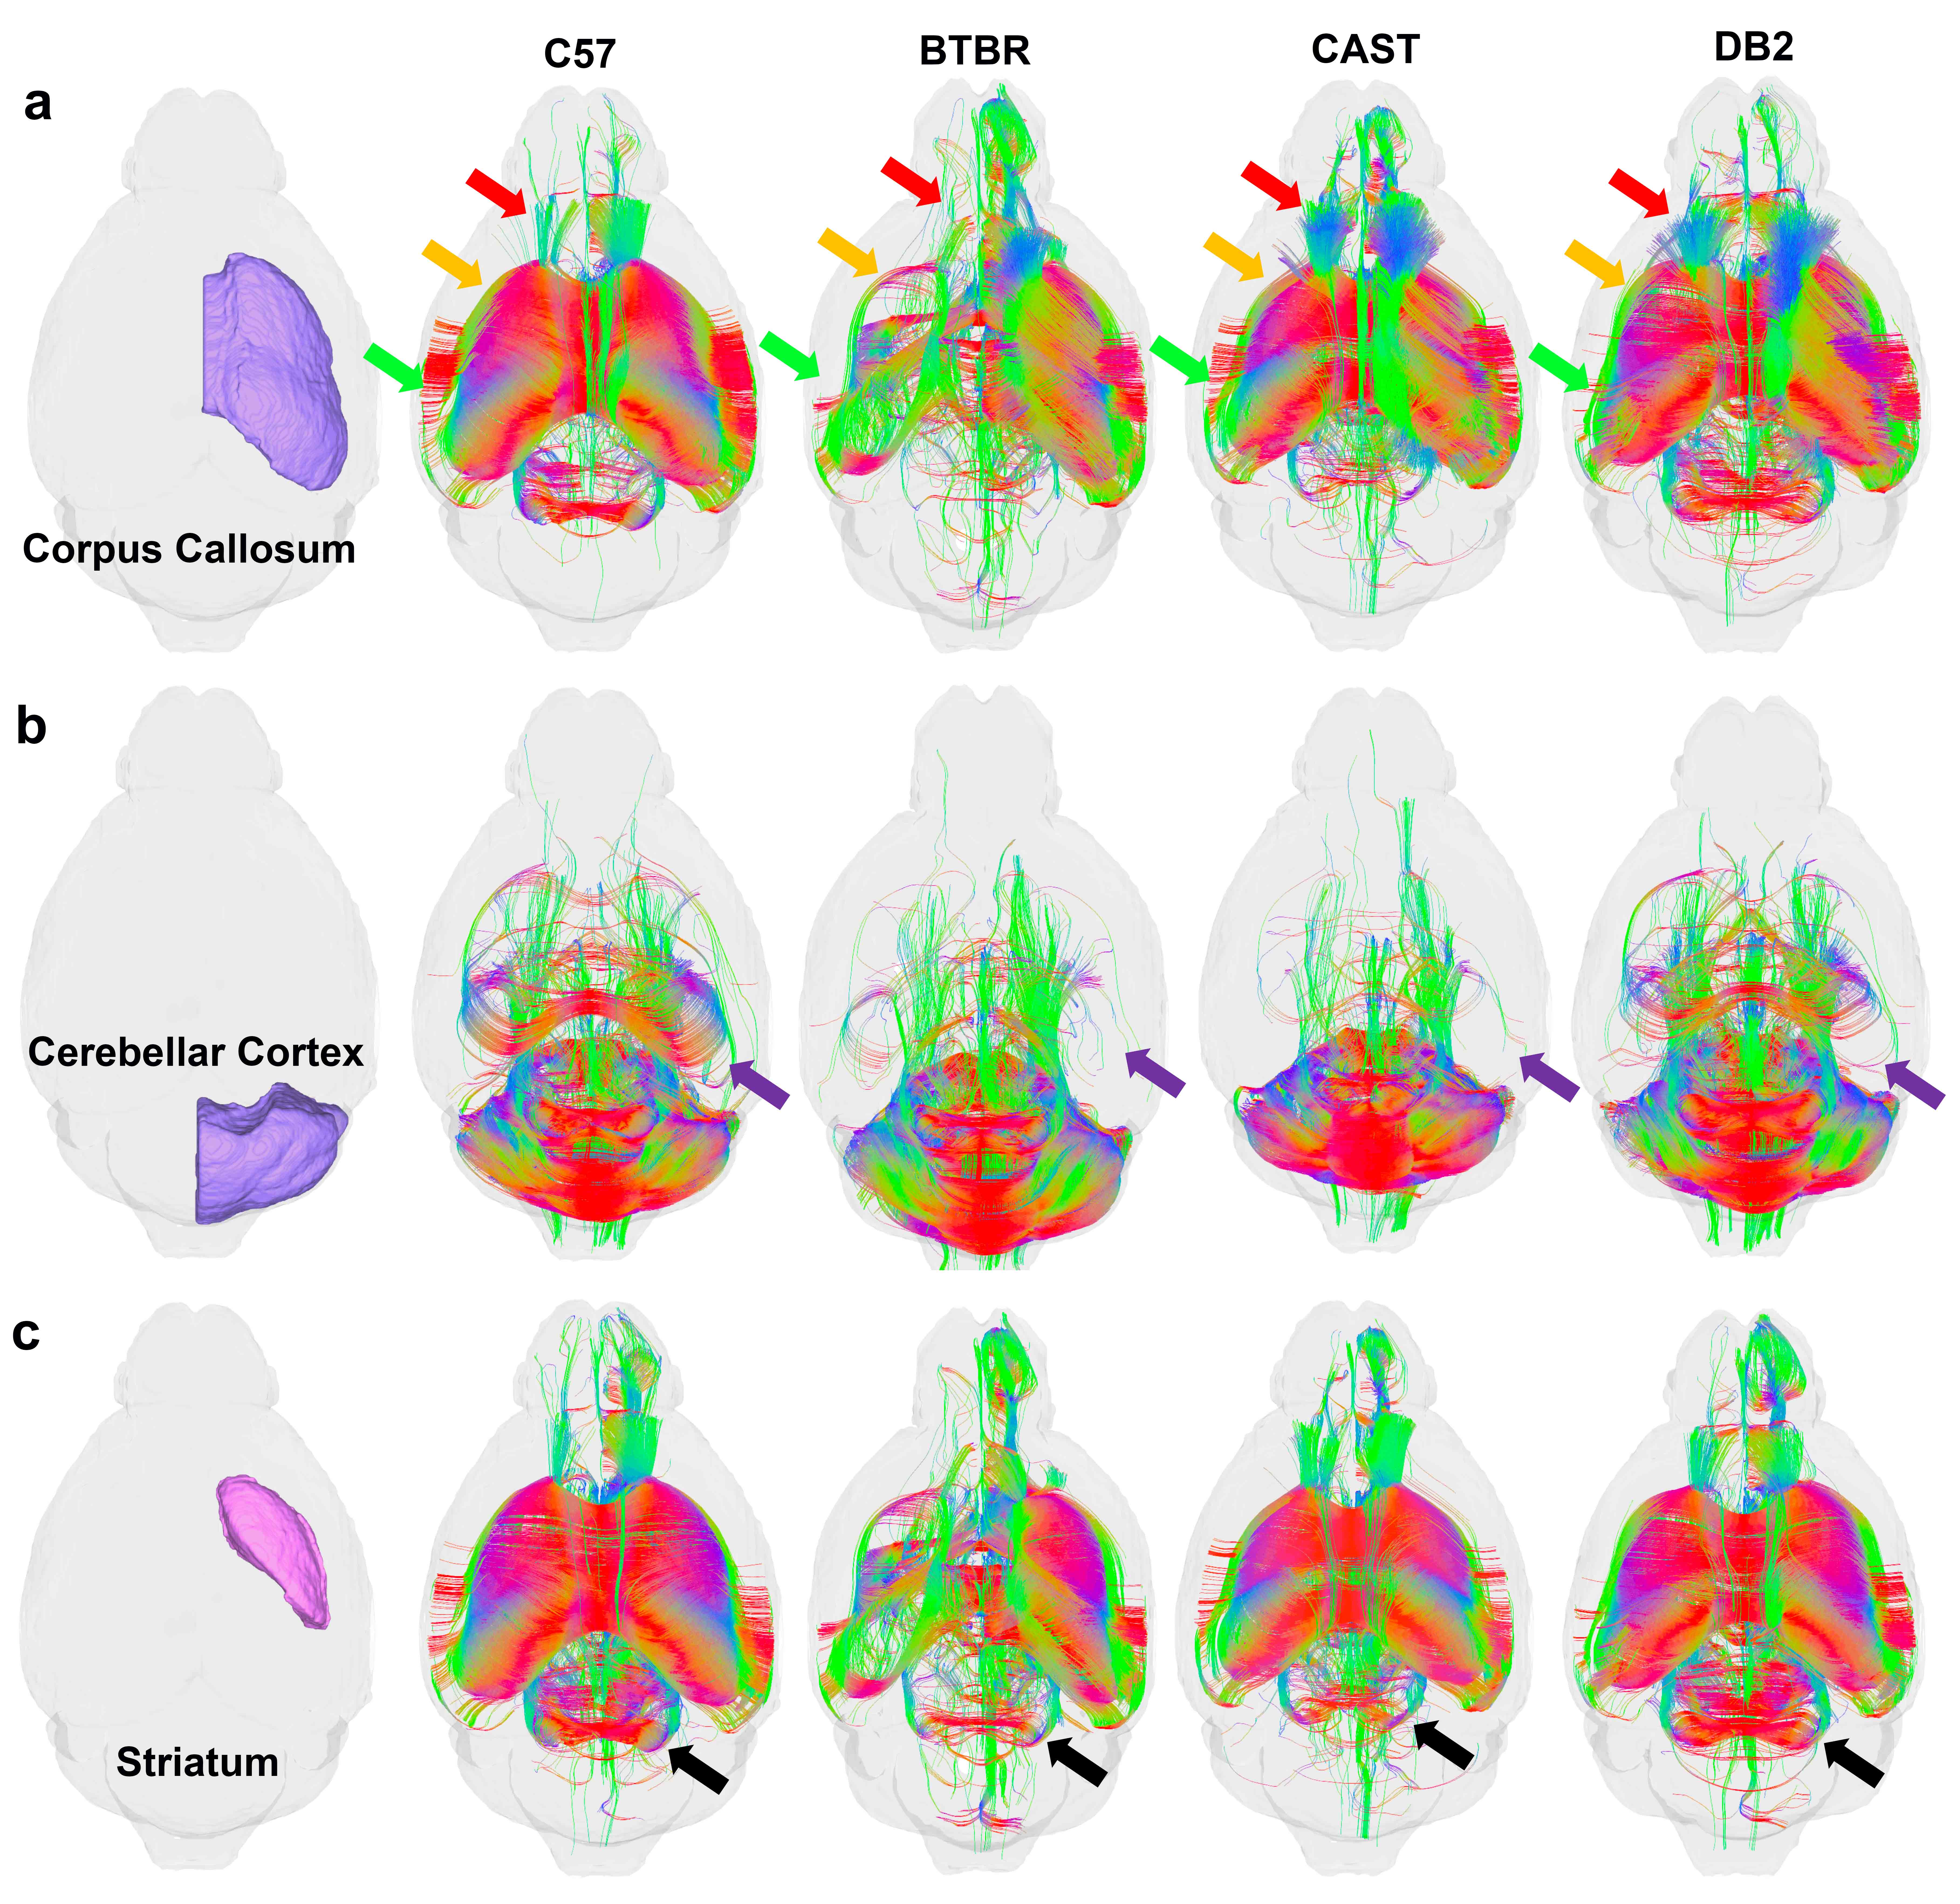
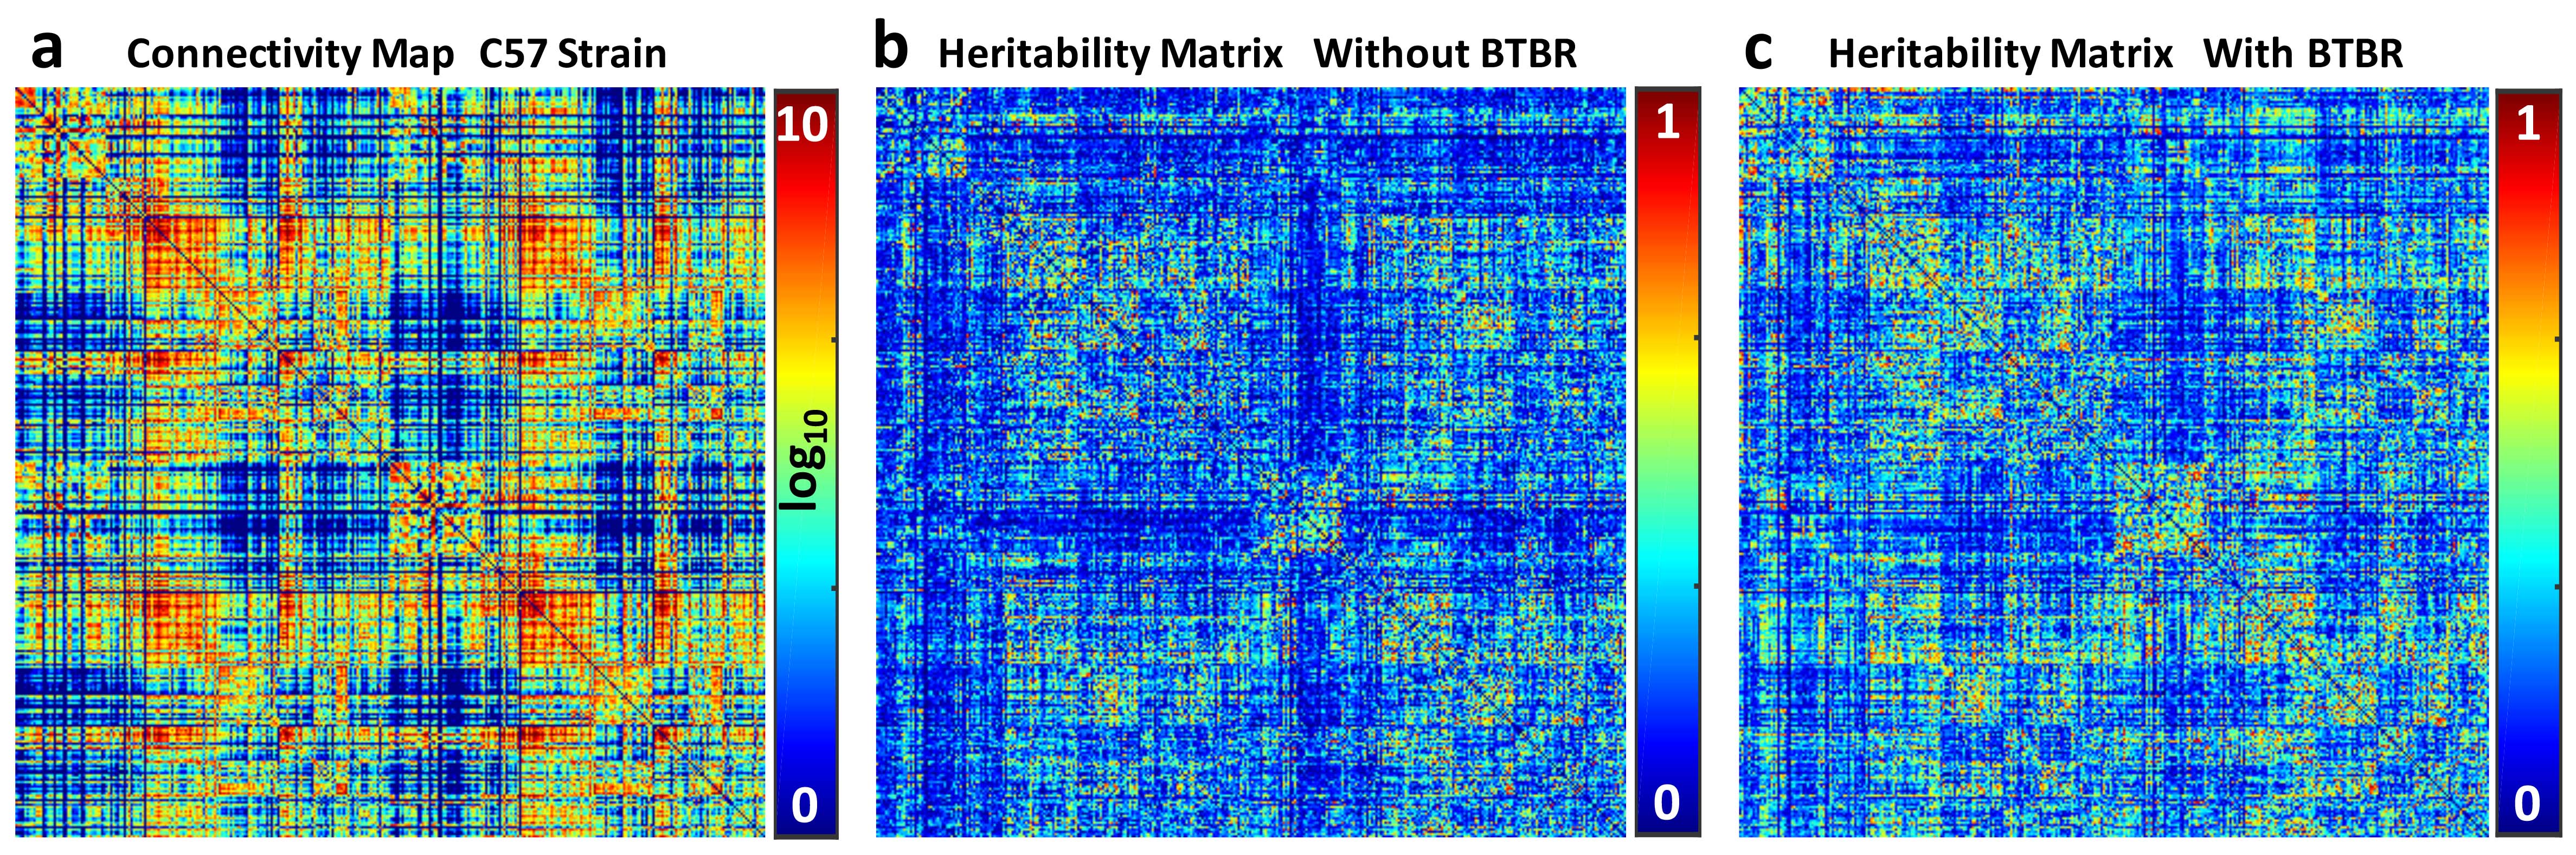
Figure 1 shows the whole brain tractography of 4 strains with the color-coded FA images. The difference of tractography can be found in cortex (yellow and blue arrows) and cerebella region (yellow boxes). Figure 2 illustrates the atlas used for connectivity analysis. The C57BL atlas containing 166 labels (figure 2a), which were propagated to the other 3 strains using automatic diffeomorphic registration with further manual corrections. A representative slice demonstrates the segmentation difference between C57 and BTBR in cc area (red arrows). Figure 3 plots the individual node strength difference between C57 and BTBR (a), C57 and CAST (b), and DB2 (c). Overall, BTBR shows the largest difference relative to the C57, and DB2 shows the smallest differences relative to C57. Tractography from three ROIs (cc, cerebellar cortex, and striatum) demonstrating the large strength variations between C57 and other strains (Figure 4). In cc region, tractography differences are shown in cortex (read and green arrows) and cc (yellow arrows, especially for BTBR). A similar trend is found in cerebellar cortex (purple arrows) and striatum regions (black arrows). Figure 5 shows the matrices summarizing the heritability of the tracts for all 4 strains. It is encouraging to see significant heritability in a number of the vertices for the C57, DB2, and CAST. These strains are similar but the methods distinguish noticeable heritability in specific vertices. Differences in the BTBR are profound, and the ability to identify specific tracts with the highest heritability may help understand this model.Discussion and Conclusion
Four strains were chosen from the BXD series for this study of connectomic heritability. The C57, DB2, and CAST were expected to have minimal differences. It was encouraging to see the methods are sufficiently sensitive to pick up differences in these similar strains. The BTBR was selected since it has demonstrated several characteristics of autism and should represent a more significant phenotypic difference. The methods reveal specific vertices with quantitative measures of heritability. We expect this ability will have significant value in understanding mouse models of neurologic disease.Acknowledgements
This work was supported by NIH/NIBIB P41 EB015897, Office of the Director 1S10ODO10683-01, NIH/NINDS 1R01NS096720-01A1.References
1. Bozzali M, Parker GJ, Serra L, Embleton K, Gili T, Perri R, Caltagirone C, Cercignani M. Anatomical connectivity mapping: a new tool to assess brain disconnection in Alzheimer’s disease. Neuroimage, 2011; 54(3):2045–2051.
2. Insel TR, Landis SC, Collins FS. The NIH BRAIN Initiative. Science, 2013;340(6133):687-688.
3. Calabrese E, Badea A, Cofer G, Qi Y, Johnson GA. A diffusion MRI tractography connectome of the mouse brain and comparison with neuronal tracer data. Cereb Cortex 2015;25(11):4628-4637.
4. Wang N, Anderson R, Badea A, Cofer G, Dibb R, Qi Y, Johnson GA. Whole mouse brain structural connectomics using magnetic resonance histology. Brain Struct Funct, 2018; https://doi.org/10.1007/s00429-018-1750-x
5. Wang N, Badar F, Xia Y. Compressed sensing in quantitative determination of GAG concentration in cartilage by microscopic MRI. Magn Reson Med, 2018; 79(6):3163-3171.
6. Yeh FC, Wedeen VJ, Tseng WY. Generalized q-sampling imaging. IEEE Trans Med Imaging 2010;29(9):1626-1635.
7. Rubinov M, Sporns O. Complex network measures of brain connectivity: uses and interpretations. Neuroimage;201052(3):1059-1069.
Figures