1146
Whole-brain functional magnetic resonance imaging of serotonergic neuron optogenetic activation1Champalimaud Research, Champalimaud Centre for the Unknown, Lisbon, Portugal
Synopsis
Serotonin (5-HT) has been implicated in a variety of brain processes and is a main target of psychoactive drugs, yet we know little about where and how 5-HT acts to ultimately shape behaviour. Here, we optogenetically stimulated serotonergic neurons in the mouse dorsal raphe nucleus (DRN), and mapped the ensuing downstream activity using BOLD fMRI. Furthermore, by pairing 5-HT stimulation with sensory stimuli, we revealed how 5-HT stimulation affects sensory-evoked activity. Our findings highlight the feasibility of using opto-fMRI, with and without concurrent manipulations, to study 5-HT modulation on downstream circuitry in the global brain in-vivo.
Introduction
The serotonergic (5-HT) system has been implicated in several brain processes1,2 and is a main target of psychoactive drugs3,4. Originating from a small group of cells in the raphe nuclei, 5-HT axons radiate from the brainstem to envelope nearly the entire forebrain. Such brain-wide innervation makes this system well-positioned to coordinate complex neural functions, but its widespread nature makes it difficult to study the system from a global perspective. In particular, although recordings and manipulations of these neurons have greatly advanced our understanding of 5-HT’s behavioral functions, we still know little about where and how 5-HT acts to mediate its effects. Here, we aimed to investigate brain-wide, 5-HT-driven network modulations using optogenetics fMRI with or without concurrent sensory stimuli to assess the impact of 5-HT stimulation on resting and sensory-evoked brain responses.Methods
All experiments were preapproved by the local animal ethics committee operating under local and EU laws. Serotonergic cells in the Dorsal Raphe Nucleus (DRN) were selectively targeted for optogenetic activation by injecting a CRE-dependent channelrhodopsin-expressing adeno-associated virus into mice expressing CRE under the serotonin transporter promoter5 (SERT-Cre, N=5) or wildtype controls (N=2). An optical fiber was implanted over the same location, as previously described6.
BOLD fMRI measurements were performed on a 9.4 T Bruker BioSpec scanner equipped with an AVANCE III HD console and a 86 mm quadrature resonator for transmission and (1) a 4-element array coil for multislice gradient-echo echo-planar imaging (GE-EPI) experiments (TR/TE 1000/11ms, 1 shot, in-plane resolution 0.17x0.17mm2, slice thichkenss 0.7mm) or (2) a 4-element cryoprobe for 3D GE-EPI experiments (TR/TE 1500/15ms, 1 shot, 0.18x0.18x0.3mm3 resolution).
Animals were sedated using medetomidine 0.4mg/kg bolus and 0.8mg/kg/h infusion s.c. Temperature and respiration rate were continuously monitored and remained stable throughout the sessions.
Optogenetic stimulation was delivered in 8 blocks, each consisting of 10 seconds photostimulation (10ms pulses at 25Hz, 5mW delivered by a 473nm laser) followed by 50 seconds of rest. To diminish visual stimulation from the optogenetics, blue LED light was flashed near the mouse’s eyes at the same frequency throughout the experiments. For the sensory experiments, either an odor (amyl acetate diluted 1:10 in mineral oil, delivered using a custom-built olfactometer) or a visual stimulus (flashes at 25 Hz, 0.1mW) were presented for 3 or 10s, respectively, once every minute for a total of 8 mins.
Images were slice-timing and motion corrected, spatially smoothed (FWHM=0.17mm), coregistered and normalized to an atlas7 in SPM12. Region of interest (ROIs) were defined according to the atlas7 and their mean+-sem signals extracted and drift-corrected. The average cycle was calculated by averaging all stimulation epochs. The Fourier analysis was implemented as previously described8,9.
Results
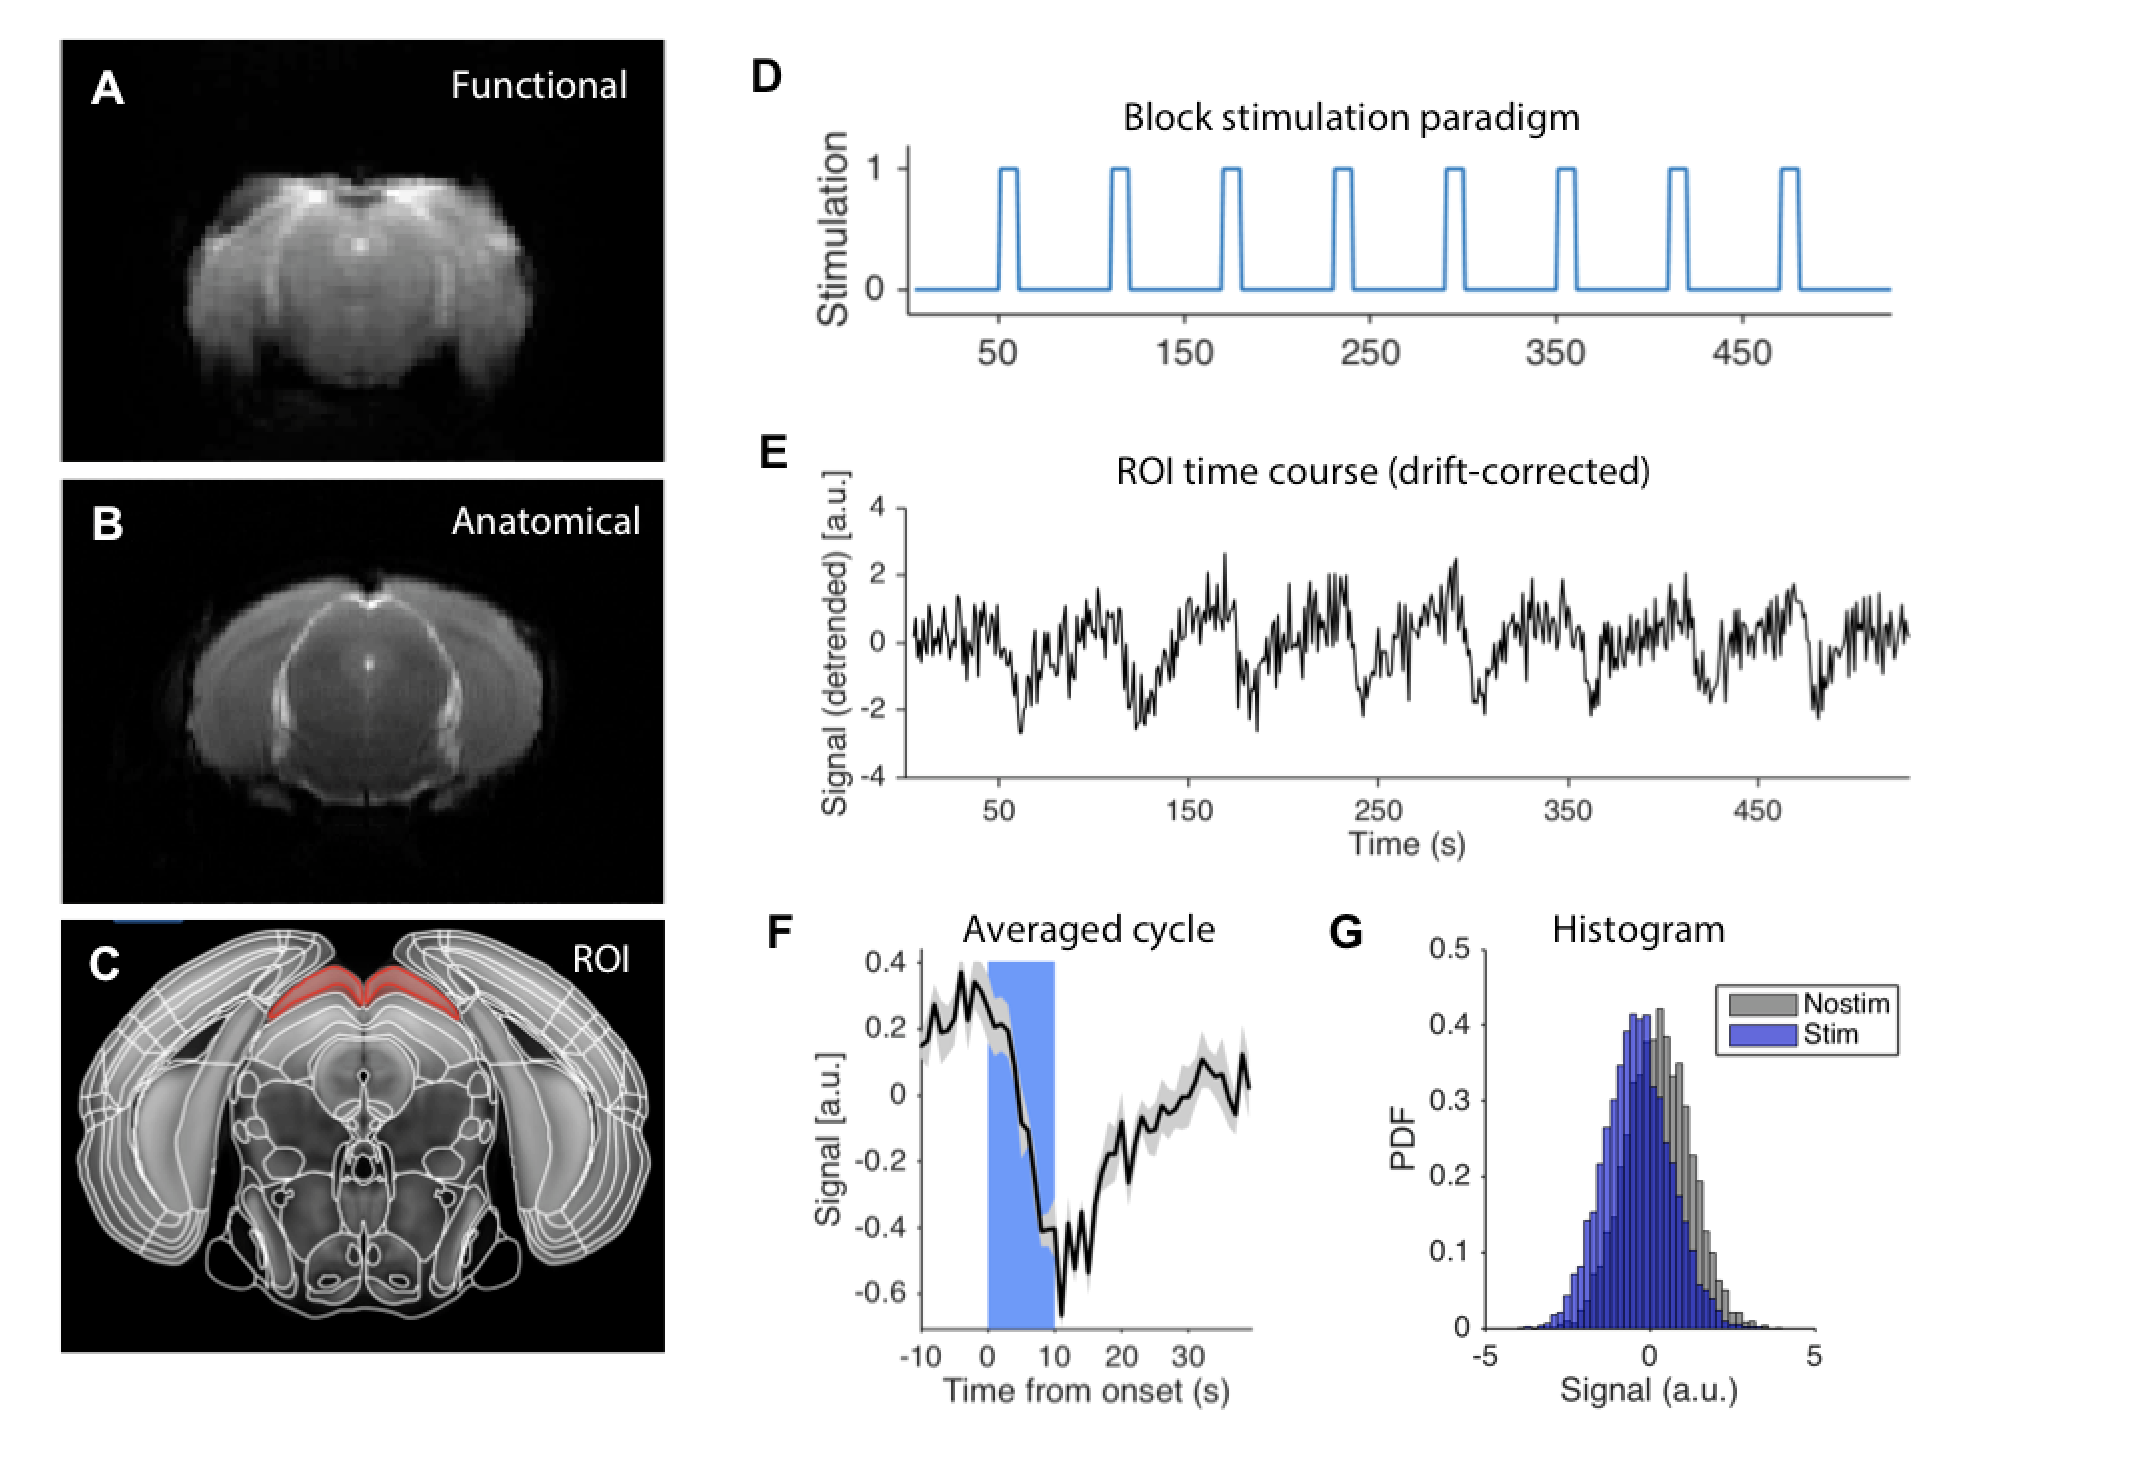
Raw functional and anatomical images evidenced high SNR (Figure 1A-B). The BOLD temporal profile for an example ROI (Figure 1C) is plotted for a representative animal, showing a clear decrease in BOLD signal coupled to each stimulation epoch (Figure 1D-E). The averaged response can be better appreciated in the averaged cycle plot (Figure 1F). The signal distributions at stimulated and rest periods show significant differences (Figure 1G).
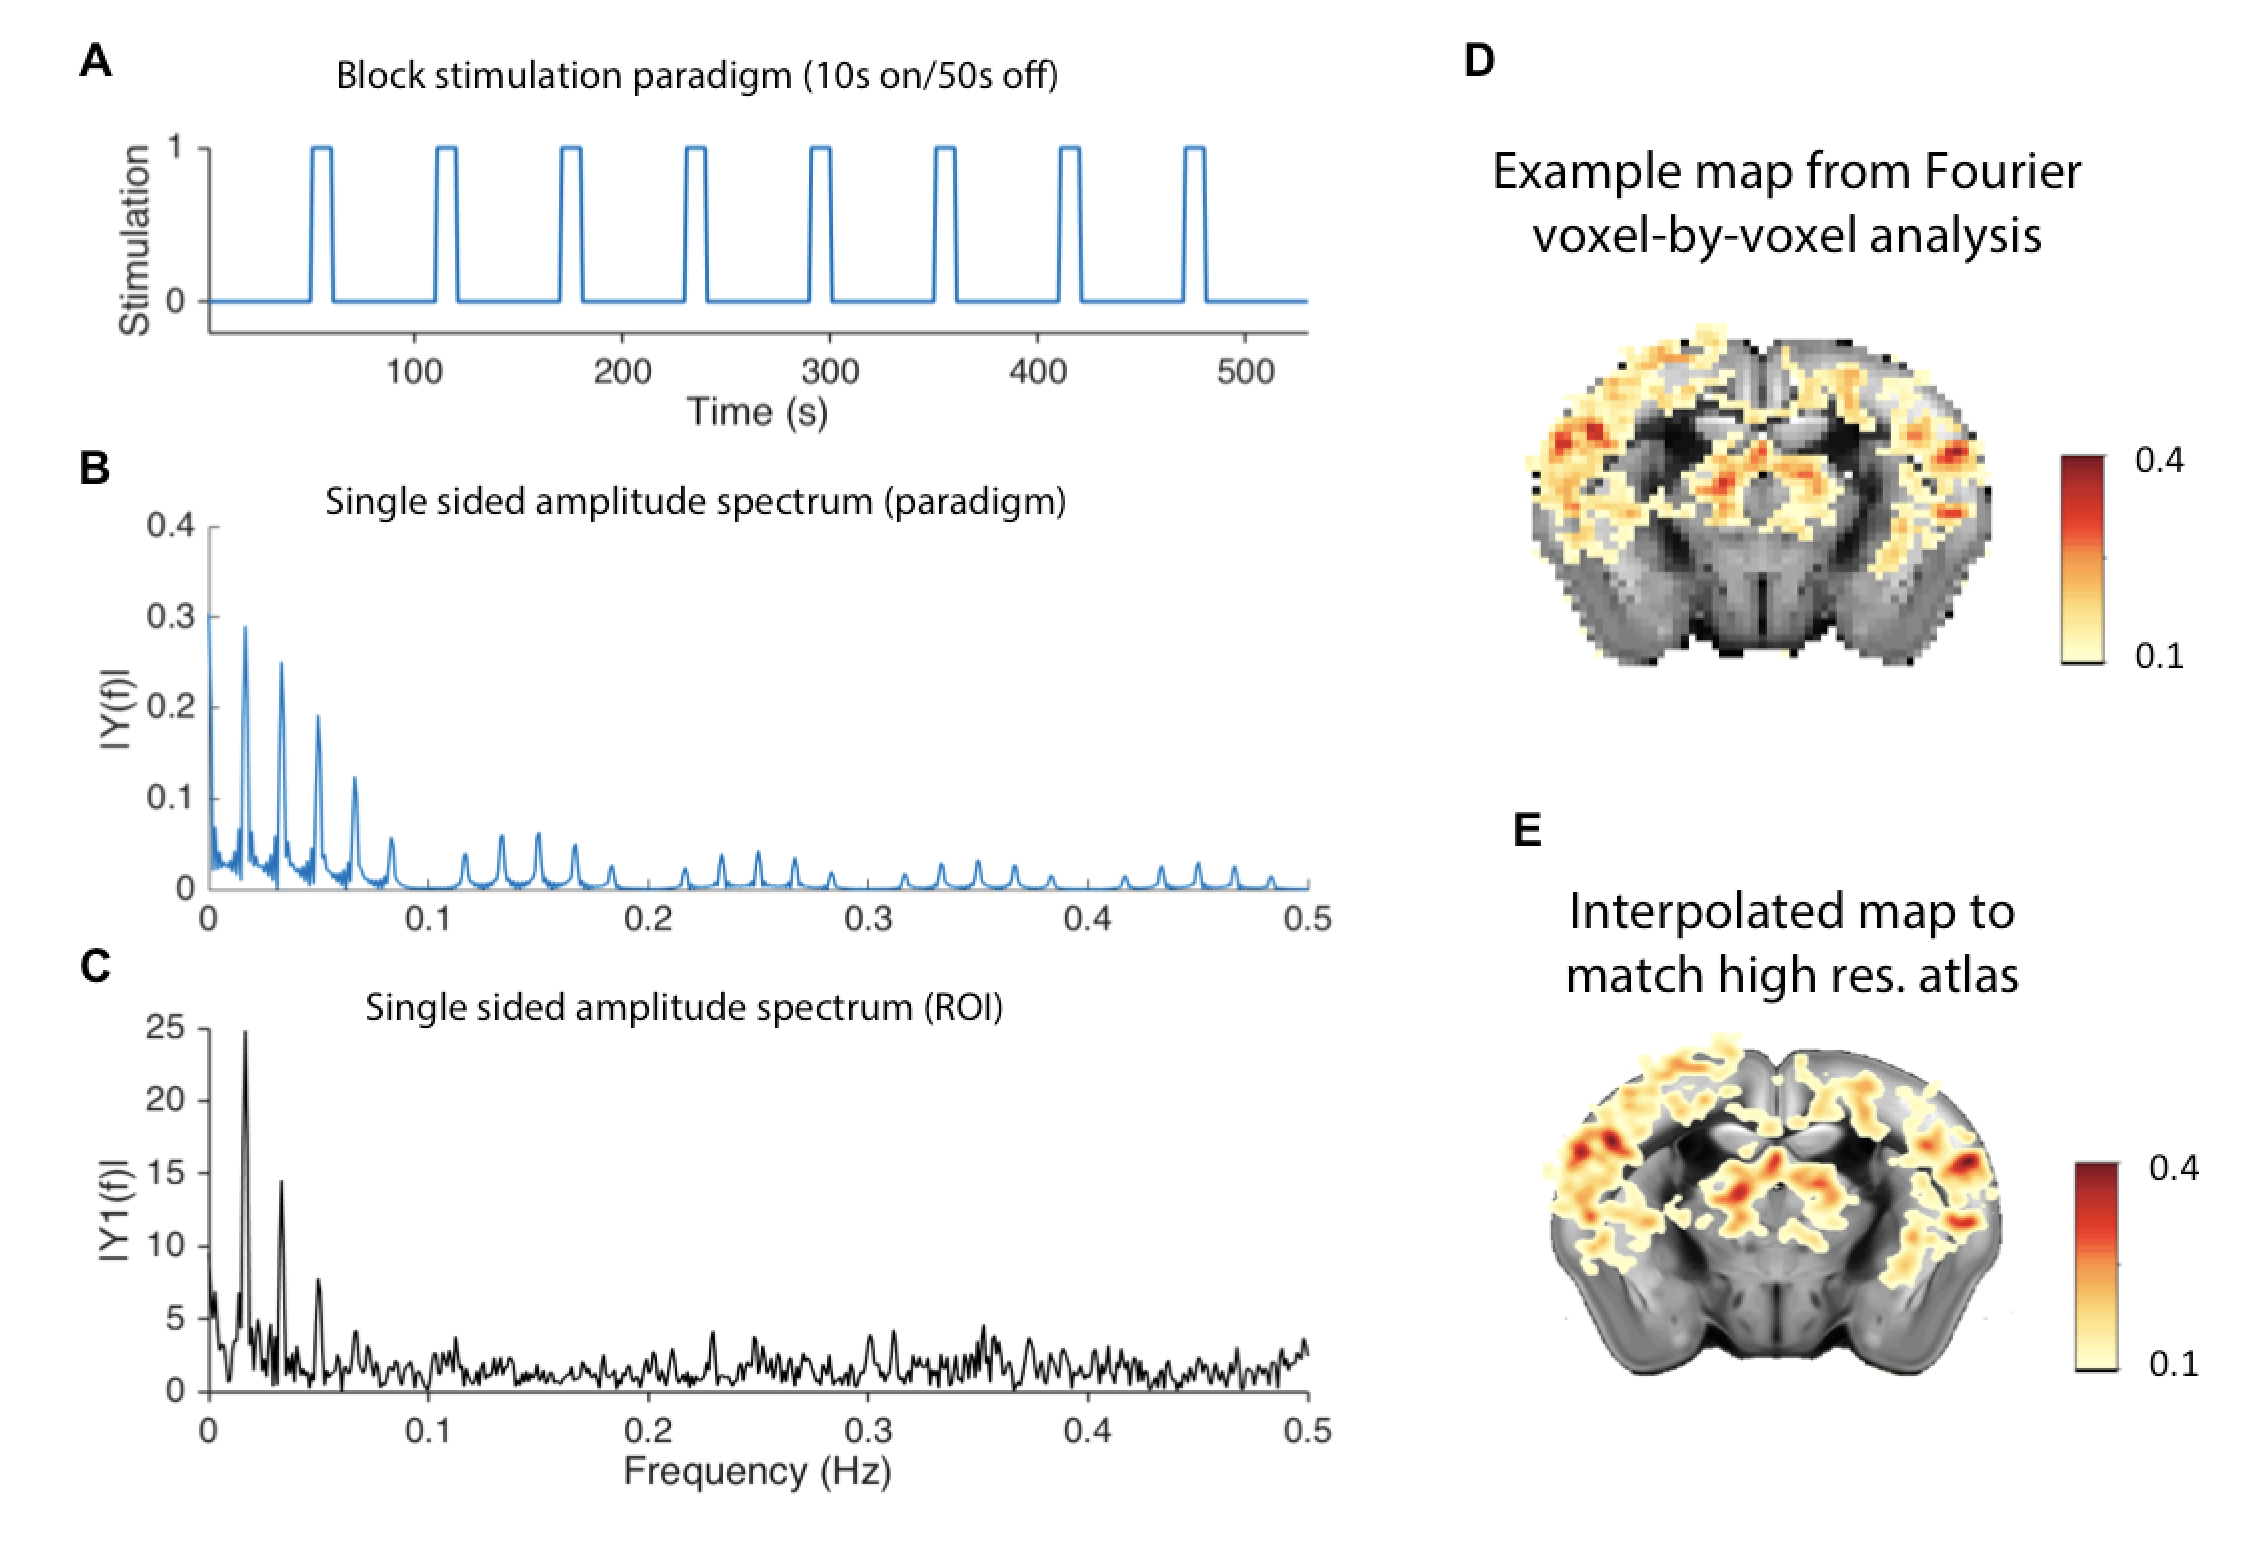
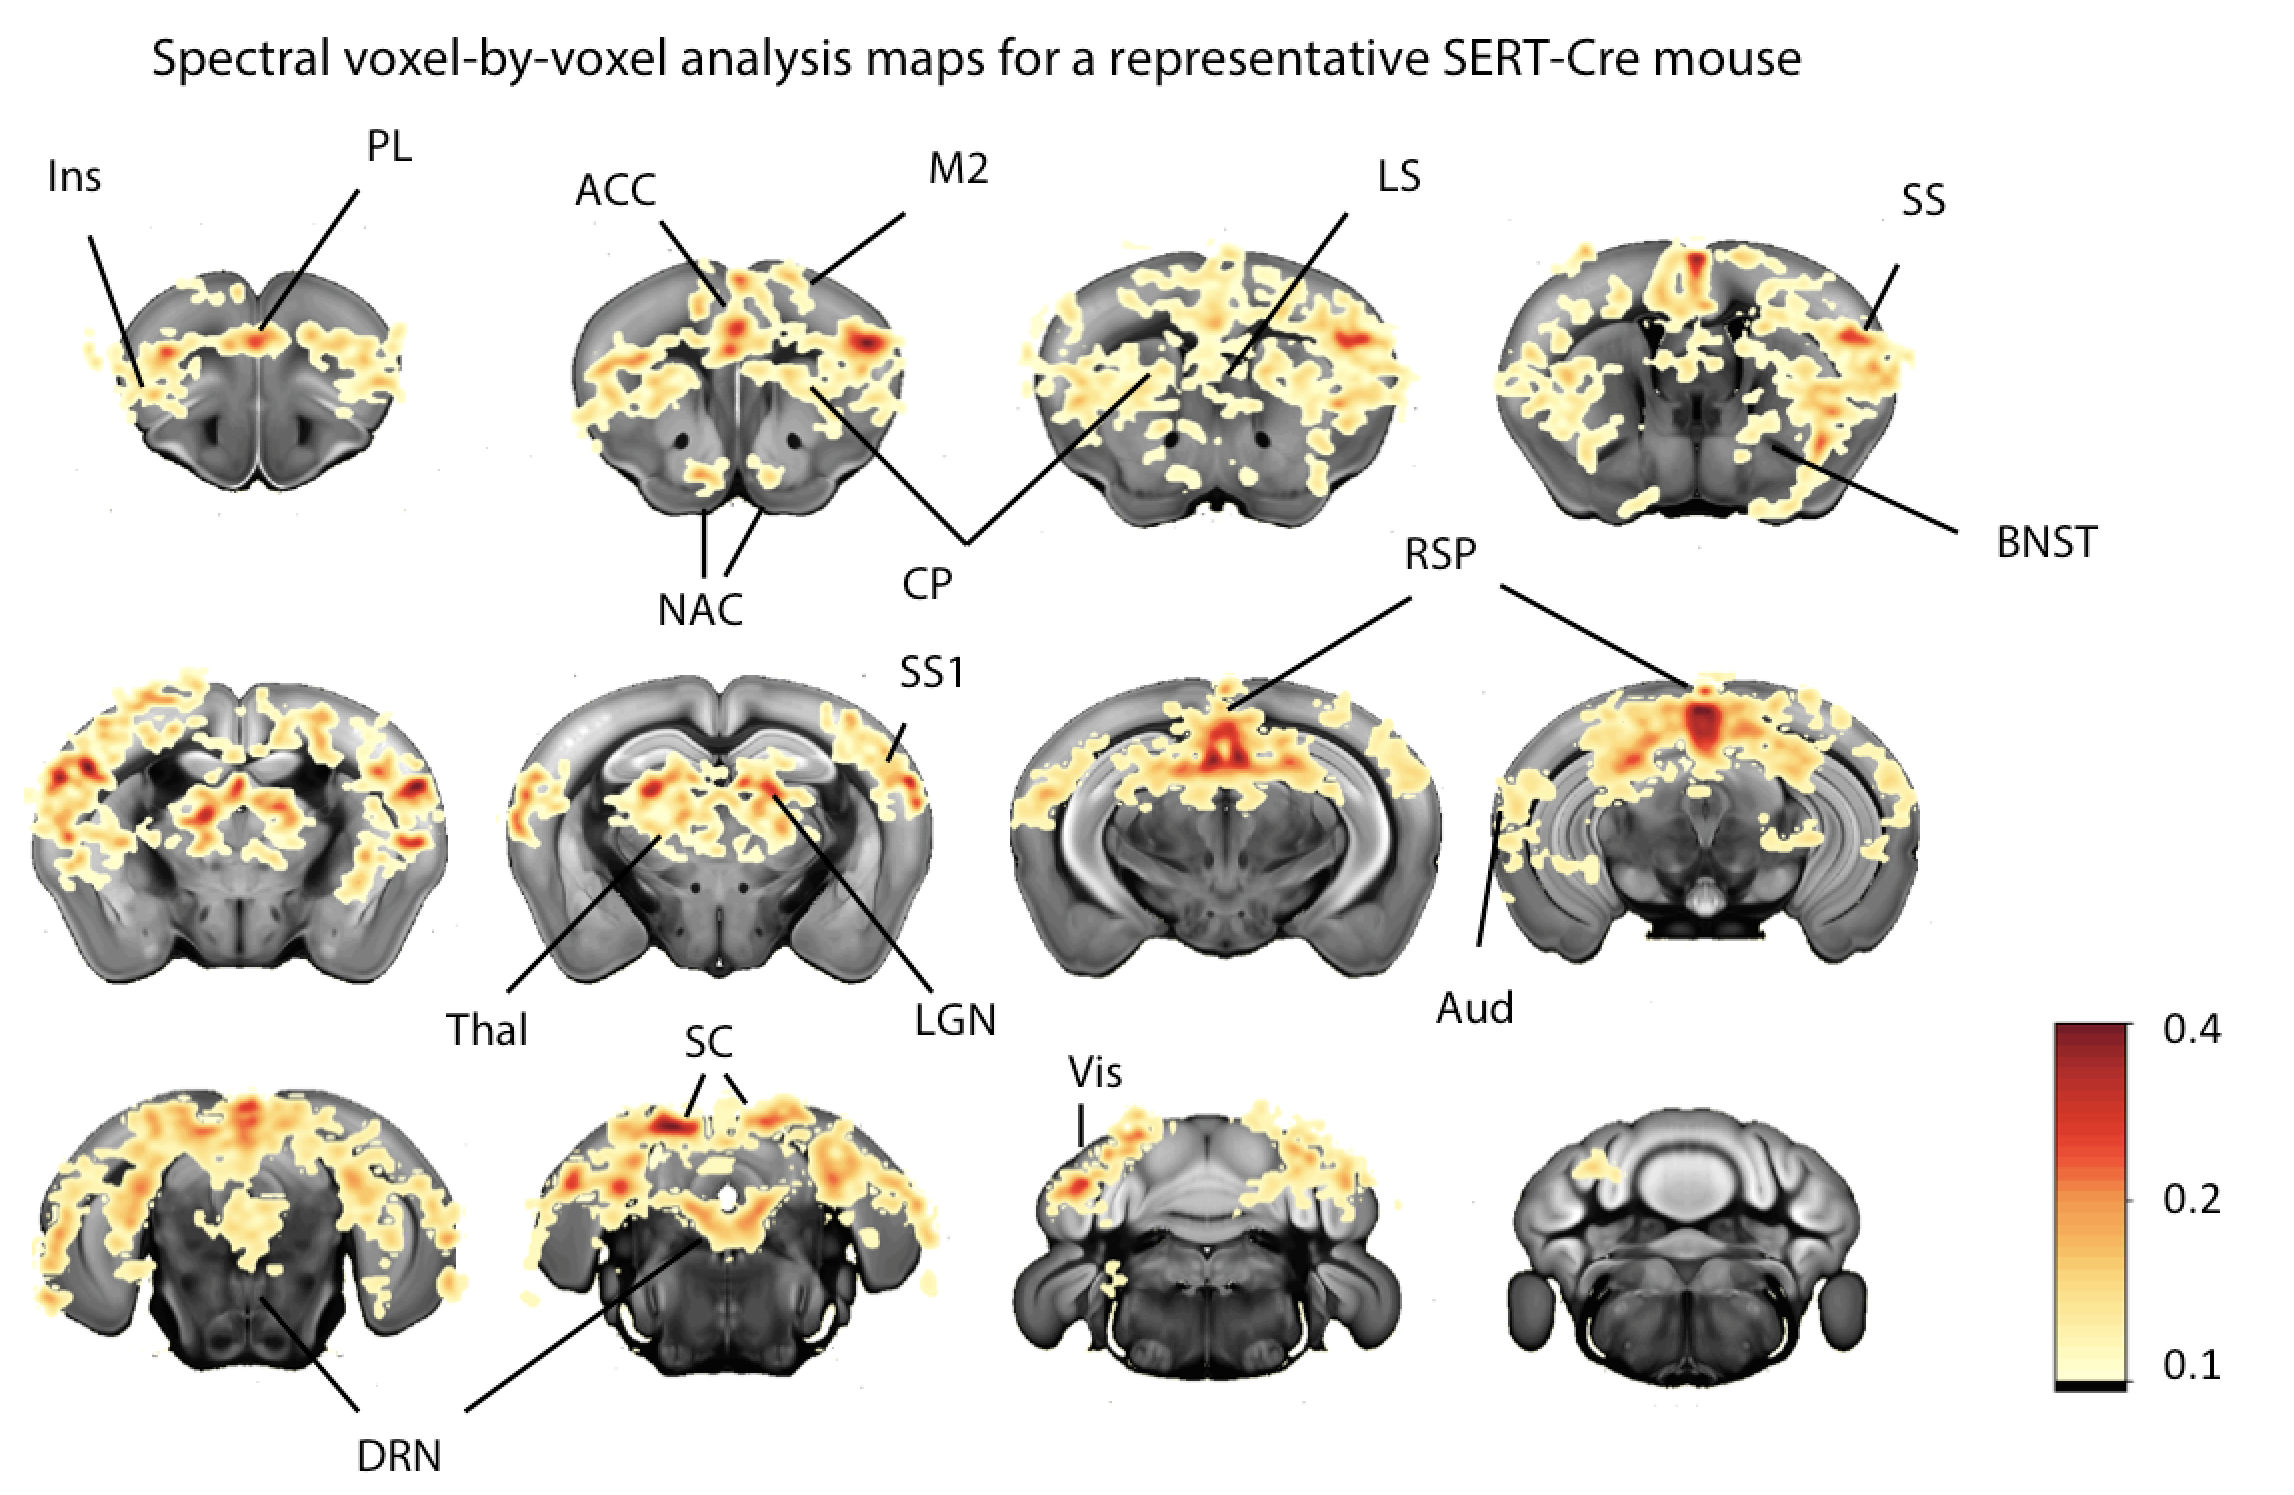
Fourier spectral analysis8,9 revealed frequency peaks at the stimulation frequency (0.016Hz) and its harmonics (Figure 2A-C). The voxel-by-voxel spectral analysis revealed clear region-specific BOLD modulations of a set of target regions (Figure 3).
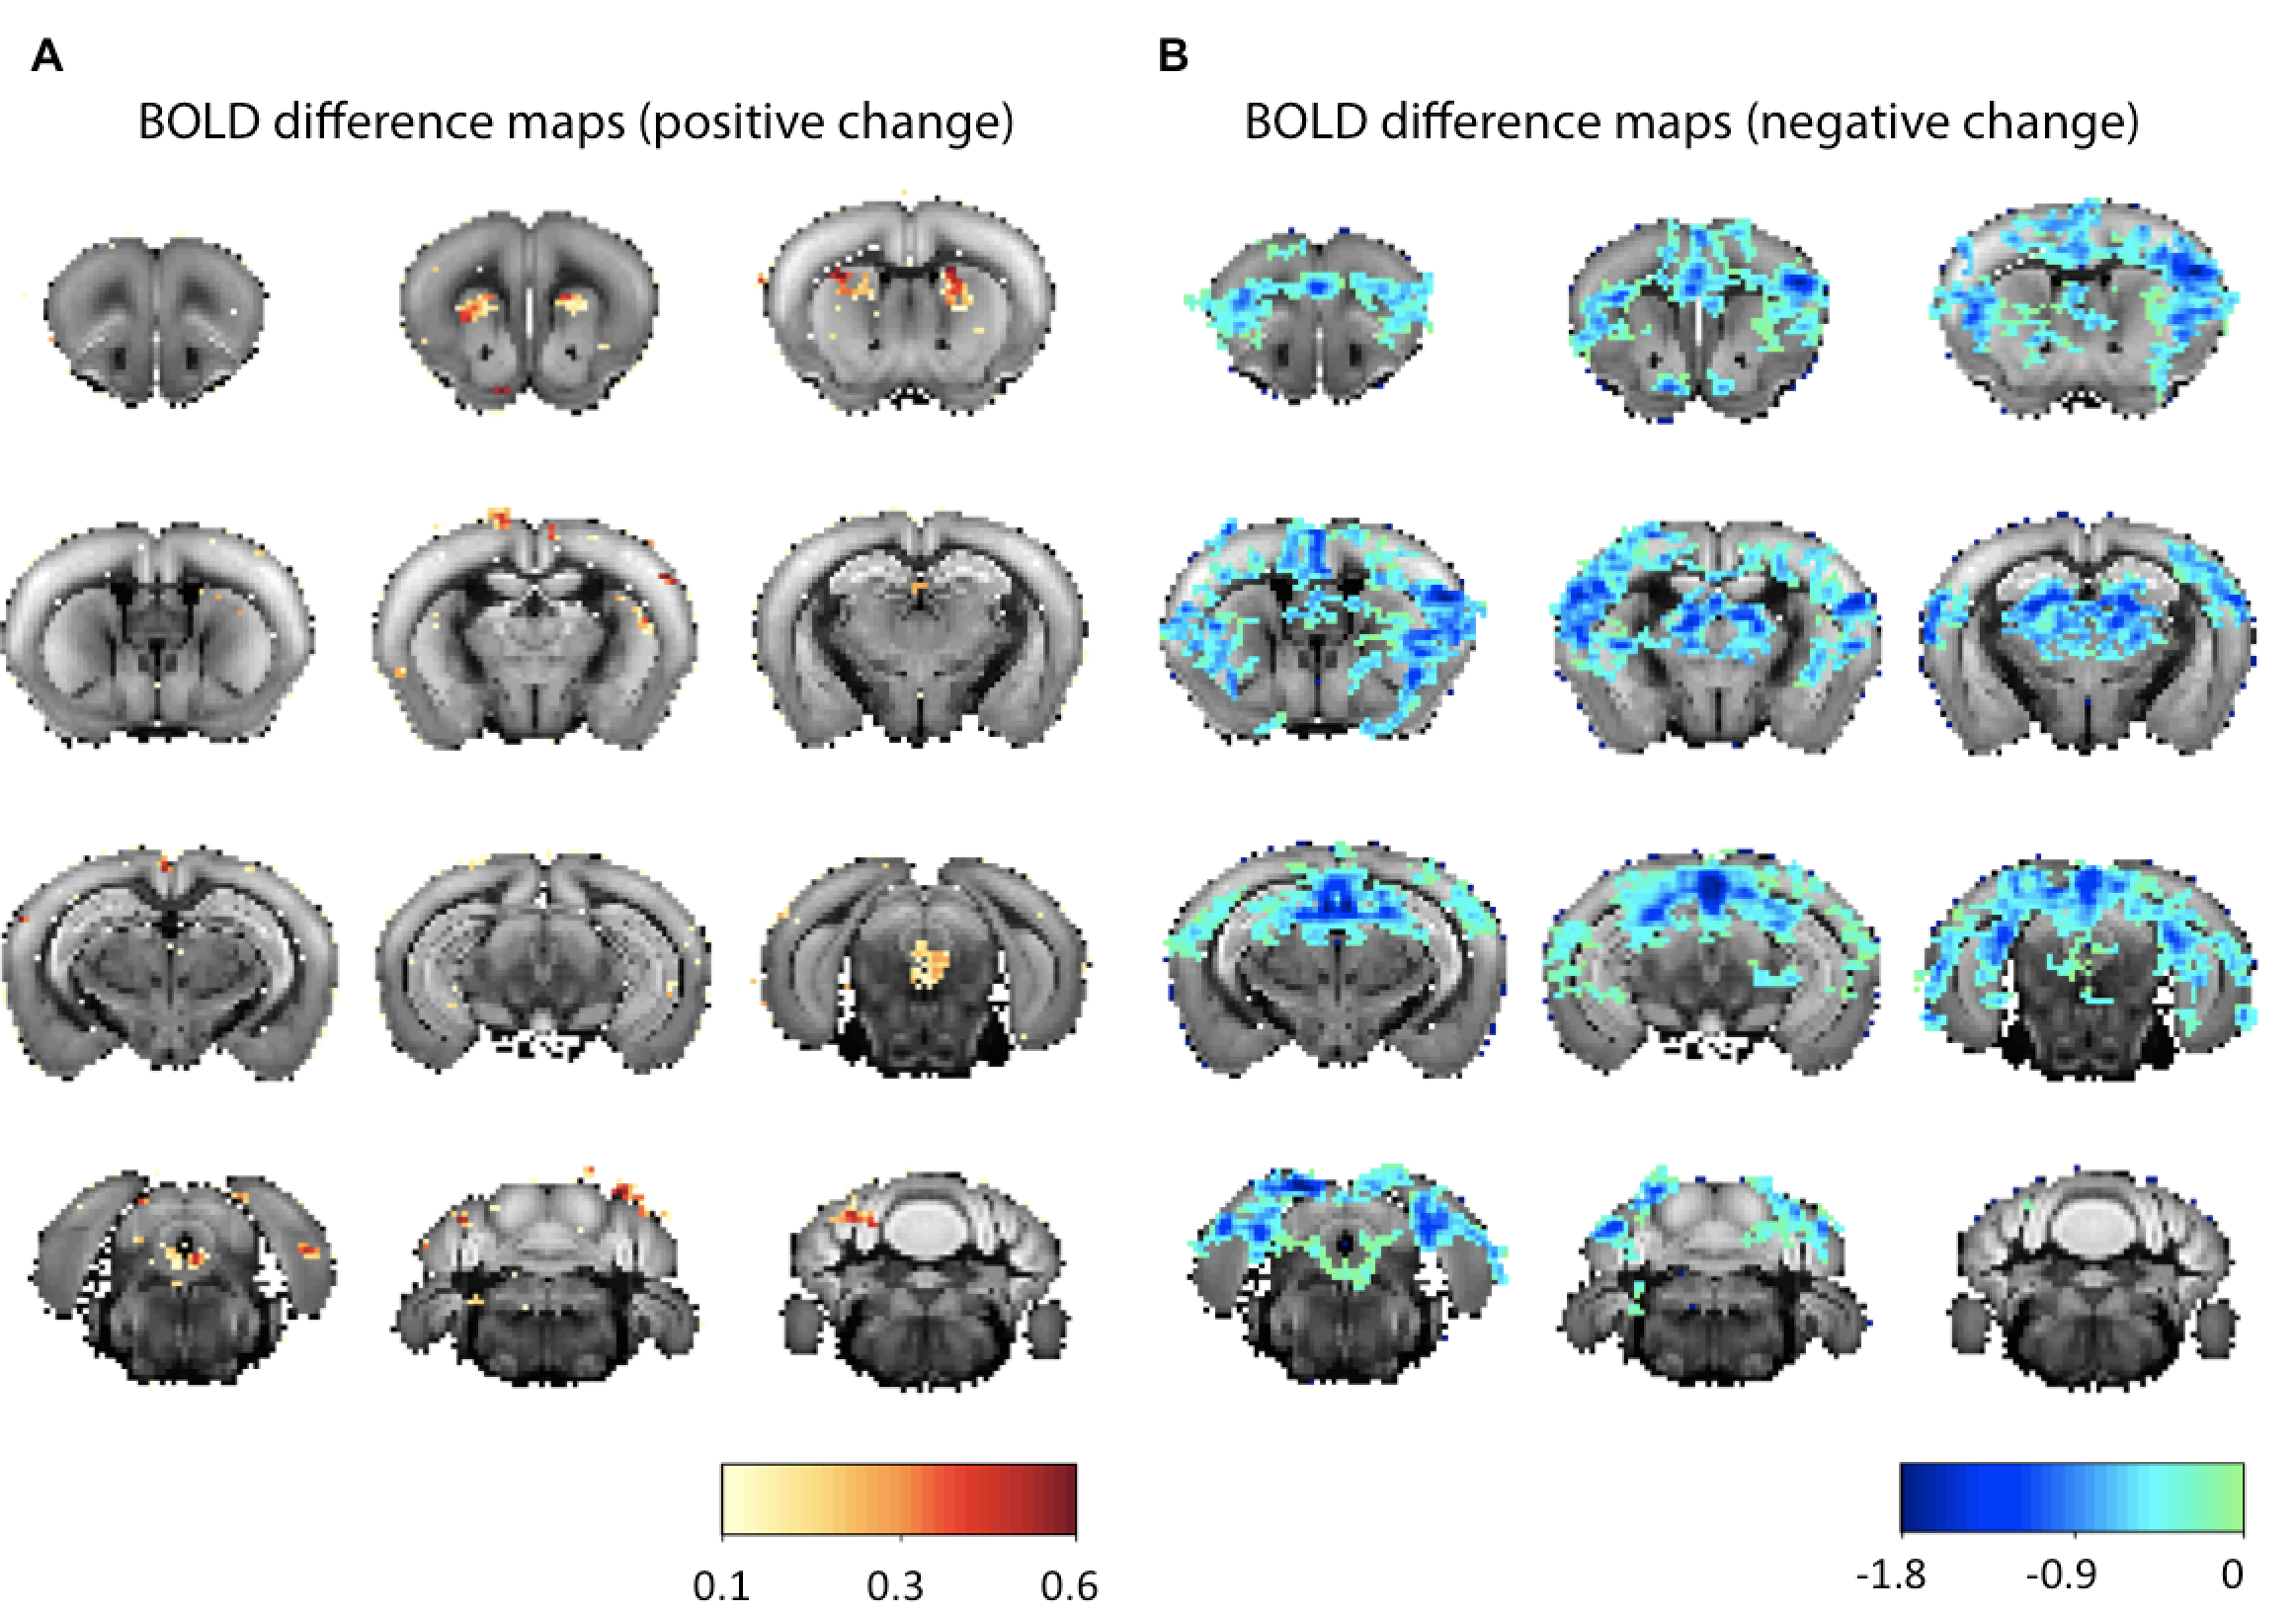
The sign of signal change depended on the specific region, with the caudoputamen and DRN showing increases in BOLD (Figure 4A), while other regions evidenced decreases in BOLD upon 5-HT stimulation (Figure 4B).
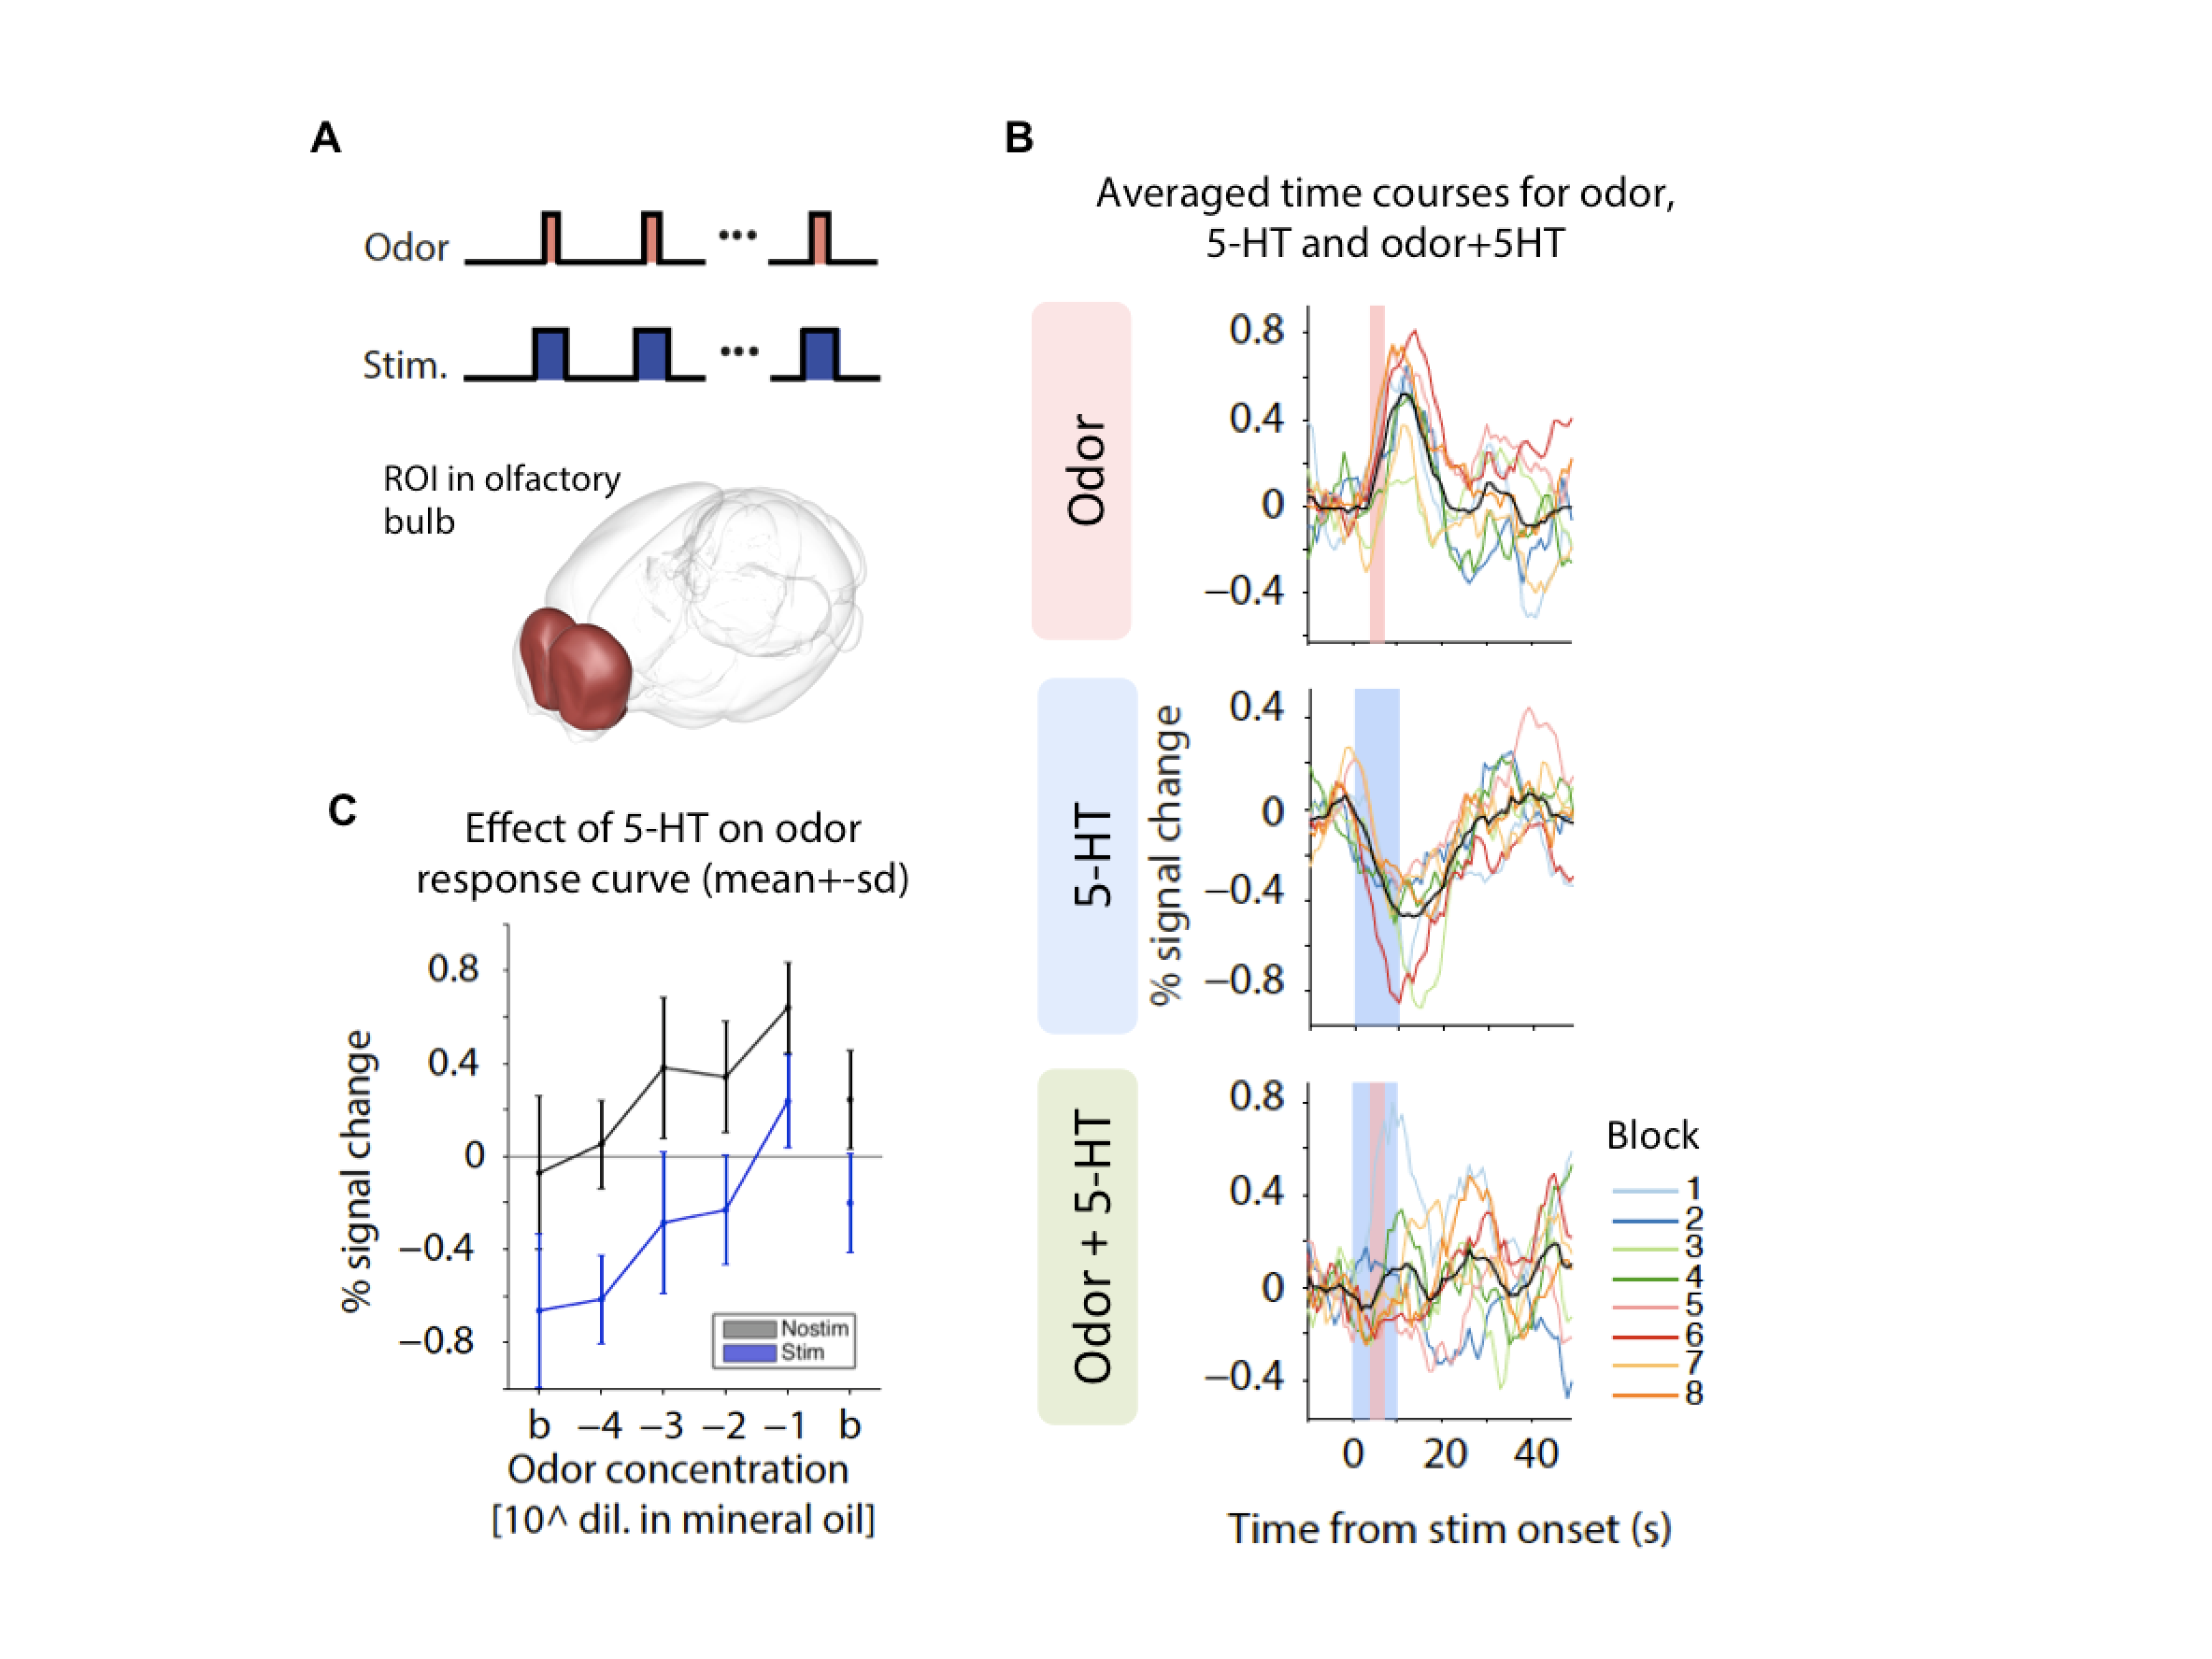
Figure 5 presents the second set of experiments designed to test how 5-HT modulates sensory-evoked responses. Odor stimuli led to increases in BOLD signals in olfactory areas such as olfactory bulb (Figure 5A); 5-HT stimulation alone showed a decrease in BOLD. When 5-HT and olfactory stimuli were concomitantly presented, the sensory responses were suppressed (Figure 5B). Interestingly, 5-HT shifted down the odor dose-response curve (Figure 5C), suggesting that it may be suppressing spontaneous firing rather than sensory-driven responses, consistent with electrophysiological data10. Similar effects were observed for coupling of 5-HT with visual stimuli (not shown).
Discussion and conclusions
We show robust region-specific BOLD responses upon DRN 5-HT photostimulation. The temporal cell-type precision of optogenetics has clear advantages compared with previous pharmacological-fMRI approaches, which are likely to induce complex compensatory effects. Furthermore, we leverage well-studied sensory-evoked responses to further study the effects of 5-HT on downstream ongoing activity. Our findings highlight the feasibility of using opto-fMRI to study the serotonergic system and open the interesting possibility of using 5-HT as a window into negative BOLD.Acknowledgements
This study was supported by funding from the European Research Council (ERC) under the European Union’s Horizon 2020 research and innovation programme (Starting Grant, agreement No. 679058 and Advanced Grant, ERC-2016-AdG-671251) and one of the authors was supported by FCT (SFRH/BD/52446/2013)References
1. Cools R, Roberts AC & Robbins TW. Serotoninergic regulation of emotionnal and behavioural control. Trends Cogn Sci. 2008;12(1): 31-40.
2. Boureau YL & Dayan P. Opponency revisited: competition and cooperation between dopamine and serotonin. Neuropsychopharmacology. 2011;36(1), 74-97.
3. Wong ML & Licinio J. Research and treatment approaches to depression. Nat Rev Neurosci. 2001;2(5):343-351.
4. Wong DT, Perry, KW & Bymaster FP. Case history: the discovery of fluoxetine hydrochloride (Prozac). Nat Rev Drug Discov. 2005;4(9):764-774
5. Gong S, et al. Targeting Cre recombinase to specific neuron populations with bacterial artificial chromosome constructs. J. Neurosci. 2007;27(37):9817–9823.
6. Fonseca MS, Murakami M, Mainen ZF. Activation of dorsal raphe serotonergic neurons promotes waiting but is not reinforcing. Current Biology. 2015;25(3):306–315.
7. Allen Mouse Common Coordinate Framework, version 3, 2015. https://scalablebrainatlas.incf.org/mouse/ABA_v3#about
8. Mitra PP, Pesaran B. Analysis of dynamic brain imaging data. Biophys J. 1999;76(2):691-708.
9. Nunes D, Ianus A, Shemesh N. Layer-specific connectivity revealed by diffusion-weighted functional MRI in the rat thalamocortical pathway. NeuroImage. 2019;184:656-657
10. Lottem E, Lorincz ML, Mainen ZF. Optogenetic Activation of Dorsal Raphe Serotonin Neurons Rapidly Inhibits Spontaneous But Not Odor-Evoked Activity in Olfactory Cortex. Journal of Neuroscience 2016;36(1):1–12.
Figures