1144
Comparison of Radiomics and Deep Learning for Differentiation of Spinal Metastases Coming from Lung Cancer and Other Primary CancersYang Zhang1, Ning Lang2, Enlong Zhang2, Jiahui Zhang2, Daniel Chow1, Peter Chang1, Hon J. Yu1, Huishu Yuan2, and Min-Ying Lydia Su1
1Department of Radiological Sciences, University of California, Irvine, CA, United States, 2Department of Radiology, Peking University Third Hospital, Beijing, China
Synopsis
For patients found to have spinal metastasis, a confirmed pathological diagnosis is needed to proceed with appropriate treatment. This study compared ROI analysis, radiomics, and deep learning for differentiation of primary cancer coming from 30 lung and 31 other tumors. Radiomics using GLCM texture and histogram parameters from the segmented 3D tumor achieved accuracy of 0.71, while the deep learning using recurrent CLSTM network with the entire 12 sets of DCE images reached an accuracy of 0.81. The wash-out slope in DCE kinetics measured from hot-spot was the best diagnostic parameter, which could be easily performed in a clinical setting.
Introduction
Patients presenting with pain in the spine are often suspected to have lesions compressing the spinal cord, and MRI is usually performed for diagnosis. The most common malignancy in the spine is metastatic cancer, and approximately 30% of patients present with an unknown primary [1-3]. In these patients, a final diagnosis is needed to proceed with treatment. In Western world with established health care systems, PET/CT is the most commonly used imaging for diagnosis of primary cancer and whole-body staging when the metastatic cancer in the spine is suspected. However, the patient may have to wait for insurance approval and delay the diagnosis. In the developing countries, PET/CT and the 18F-FDG tracer are limited and very expensive, and thus this exam may not be available to many patients. If other cheaper imaging examinations can be used to locate the primary tumor, it will provide a cost-effective management approach to help patients. Among all patients presenting with spinal pain with an unknown primary cancer site, lung metastasis is the most prevalent [3]. If this primary can be accurately predicted, subsequent workup can be focused to pulmonary imaging, e.g. using CT, which is easily accessible and much cheaper. In a previous study we performed the hot spot ROI-based analysis and deep learning using convolutional neural network to differentiate metastases from lung cancer and other primary cancers [4]. The purpose of this study is to apply quantitative radiomics analysis to differentiate the two groups and compare the diagnostic performance with that of ROI and deep learning analysis.Methods
In a retrospective review of spinal clinical MRI database in our hospital that included a DCE sequence, a total of 61 patients were identified, including 30 patients confirmed with lung cancer (16 males, 14 females, mean age 56) and 31 other cancers (16 males, 15 females, mean age 57). MR scans were performed on a 3T Siemens or 3T GE scanner with a consistent protocol. DCE-MRI was performed using the three-dimensional (3D) volume interpolated breath-hold examination (3D VIBE) sequence on Siemens, or the LAVA (Liver Acceleration Volume Acquisition) on GE. Approximately 30 slices with 3-mm thickness were prescribed to cover the abnormal vertebrae. The temporal resolution varied from 10 to 14 seconds. MRI and DCE kinetics of one lung cancer is shown in Figure 1, and that of one thyroid cancer is shown in Figure 2. DCE pre- and post-contrast images are shown in Figure 3. The abnormal area on sagittal T2W images was first manually outlined by a radiologist and then transformed to the axial view DCE-MRI for tumor segmentation, using a normalized cut algorithm with region growing [5]. Radiomics analysis was performed to extract DCE kinetic parameters and texture features on three computed DCE parametric maps, including the steepest wash-in SE map, maximum SE map, and wash-out slope map, illustrated in Figure 4. On each map, 20 gray-level co-occurrence matrix (GLCM) texture features by Haralick et al. [6], and 13 histogram parameters, including the 10%, 20%… 80% to 90% percentile values, mean, standard deviation, kurtosis and skewness, were obtained. A total of 99 quantitative features were obtained for each patient. A random forest algorithm was used to select 3-5 features to form the diagnostic classifier [7]. After a final diagnostic classifier was obtained, the accuracy was evaluated in the entire dataset of 61 cases.Results
In the color maps shown in Figure 4, almost all voxels in the entire thyroid cancer show the wash-out pattern, but the voxels in the lung cancer are more heterogeneous with most of them showing the plateau pattern. By increasing the number of features from 3 to 4 to 5, the accuracy only improved slightly. The diagnostic accuracy and the selected histogram and texture features are listed in Table 1. The accuracy obtained using the texture features only (0.59-0.62) was lower compared to using histogram only (0.67-0.68), or histogram+texture (0.68-0.71). For hot-spot ROI-based analysis using steepest wash-in signal enhancement (SE) ratio, maximum SE ratio and the wash-out slope, the classification accuracy obtained using logistic regression was 0.74, and that by using Chi-square Automatic Interaction Detector (CHAID) with the wash-out slope of -6.6% followed by maximum SE of 98% was 0.79. Deep learning using three generated DCE parametric maps as inputs in a conventional convolutional neural network (CNN) was 0.61-0.74, mean 0.71 +/- 0.043. The accuracy achieved using all 12 sets of DCE images as inputs in a recurrent neural network, convolutional long short term memory (CLSTM), was 0.75-0.84, mean 0.81 +/- 0.034.Discussion
In this study, we analyzed quantitative radiomics features on three DCE parametric maps generated corresponding to the hot spot analysis: the wash-in SE map, maximum SE map, and wash-out slope map. We used random forest algorithm for feature selection, not for the final classification, similar to the approach used in Gallego-Ortiz et al. [8]. The accuracy in the combined histogram+texture analysis was 0.68 by using 3 features and 0.71 by using 5 features, which was inferior to that of hot-spot analysis. The results also show that the texture (i.e. heterogeneity within the tumor) did not add much value for improving differential diagnosis. When the three DCE parametric maps were used as inputs in deep learning with CNN, the accuracy was comparable to that of radiomics; but when all 12 sets of images acquired in the DCE sequence were used as inputs in deep learning with CLSTM, the accuracy was much higher. The results also suggest that a simple hot-spot analysis in DCE-MRI can differentiate lung mets from other cancers in the spine with a high accuracy, which can be easily performed in a clinical setting, the same approach used in DCE-MRI for diagnosis of breast lesions.Acknowledgements
This study is supported in part by NIH R01 CA127927, the National Natural Science Foundation of China (81701648, 81471634), and the Beijing Natural Science Foundation (7164309).References
[1] Sciubba et al (2010) Diagnosis and management of metastatic spine disease. J Neurosurg Spine 13(1):94–108. [2] Robson P (2014) Metastatic spinal cord compression: a rare but important complication of cancer. Clin Med (Lond) 14(5):542-545. [3] Piccioli et al (2015) Bone metastases of unknown origin: epidemiology and principles of management. J Orthop Traumatol 16(2):81-86. [4] Lang et al. Differentiation of Pulmonary From Non-Pulmonary Spine Metastases Using Conventional DCE Kinetic Analysis and Machine Learning. Presented at Joint Annual Meeting ISMRM-ESMRMB, Paris, France, June 16-21, 2018; Program Number: 5168. [5] Huang et al (2009) Learning-based vertebra detection and iterative normalized-cut segmentation for spinal MRI. IEEE Trans Med Imaging 28(10):1595-1605. [6] Haralick RM, Shanmugam K (1973) Textural features for image classification. IEEE Transactions on systems, man, and cybernetics (6):610-621. [7] Breiman L (2001) Random Forests. Machine Learning 45(1):5-32. [8] Gallego-Ortiz C, Martel AL (2016) Improving the Accuracy of Computer-aided Diagnosis for Breast MR Imaging by Differentiating between Mass and Nonmass Lesions. Radiology 278(3):679-688.Figures
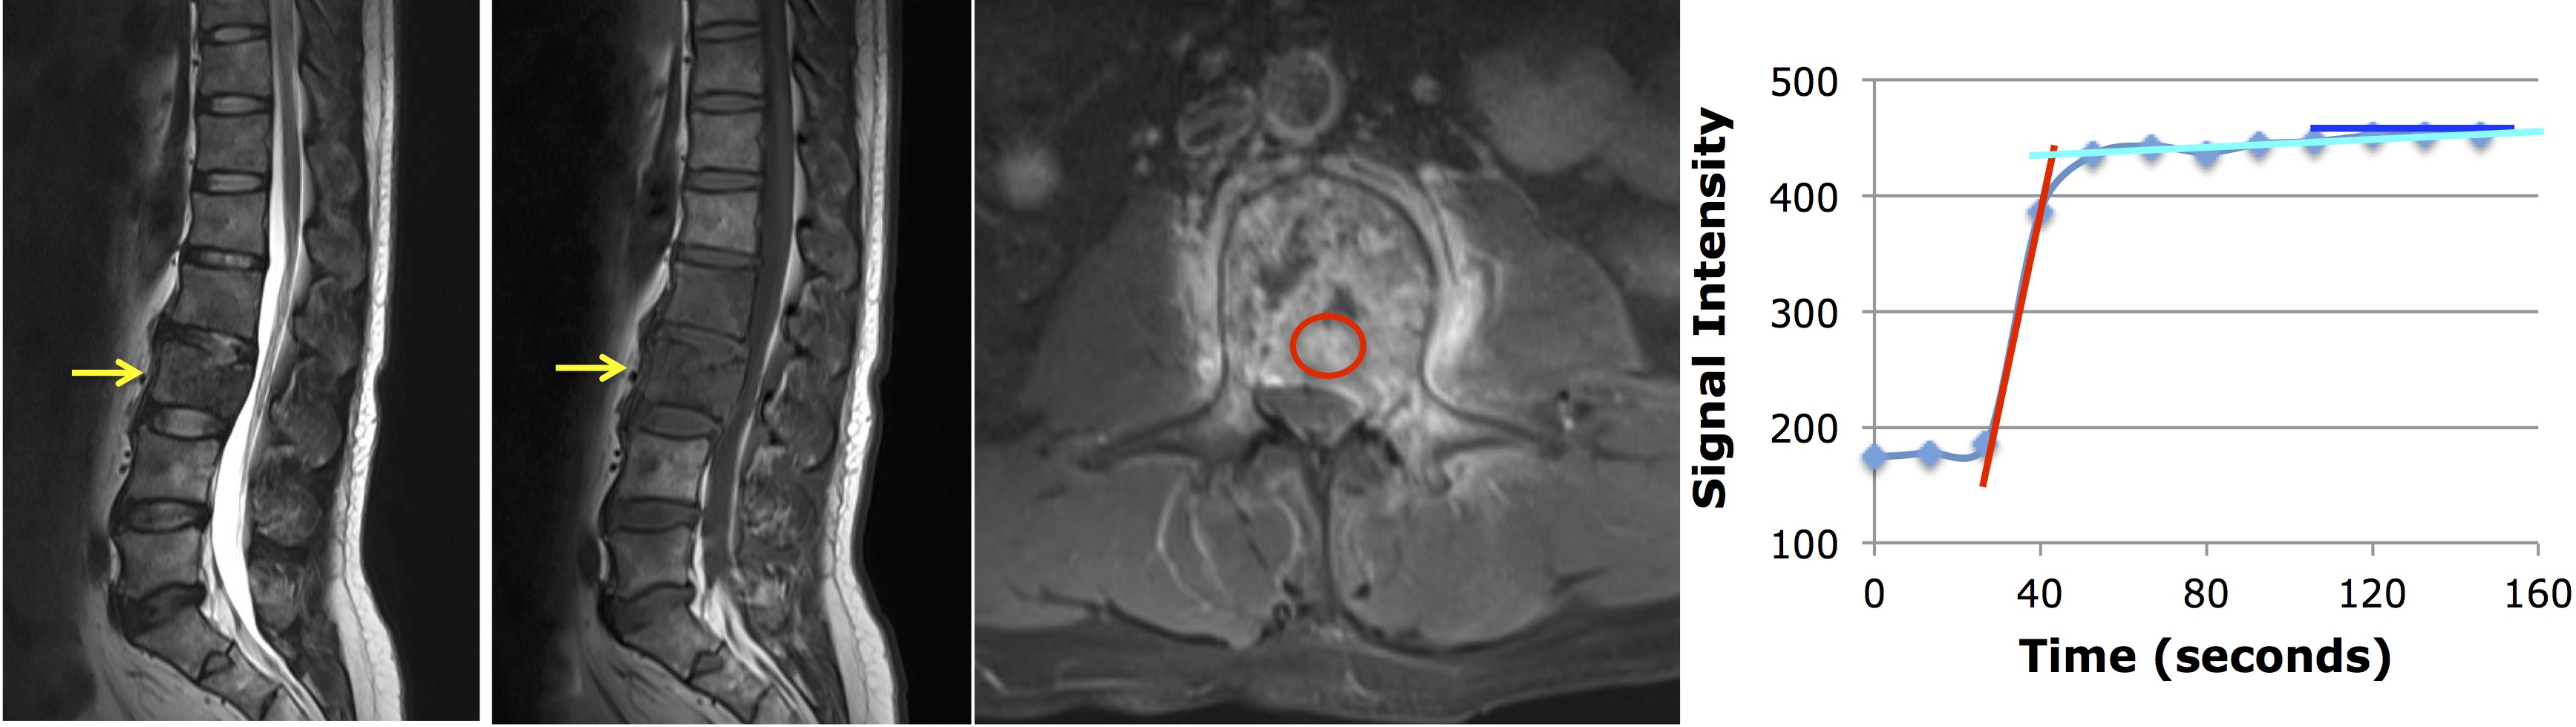
Figure 1: A
45-year-old man with metastatic lung cancer, showing the plateau DCE kinetic
pattern. From left to right: the sagittal T2-weighted, T1-weighted, axial
contrast-enhanced images, and the signal intensity time course measured from a
region of interest (ROI) manually placed on the strongest enhancement area. The
DCE kinetics measured from the hot-spot ROI shows a plateau pattern. The
steepest wash-in signal enhancement (SE) ratio calculated as (S2-S1)/S0,
maximum SE ratio (Smax-S0)/S0, and wash-out slope (Slast-S67s)/S67s are measured.
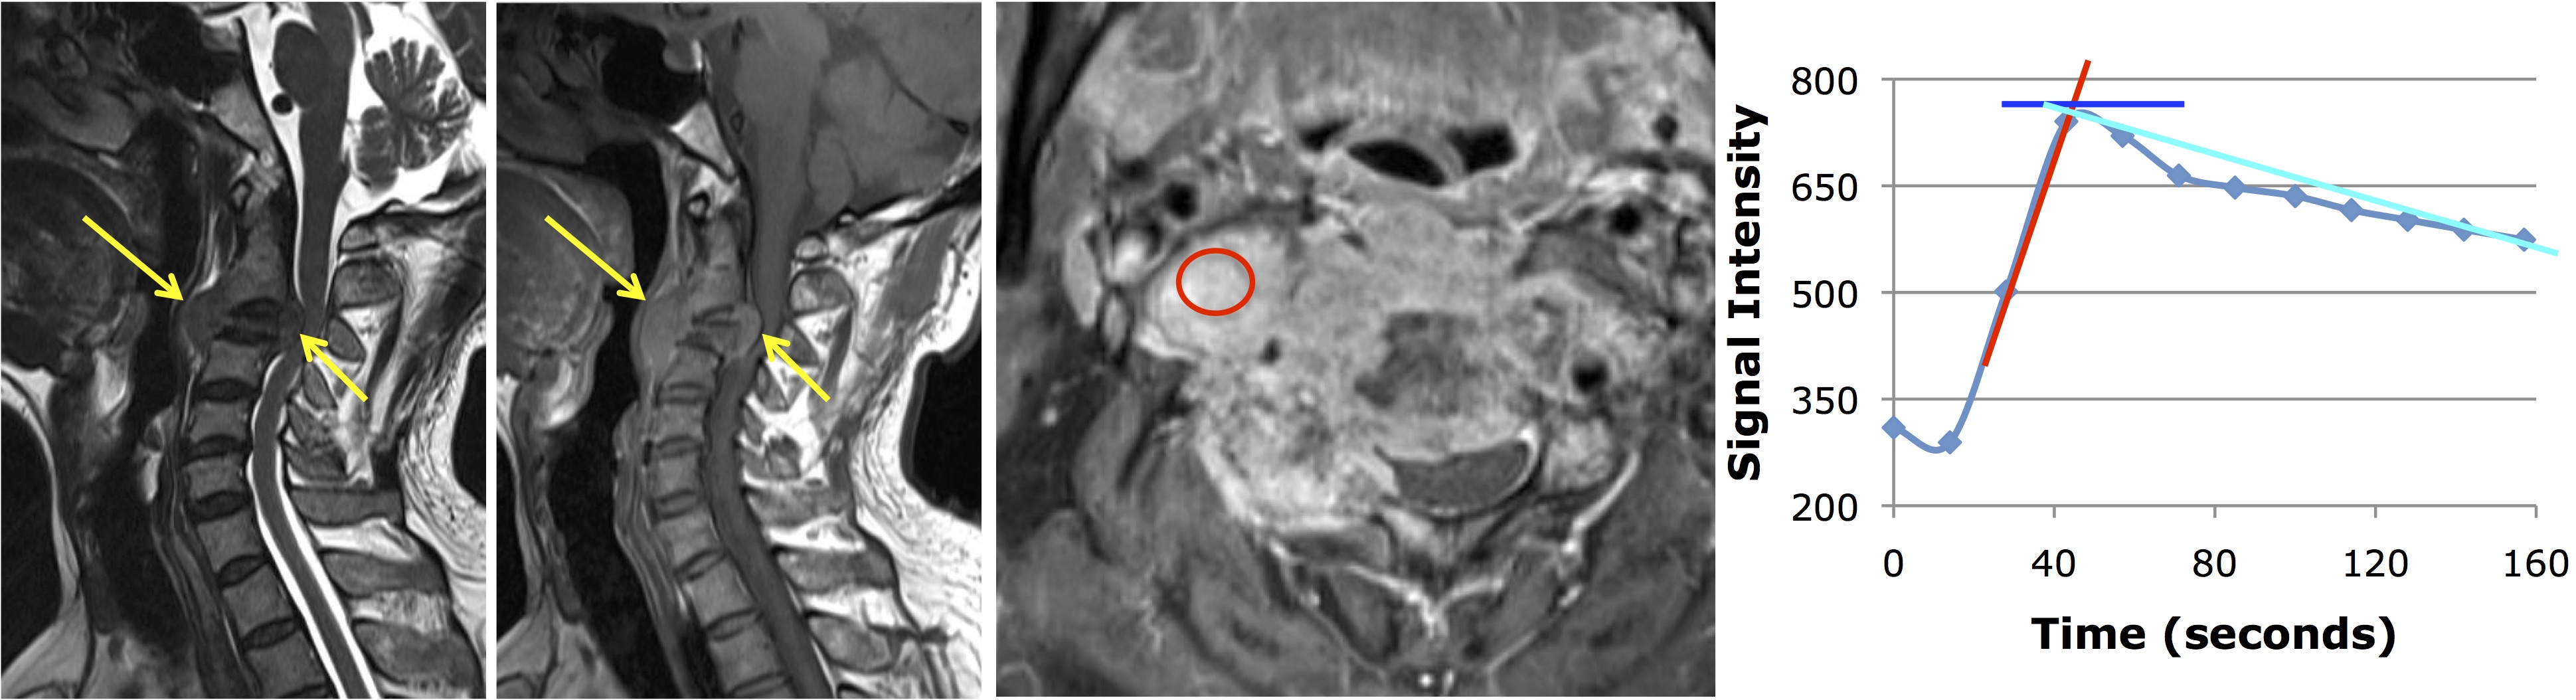
Figure 2: A
55-year-old man with metastatic thyroid cancer, showing the wash-out DCE
kinetic pattern. From left to right: the sagittal T2-weighted, T1-weighted,
axial contrast-enhanced images, and the signal intensity time course measured
from a region of interest (ROI) manually placed on the strongest enhancement
area. The DCE kinetics measured from the hot-spot ROI shows a wash-out pattern.
The steepest wash-in signal enhancement (SE) ratio calculated as (S2-S1)/S0,
maximum SE ratio (Smax-S0)/S0, and wash-out slope (Slast-Speak)/Speak are
measured.
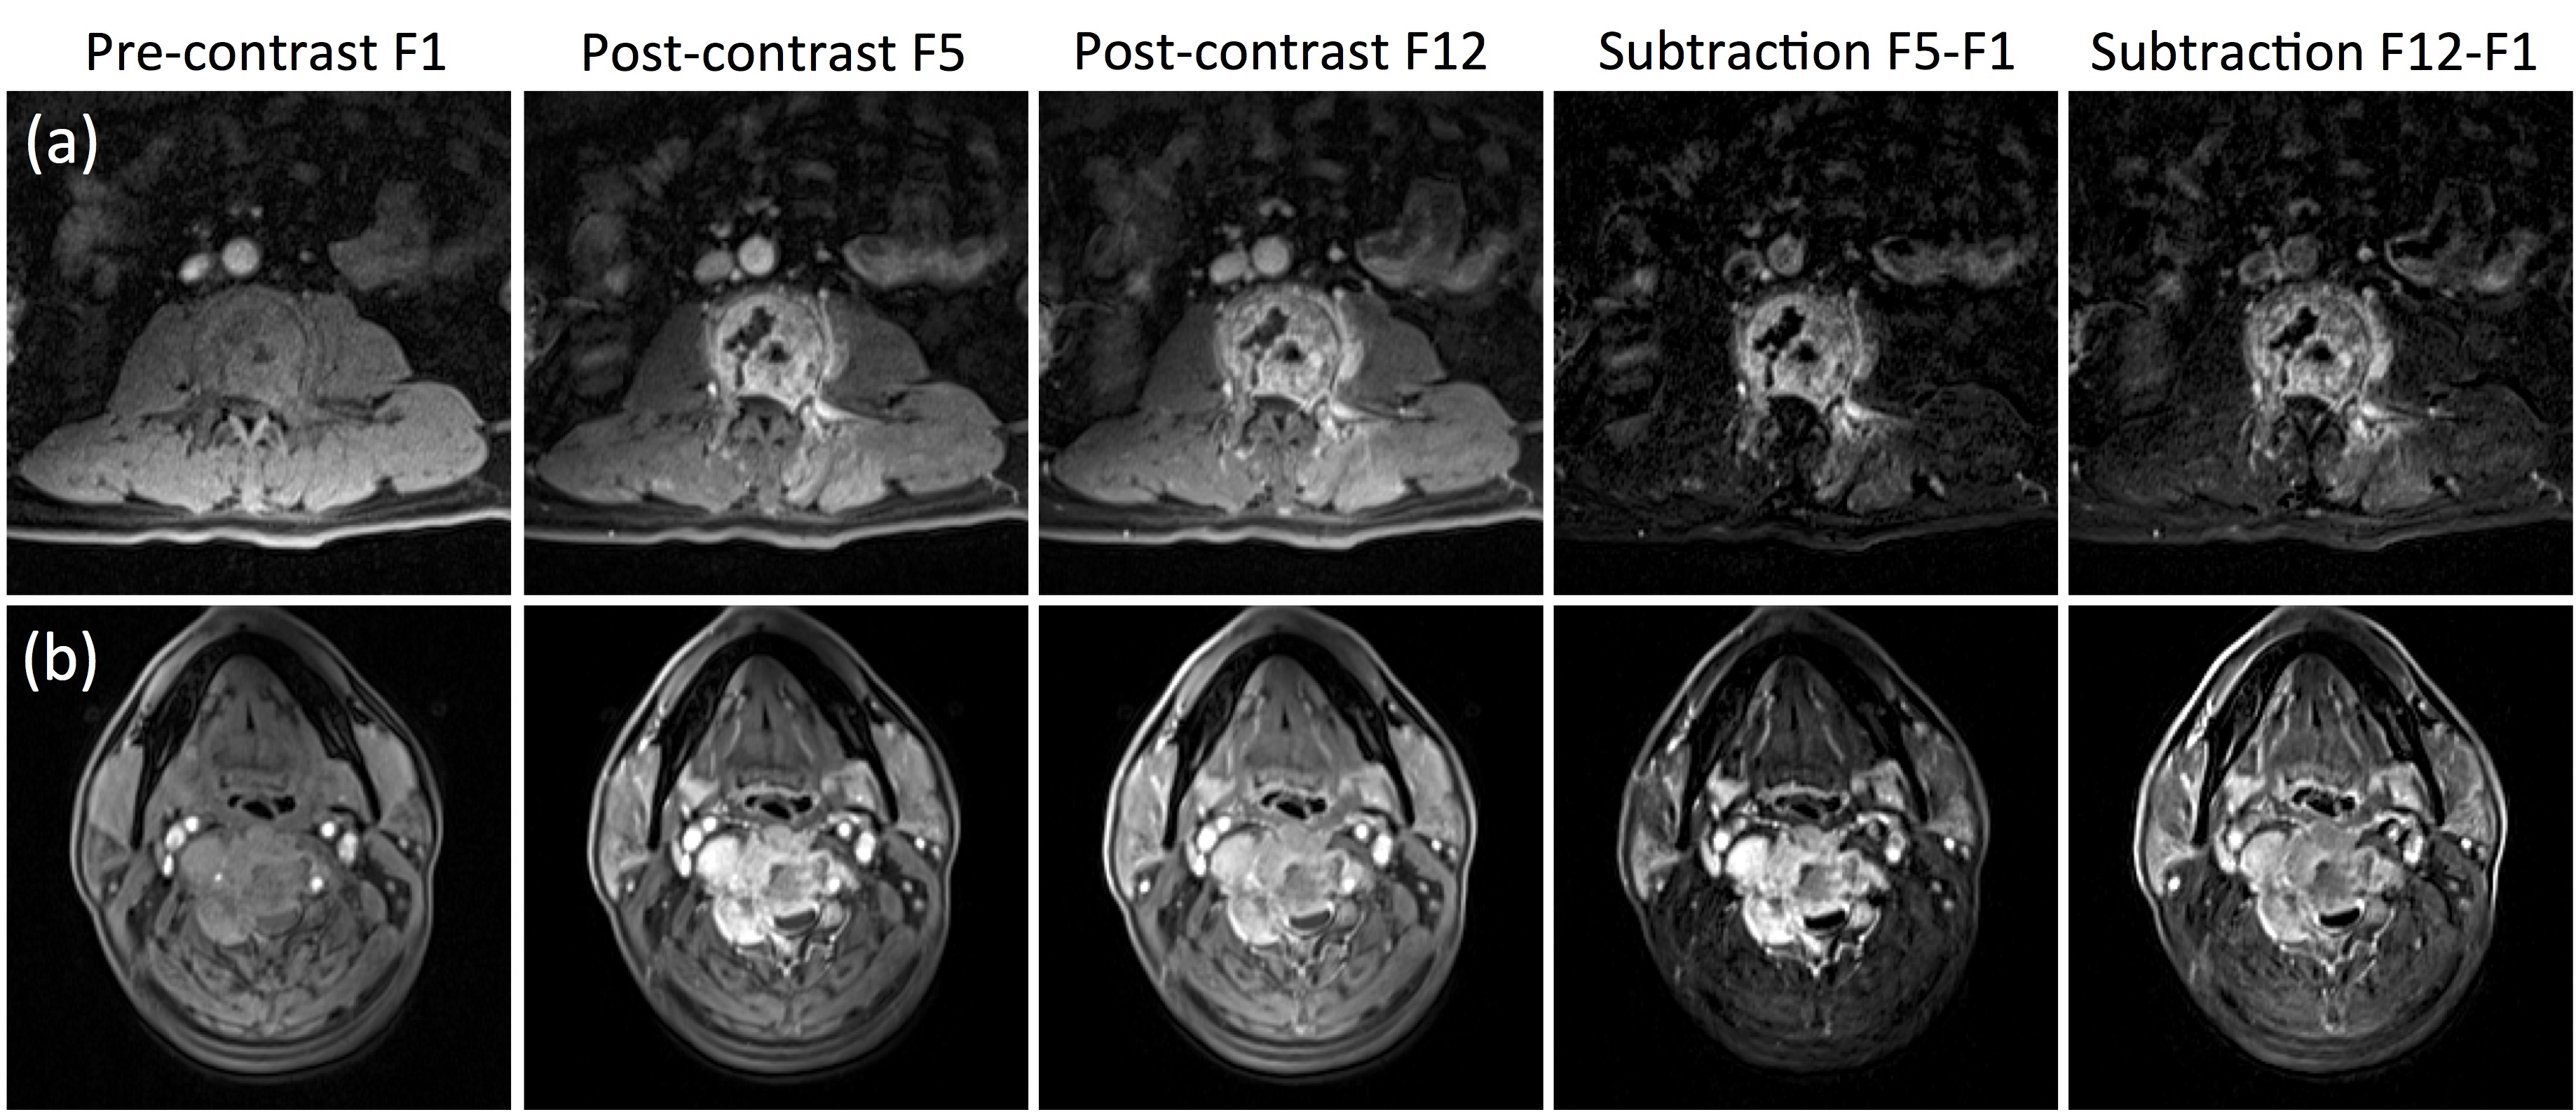
Figure 3: The
DCE-MRI of two cases shown in Figures 1 and 2. From left to right: the
pre-contrast image acquired in Frame-1, the post-contrast images acquired in
Frame-5 (50-60 seconds after injection) and the last Frame-12 (140-150 seconds
after injection), and the subtraction images (F5-F1) and (F12-F1). Top panel:
(a) The metastatic lung cancer showing similar enhancements in F5 and F12 and similar
subtraction images without a clear wash-out. Bottom panel: (b) The metastatic
thyroid cancer showing a stronger enhancement in F5 than in F12, and the
subtraction images also clearly demonstrate contrast wash-out.
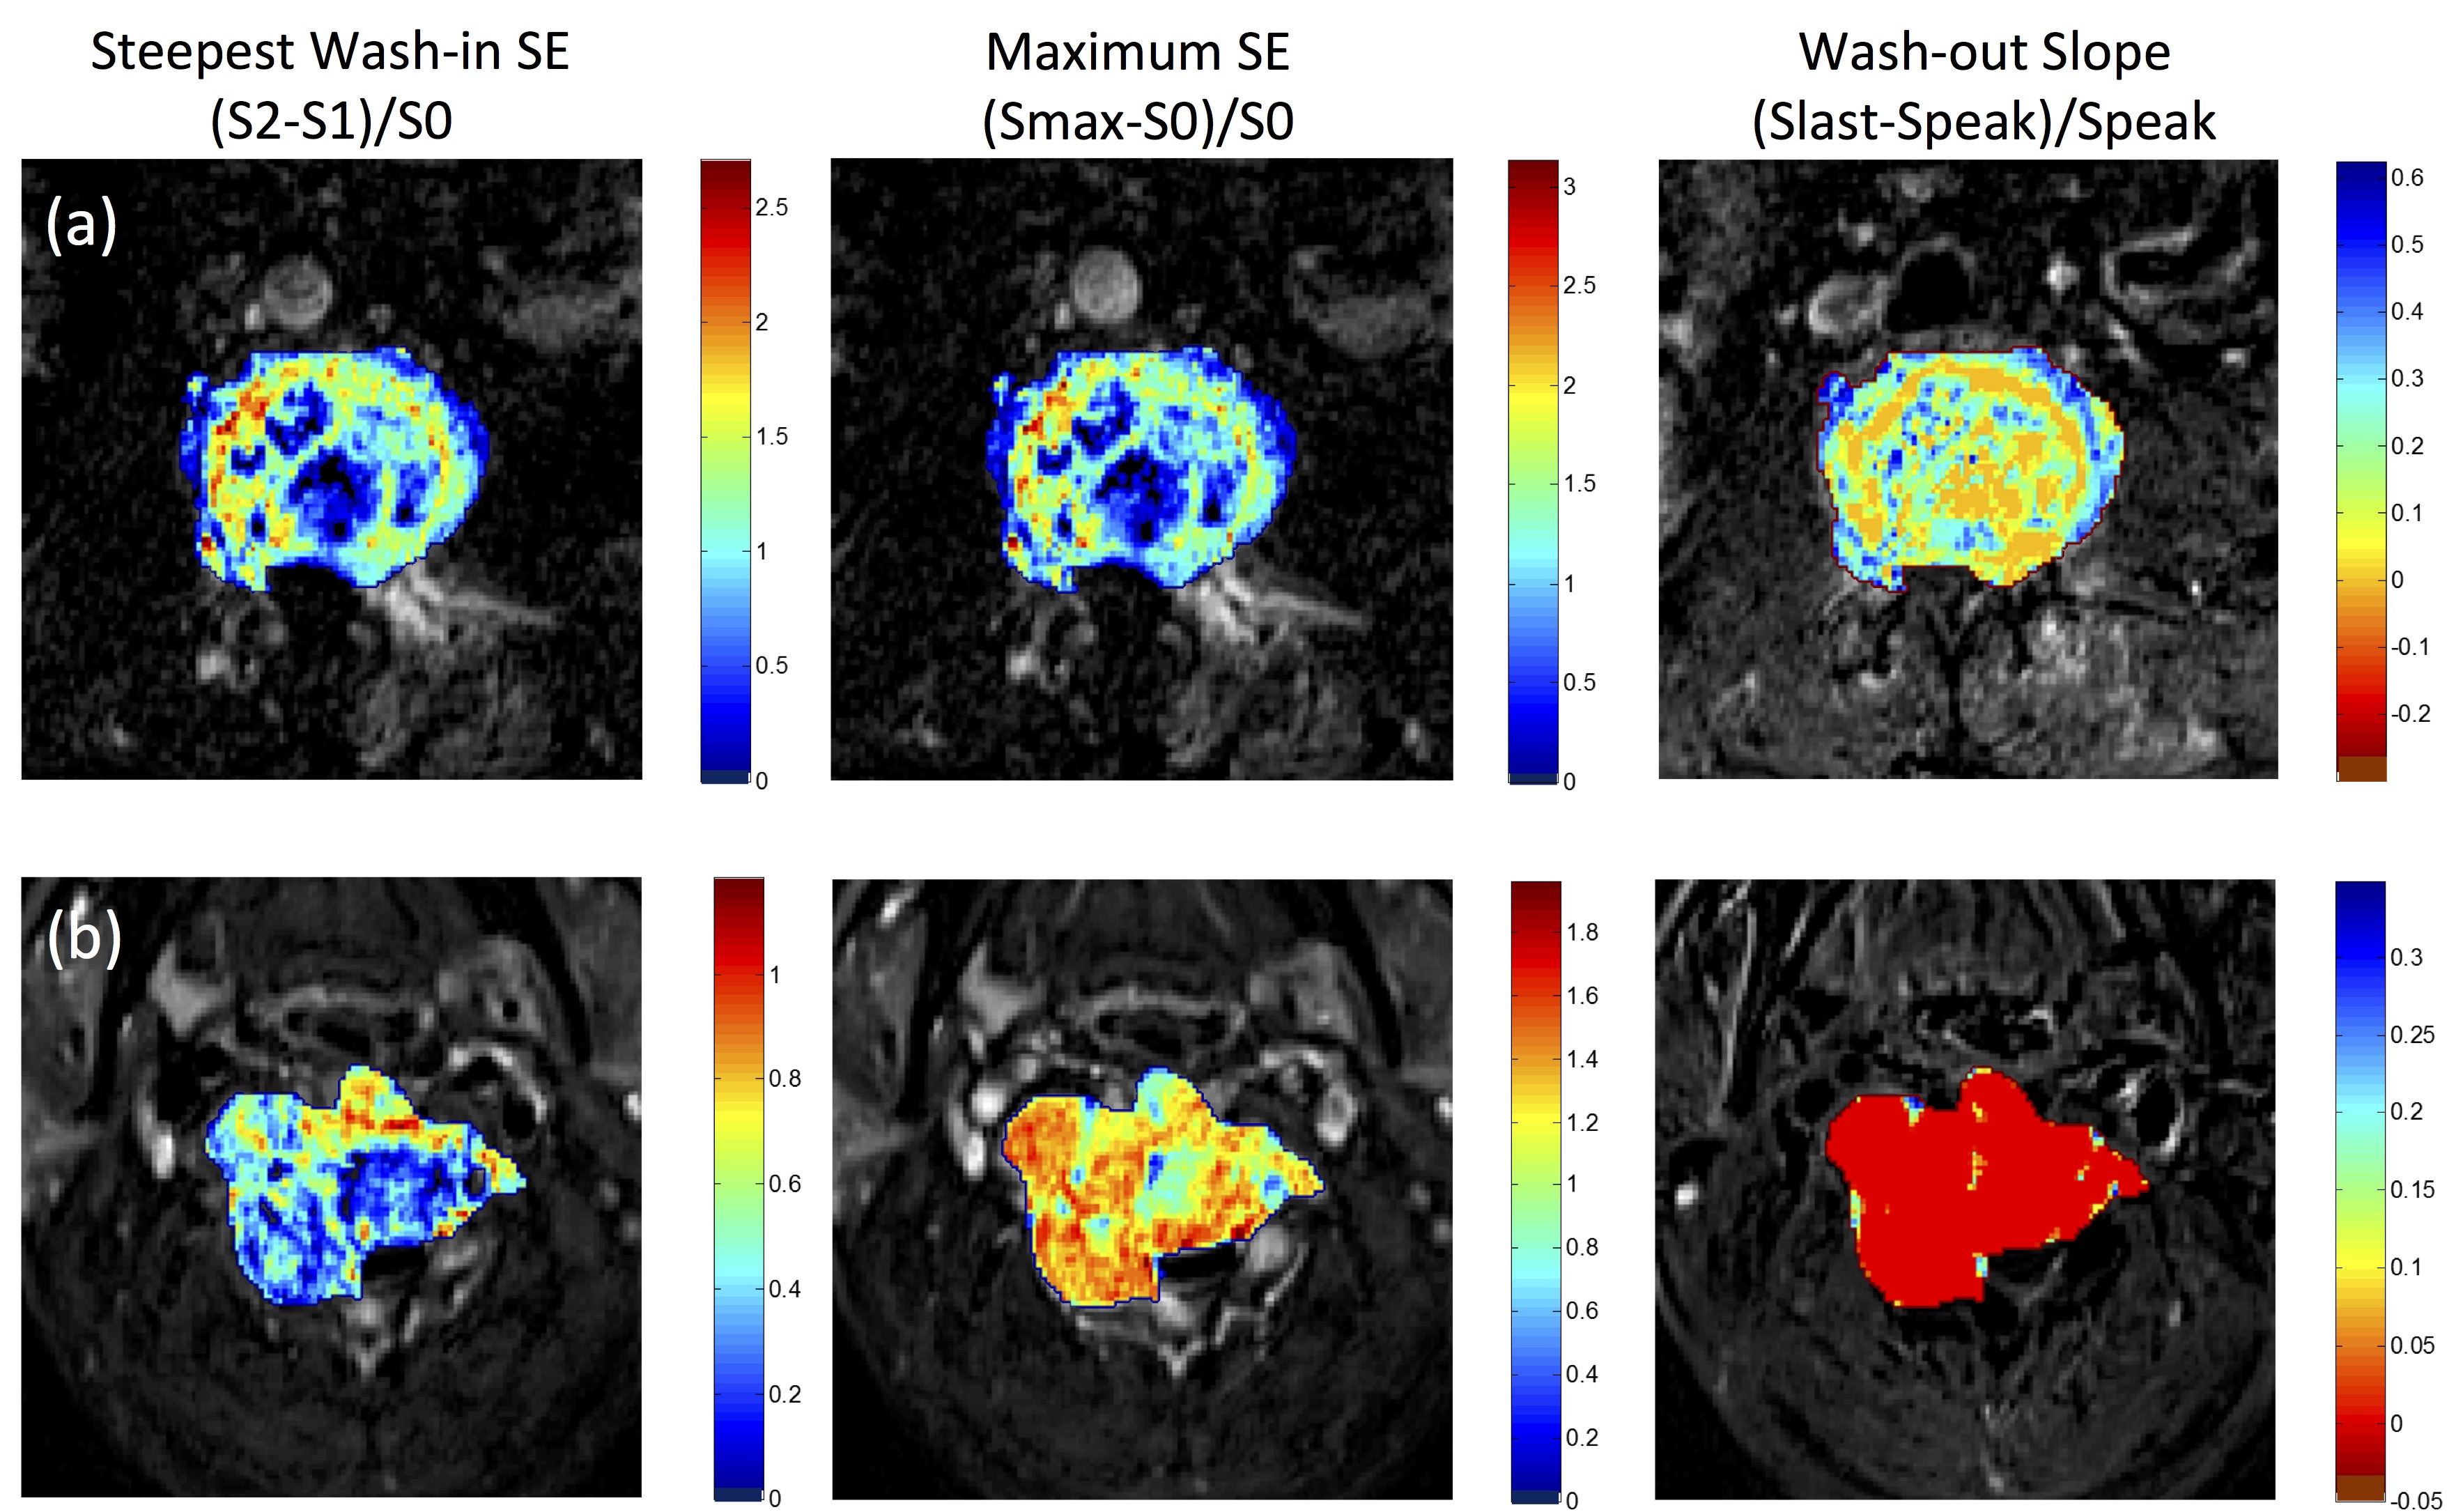
Figure 4:
The generated DCE maps: the steepest wash-in signal enhancement (SE) ratio
calculated as (S2-S1)/S0, maximum SE ratio (Smax-S0)/S0, and wash-out slope
(Slast-Speak)/Speak, from the two case examples shown in Figure 1 metastatic
lung cancer and Figure 2 metastatic thyroid cancer. Only the voxels within the
tumor ROI are shown by color according to the color maps. The entire thyroid
cancer shows a clear wash-out pattern in red color; in contrast, the lung
cancer mainly shows the plateau pattern in orange to green color.
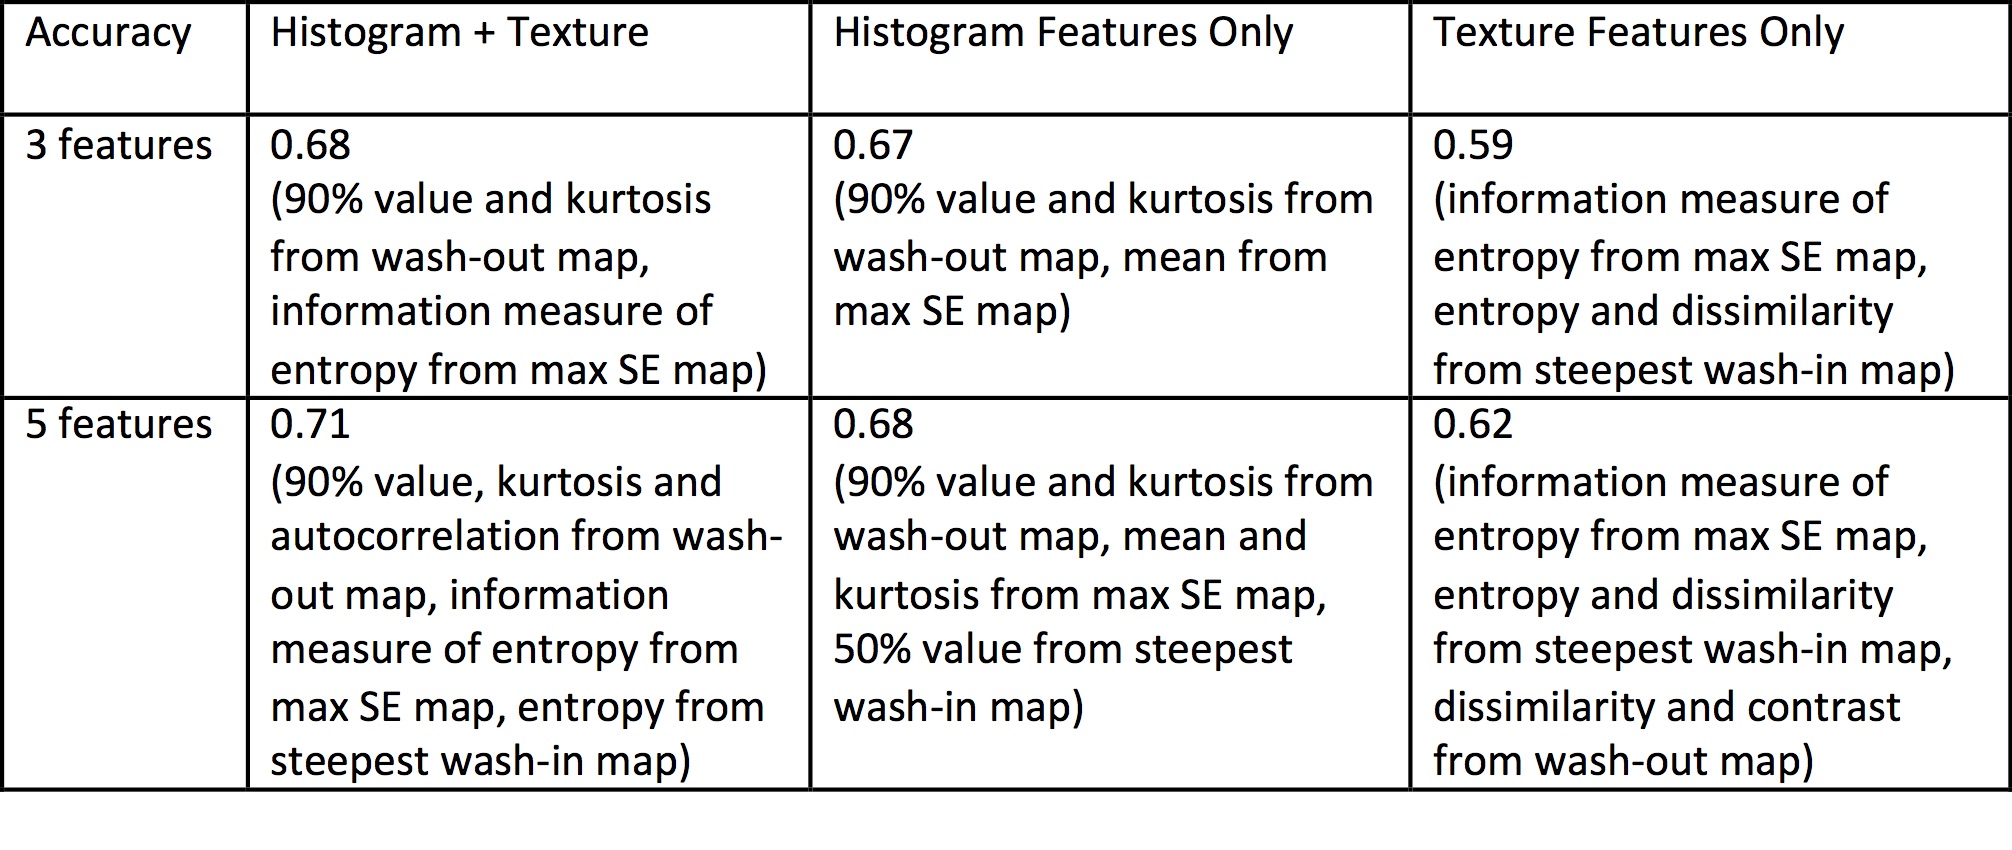
Table 1:
Accuracy in differentiating lung metastases from other cancers based on
selected features in the radiomics analysis