1141
Large-scale Knee Osteoarthritis Prediction from Spherical Coordinate Encoding of Bone Shape with Deep Learning Classifier1Department of Radiology, University of California, San Francisco, San Francisco, CA, United States
Synopsis
Osteoarthritis (OA) is a degenerative joint disease which affects 27 million U.S. adults. Previous studies have shown a relationship between bone shape and OA. In this study, the femur, tibia, and patella from the Osteoarthritis (OA) Initiative data set were segmented and converted into a spherical coordinate plane. The 2D spherical images for each bone were combined into RGB images and used to train a knee OA diagnosis and a knee OA progression binary classifier, while taking into account demographic data such as age, gender, and BMI. The model achieved an OA diagnosis average accuracy of 78.15%.
Synopsis
Introduction
Osteoarthritis (OA) is a degenerative joint disease which affects 27 million U.S. adults. The onset of OA is related to several factors such as cartilage loss and changes in the meniscus. In addition to degeneration of soft tissues, it has been suggested that changes also occur in the subchondral bone1-3. While previous studies showed associations between bone shape and OA4-7, inferential statistics does not guarantee actual prediction abilities. This study aims to fill this gap by exploring the ability of deep learning convolutional neural networks to use knee bone shape features in diagnosing and predicting future onset of radiographic OA based on Kellgren-Lawrence grade8.Methods
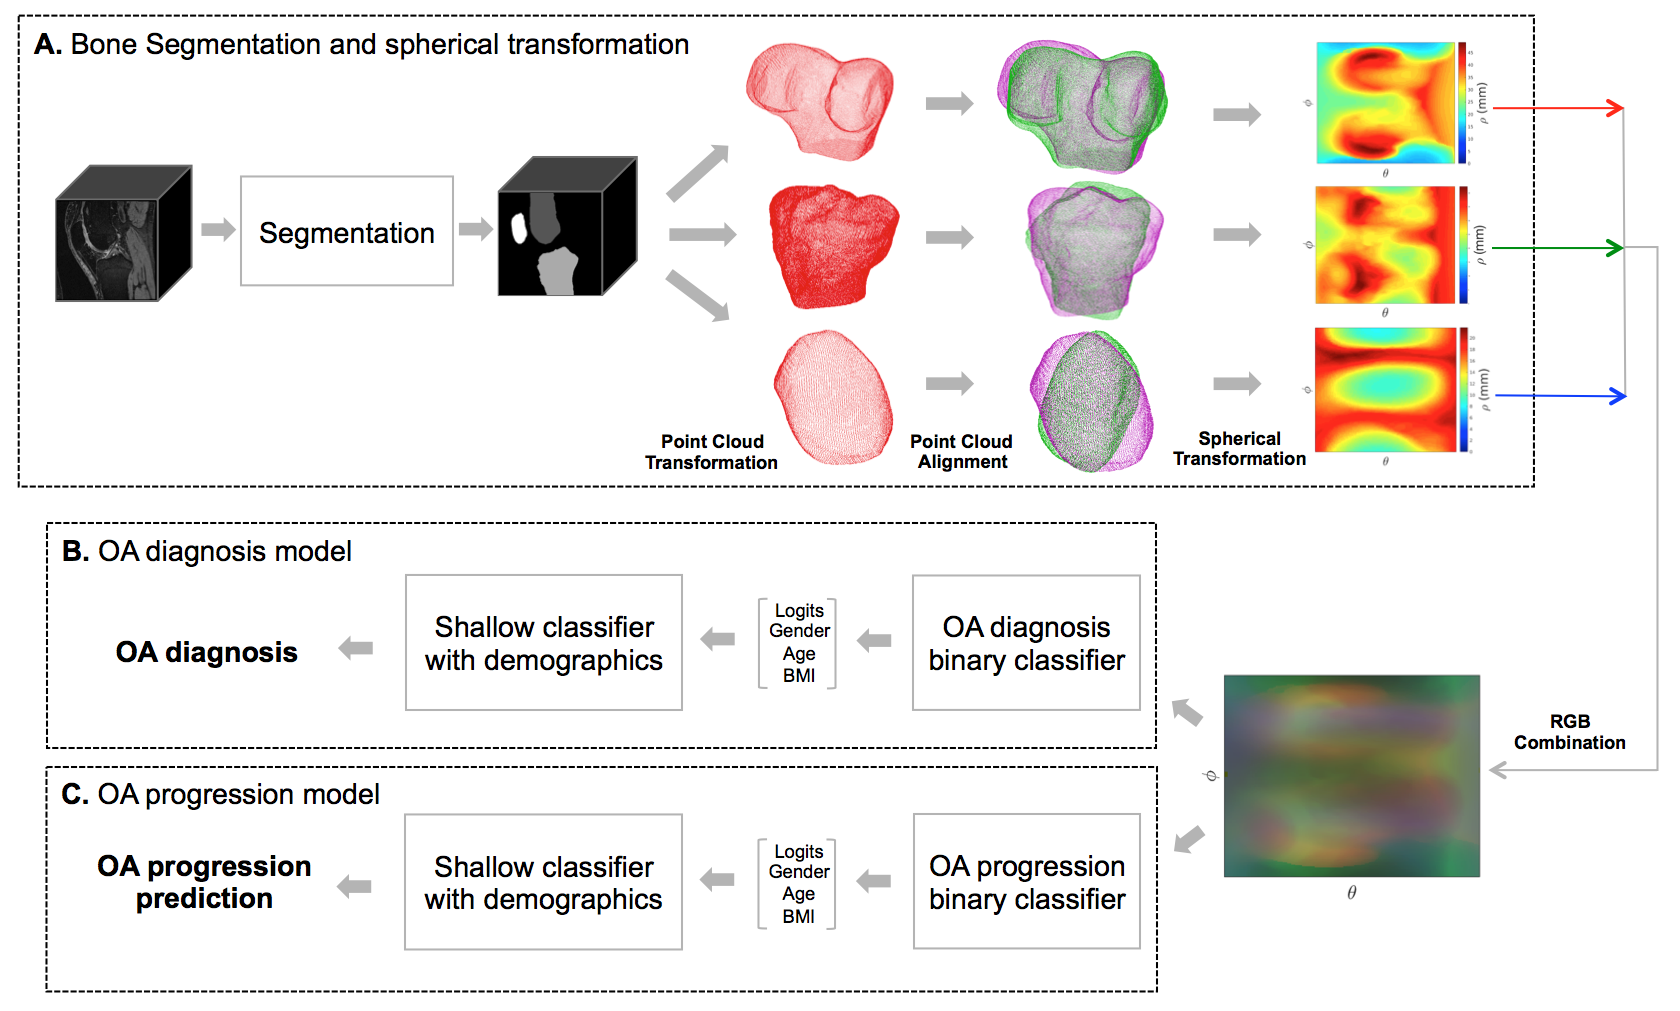
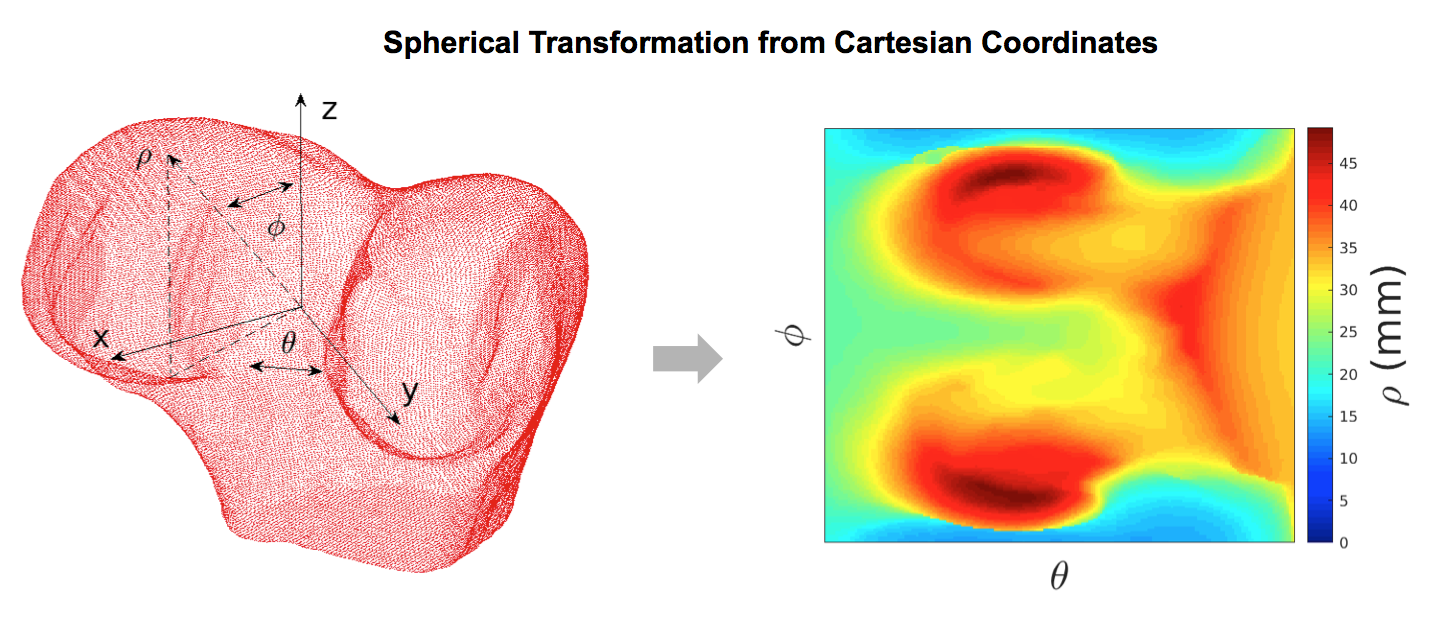
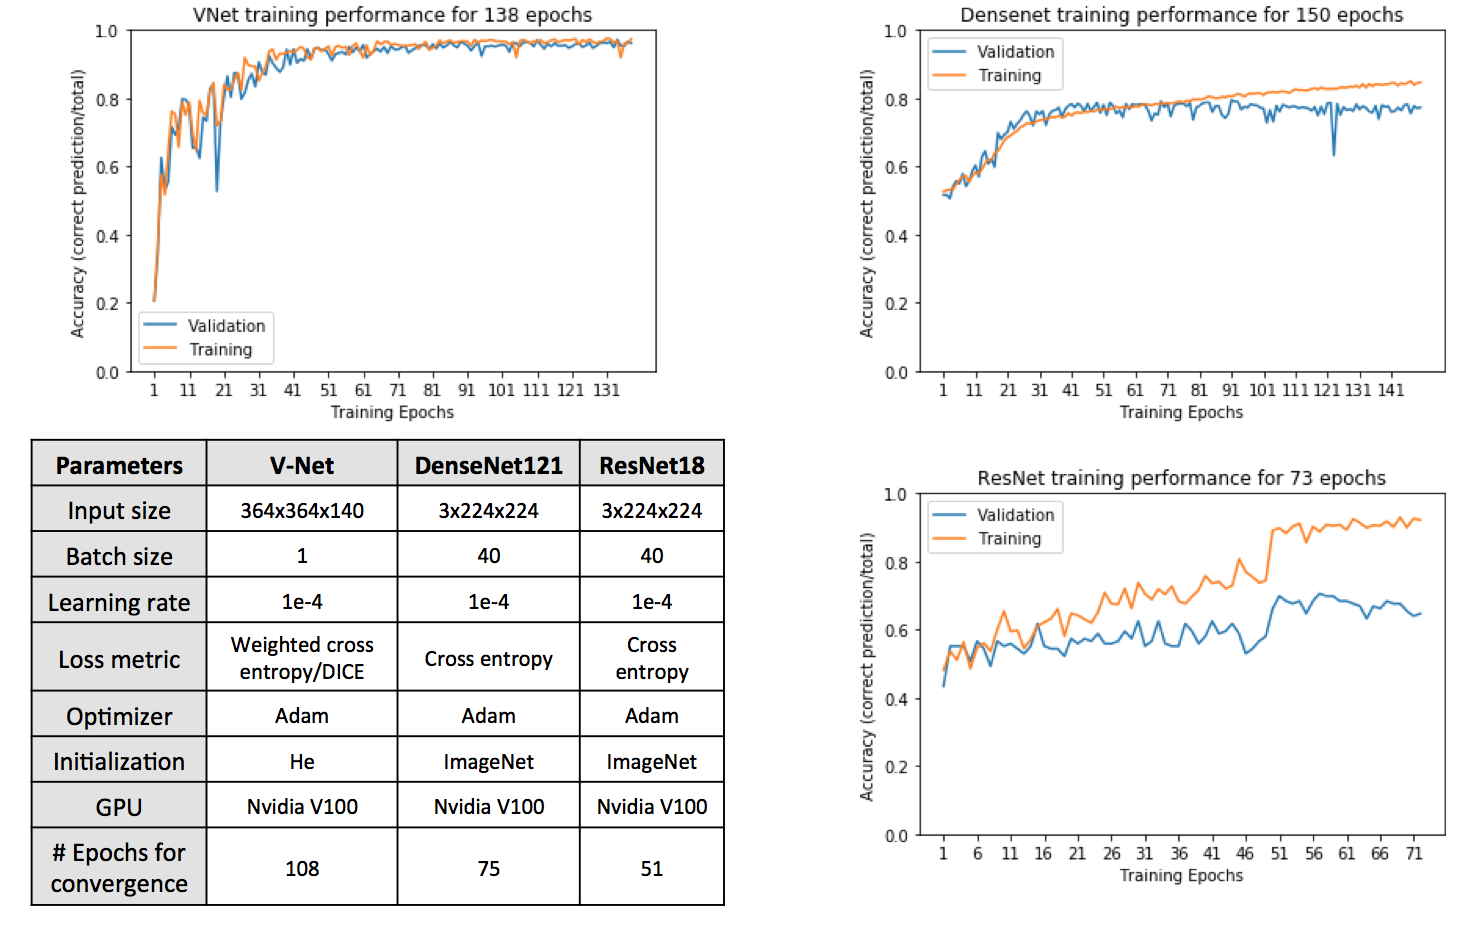
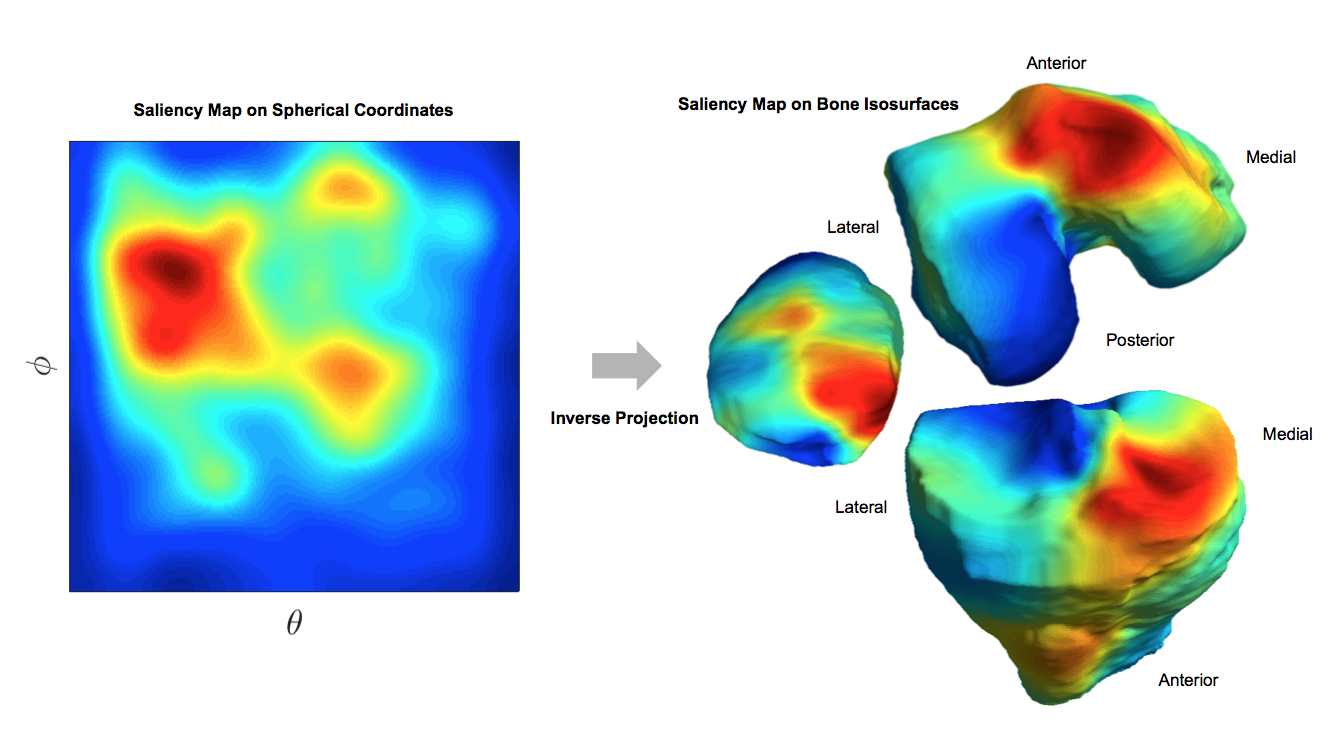
The Osteoarthritis Initiative (OAI) data set used for this study contains 3D double-echo steady-state (3D-DESS, 3T Siemens, TR/TE 16.2/4.7; field of view, 14 cm; matrix, 307x348; bandwidth, 62.5 kHz; and image resolutions, [0.346 0.346 0.7] mm) MRI knee scans from a total of 4,796 unique patients for 10 different time points for both knees. Overall processing pipeline is shown in Figure 1. The femur, tibia and patella were segmented using V-Net9 and segmentation masks were transformed into metric-scale isosurfaces. Predicted masks with bone volumes outside of three standard deviations of the manually segmented data were not used further in the pipeline. Each isosurface was aligned to a reference point cloud for each bone type to ensure rotational invariance. The point clouds were then transformed into spherical coordinates by taking the distance from the centroid to the bone surface, in millimeters, as the intensity and the combination of angles as the pixel coordinates (Figure 2). Normalized spherical conversions were then combined into a RGB image that was used as an input for 2 binary classifiers. The first one was trained using the entire dataset and aimed to diagnose OA (KL 0-1 vs KL 2-3) and the second one was trained just on controls (KL=0,1) to predict future onset of radiographic OA (KL 2-3) within two years of the last healthy time point. Different architectures were tested for both models: SqueezeNet10, DenseNet12111 and ResNet1812. The hyper-parameter optimization involved modifying the learning rate by increments of 5e-5 and testing two optimizers: Adam and SGD. The final optimization details for the training can be found on Figure 3. V-Net was trained with 40 manually segmented bone masks split into 25/5/10 sets for the training, validation and holdout sets respectively. OA diagnosis dataset included a total of 23,921 MRI scans (11,517 (48.14%) KL 0-1 and 12,404 (51.85%) KL 2-4) split into 14,776/4,935/4,208 sets for the training, validation and holdout sets respectively. The training data for the OA progression model consisted of a total of 913 scans split into 590/139/182 for training, validation and holdout respectively. Both models were then connected to a gradient boosting shallow classifier to incorporate demographics data for each patient such as gender, age, and body mass index (BMI). The class balance for the OA progression model was 408 healthy controls and 504 OA progression scans. The patient male-female gender balance was 10,503 to 13,374 for the OA diagnosis and 389 to 512 for the OA progression. For model interpretation, 2D saliency maps were generated and projected onto the 3D bone surfaces.Results
The holdout mean DICE coefficients ranged from 88.9% to 95.2% for femur segmentation, from 87.0% to 95.8% for tibia segmentation and from 85.1% to 92.2% for the patella segmentation. The holdout sensitivity and specificity for the OA DenseNet binary classifier were 79.0% and 77.1% respectively. The holdout sensitivity and specificity for the OA two-year progression ResNet binary classifier were 76.8% and 57.5% respectively. The holdout sensitivity and specificity for the shallow classifier with demographics for the OA diagnosis was 81.03% and 79.01% respectively and for the OA progression was 76.77% and 62.50% respectively. Figure 4 shows an example 3D surface saliency map.Discussion and Conclusion
With this study, we have established a model for prediction of radiographic OA using bones shapes as the single factor. Additional demographic data such as gender, age and BMI was combined with the bone shape in order to improve the predictive accuracy of the model. While previous studies have shown associations between bone shape and OA, this study is the first to use deep learning to predict radiographic OA using bone shape features. Future directions include improving the overall accuracy of the models used in the study in order to recover the full OAI data set that was poorly segmented or processed. Augmentation techniques could also be used in the binary classifiers to improve the generalizability of the models and their overall robustness.Acknowledgements
This study was funded by the National Institutes of Health - National Institute of Arthritis and Musculoskeletal and Skin Diseases (NIH-NIAMS). Grant numbers: R00AR070902 (VP), R61AR073552 (SM/VP). We would like to thank Andrew Leynes, Department of Radiology, UCSF for his assistance with the saliency maps.
References
- Muller-Gerbl M, Griebl R, Putz R, et al. Assessment of subchondral bone density distribution patterns in patients subject to correction osteotomy. Trans Orth Society. 1994;19:574. Muller-Gerbl M, Putz R,
- Hodapp N, et al. Computer tomography osteo-absorptiometry for assessing the density distribution of subchondral bone as a measure of long term mechanical adaptation in individual joints. Skeletal Radiology. 1989;18:507-12.
- Pauwels F. Diomechanics of the locomotor apparatus. Berlin: Springer; 1980.
- Lynch JA, Parimi N, Chaganti RK, et al. Study of Osteoporotic Fractures Research G. The association of proximal femoral shape and incident radiographic hip OA in elderly women. Osteoarthritis and cartilage / OARS, Osteoarthritis Research Society. 2009;17(10):1313-8.
- Bredbenner TL, Eliason TD, Potter RS, et al. Statistical shape modeling describes variation in tibia and femur surface geometry between Control and Incidence groups from the osteoarthritis initiative database. Journal of biomechanics. 2010;43(9):1780-6.
- Baker-Lepain JC, Lynch JA, Parimi N, et al. Variant alleles of the Wnt antagonist FRZB are determinants of hip shape and modify the relationship between hip shape and osteoarthritis. Arthritis and rheumatism. 2012;64(5):1457-65.
- Neogi T, Bowes MA, Niu J, et al. Magnetic resonance imaging-based three-dimensional bone shape of the knee predicts onset of knee osteoarthritis: data from the osteoarthritis initiative. Arthritis and rheumatism. 2013;65(8):2048-58.
- Kohn, M, Sassoon A, Navin F. Classifications in Brief: Kellgren-Lawrence Classification of Osteoarthritis. Clinical Orthopaedics and Related Research. 2016; 474(8):1886–93. https://doi.org/10.1007/s11999-016-4732-4.
- Milletari F, Navab N, Ahmadi SA. V-Net: Fully Convolutional Neural Networks for Volumetric Medical Image Segmentation. 2016. https://arxiv.org/abs/1606.04797.
- Hu J, Shen L, Albanie S, et al. Squeeze-and-Excitation Networks. 2017. https://arXiv:1709.01507.
- Huang G, Liu Z, van der Maaten L, et al. Densely Connected Convolutional Networks. 2016. https://arxiv.org/abs/1608.06993.
- He K, Zhang X, Ren S, et al. Deep Residual Learning for Image Recognition. 2015. http://arxiv.org/abs/1512.03385.
Figures