1140
Evaluating the Use of Deep-Learning Super-Resolution for Obtaining Osteoarthritis Biomarkers1Radiology, Stanford University, Palo Alto, CA, United States, 2Austin Radiological Association, Austin, TX, United States, 3LVIS Corporation, Palo Alto, CA, United States, 4Neurology, Stanford University, Palo Alto, CA, United States
Synopsis
The use high-resolution magnetic resolution imaging (MRI) is beneficial for acquiring quantitative biomarkers corresponding to osteoarthritis (OA) severity and progression. However, the long scan times of high-resolution sequences, such as double-echo steady-state (DESS) that was included in the Osteoarthritis Initiative, precludes their widespread adoption. Deep-learning-based super-resolution has the potential to transform low-resolution MRI that can be acquired faster, into high-resolution images. Using qualitative cartilage image quality, and quantitative cartilage morphometry and osteophyte detection, we have shown that deep-learning-based super-resolution can enhance DESS slice-resolution threefold and offer the same utility as the original high-resolution acquisition for obtaining OA biomarkers.
Introduction
Magnetic resonance imaging (MRI) is a common tool for studying soft-tissue changes caused by osteoarthritis (OA). However, high-resolution MRI is primarily limited by long scan times, which increases the time and costs of large research studies. For example, the Osteoarthritis Initiative (OAI) included a 11-minute high-resolution double-echo steady-state (DESS) pulse sequence to primarily evaluate cartilage morphology and detect osteophytes1. While parallel imaging and compressed sensing can accelerate image acquisition, they require long reconstruction durations and typically generate blurrier and noisier images2. Advances in deep-learning-based super-resolution (SR) may provide an alternate technique to accelerate image acquisition without such tradeoffs by transforming low-resolution images into higher-resolution3. However, SR has not yet replicated the utility of the original fully-sampled high-resolution images. Consequently, in this study, we assess whether we can enhance resolution of DESS threefold using deep-learning-based super-resolution without biasing quantitative morphometry and qualitative image quality of cartilage, as well as the detection of osteophytes.Methods
We utilized a 3D convolutional neural network (CNN) entitled MRSR to transform low-resolution images into higher-resolution images by learning a residual image difference4. For arbitrary low-resolution images during testing, MRSR performs a summation of the residual and low-resolution images to sharpen the output. MRSR was trained/validated/tested on 124/35/17 DESS scans respectively. The MRSR inputs included 3x thicker slices simulated from the high-resolution 0.7mm slices using anti-aliasing filters and tricubicly interpolated (TCI) to generate low-resolution slices at the high-resolution locations.
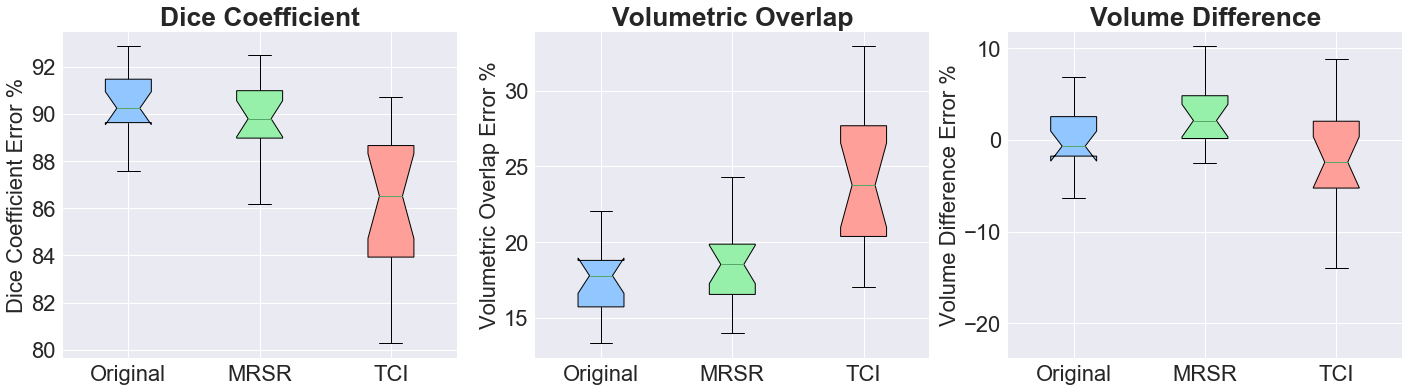
To evaluate quantitative femoral cartilage morphometry variations, we designed an automated 3D U-Net CNN with 5 encoding-decoding steps using filters increasing from 32 to 512 to segment tissue in the original high-resolution images, MRSR images, and the low-resolution TCI images5,6. Ground-truth segmented labels were obtained from the OAI and trained with identical training/validation/testing splits as MRSR. Automated morphometry validation was performed to overcome human inter-reader variabilities, with the hypothesis that similar appearing images produce the same quantitative results. Dice coefficients (DC), volumetric overlap error (VOE), and volume difference (VD) and its root-mean-square coefficient of variation (RMS-CV%) assessed the segmentation accuracy compared to the ground-truth, and subsequently, to variations between the high-resolution, MRSR, and TCI images. The same metrics were computed for the original images serving as the ground-truth to compute segmentation overlap with SR and TCI.
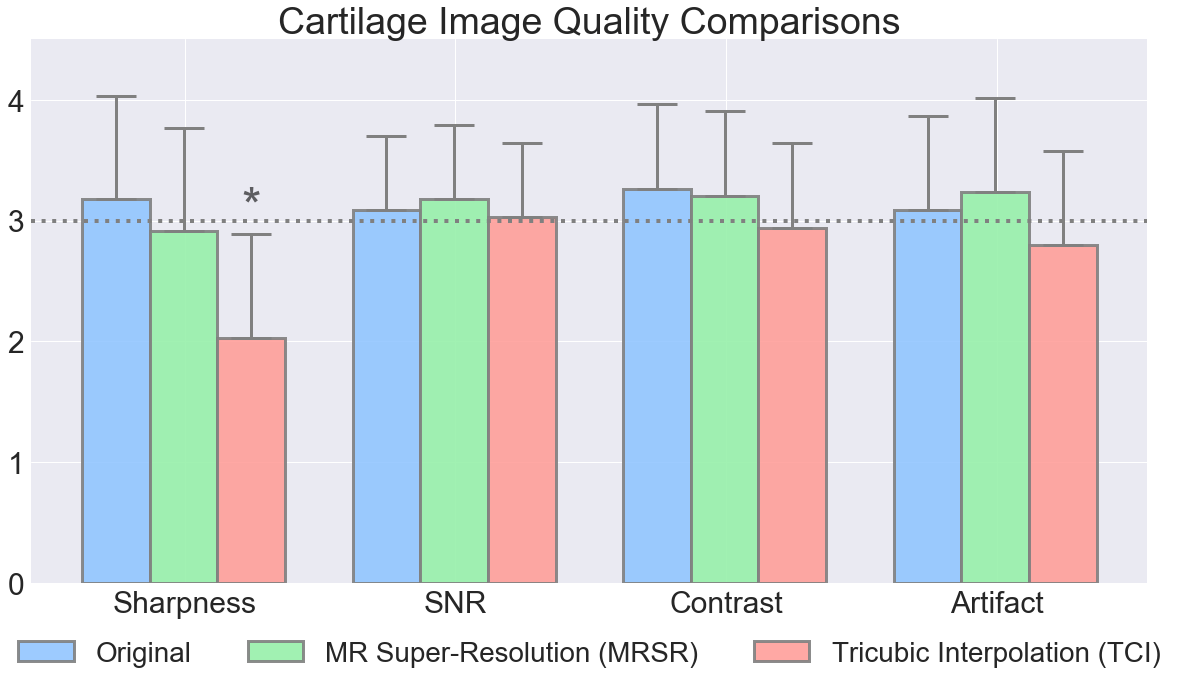
Qualitative cartilage image quality was assessed by two musculoskeletal radiologists who blindly scored the three sets of images for sharpness, contrast, signal-to-noise ratio (SNR), and artifacts on a 1-5 scale (1=non-diagnostic, 2=limited quality, 3=diagnostic quality, 4=good, 5=high-quality). The radiologists also identified osteophytes in 14 sub-regions of the knee (using previous guidelines, but with additional central and peripheral posterior femoral condyle compartments)7 on randomized sets of all three images, with a washout period of one week between the readings. Osteophyte size was graded by measuring the distance the osteophyte projected beyond the joint margin where grades: 1=0-2mm, 2=2-4mm, and 3=4+mm.
Mann-Whitney U-Tests (α=0.05) with Bonferroni corrections compared all DC, VOE, VD, and RMS-CV% metrics for the three image-sets. Linearly-weighted Cohen’s Kappa measured inter-reader and intra-reader sequence concordance.
Results
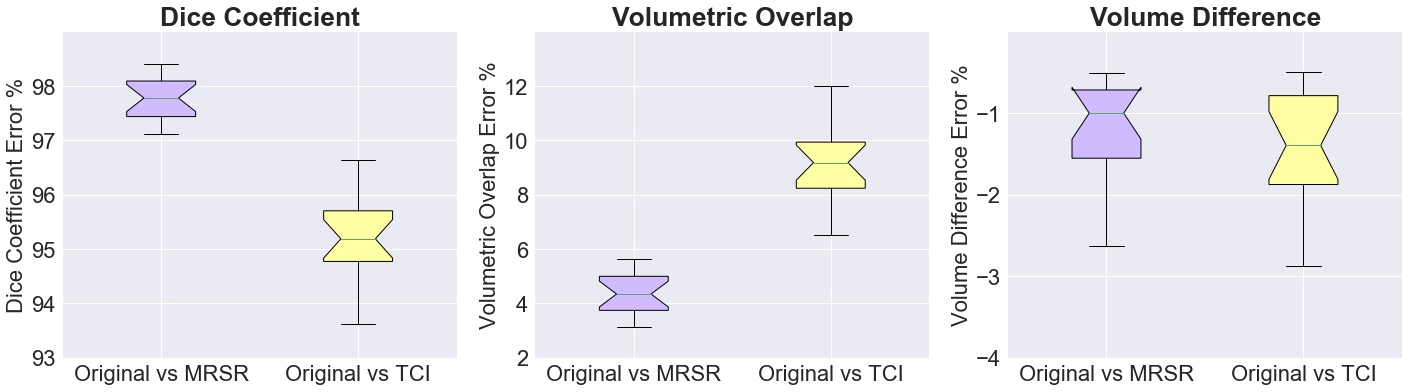
The 3D UNet segmentation method generated a DC of 90.2%, which outperforms the current state-of-the-art (Fig.2)8,9. Unlike MRSR images, TCI images had significantly lower DC and VOE (p<0.0001) compared to the original. In comparing MRSR and TCI surface overlap with the original (Fig.3), TCI had significantly lower DC and VOEs (p<0.0001). The MRSR and TCI RMS-CV% were 0.4% and 2.6% respectively, compared to the original.
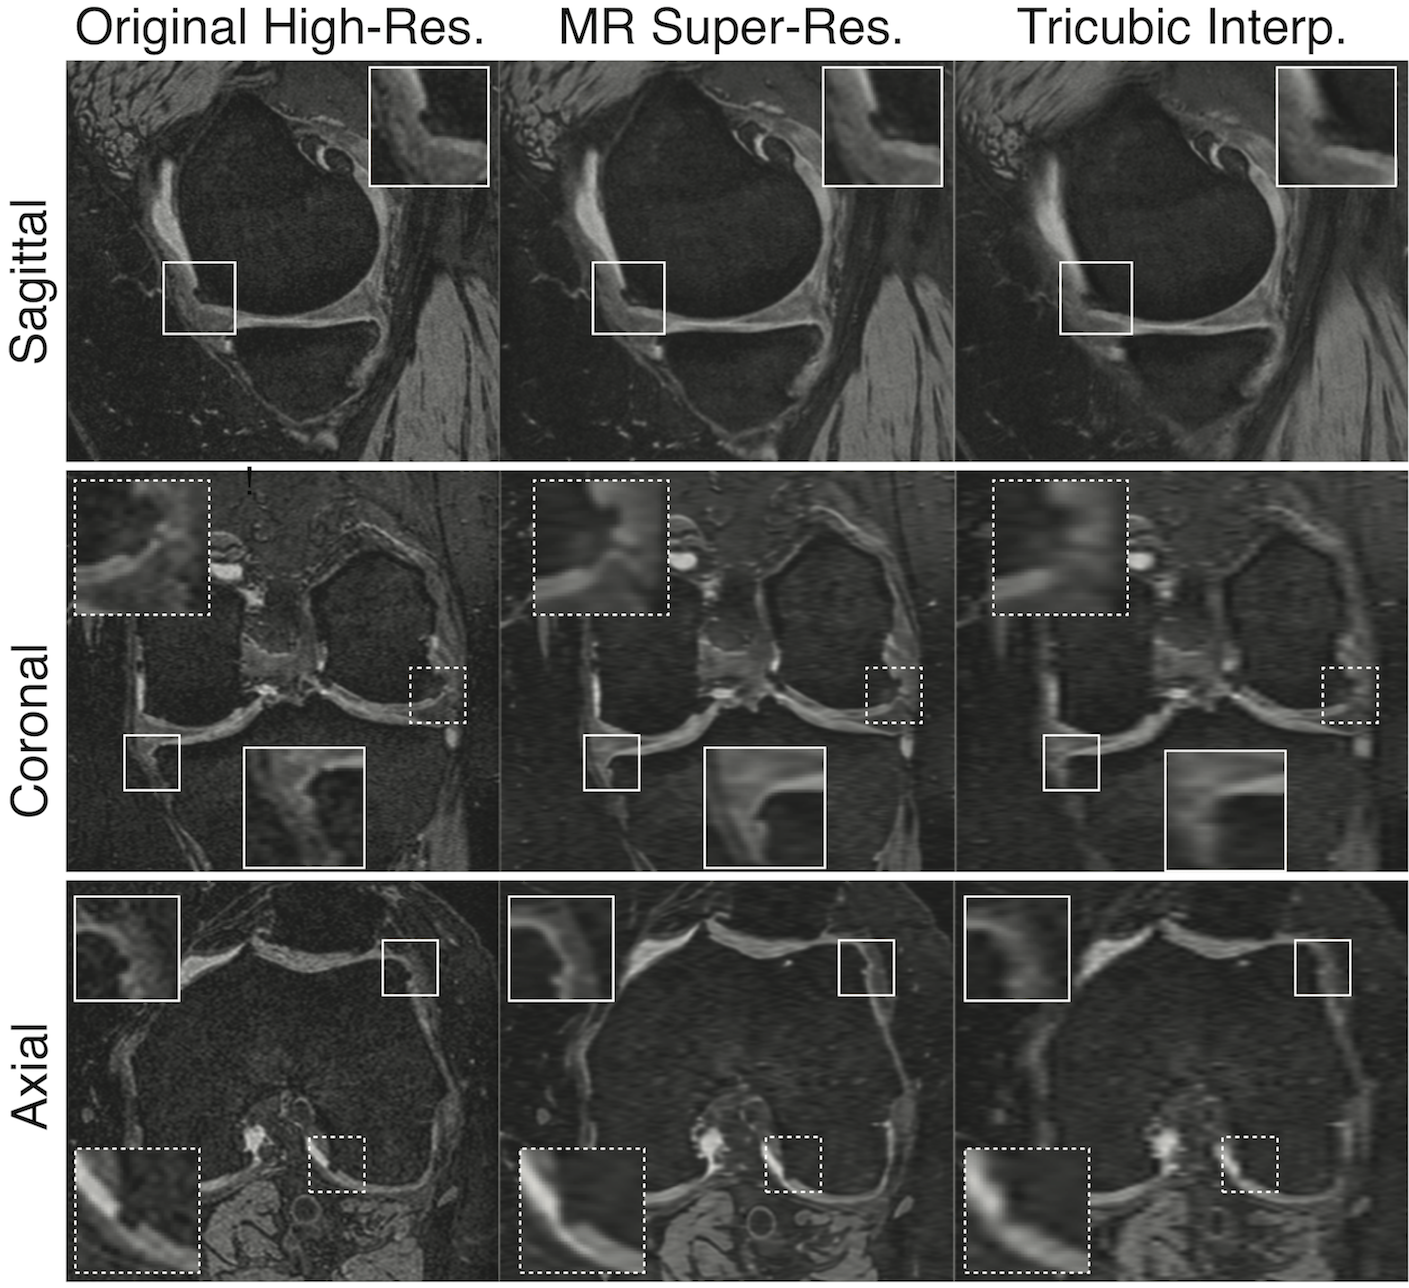
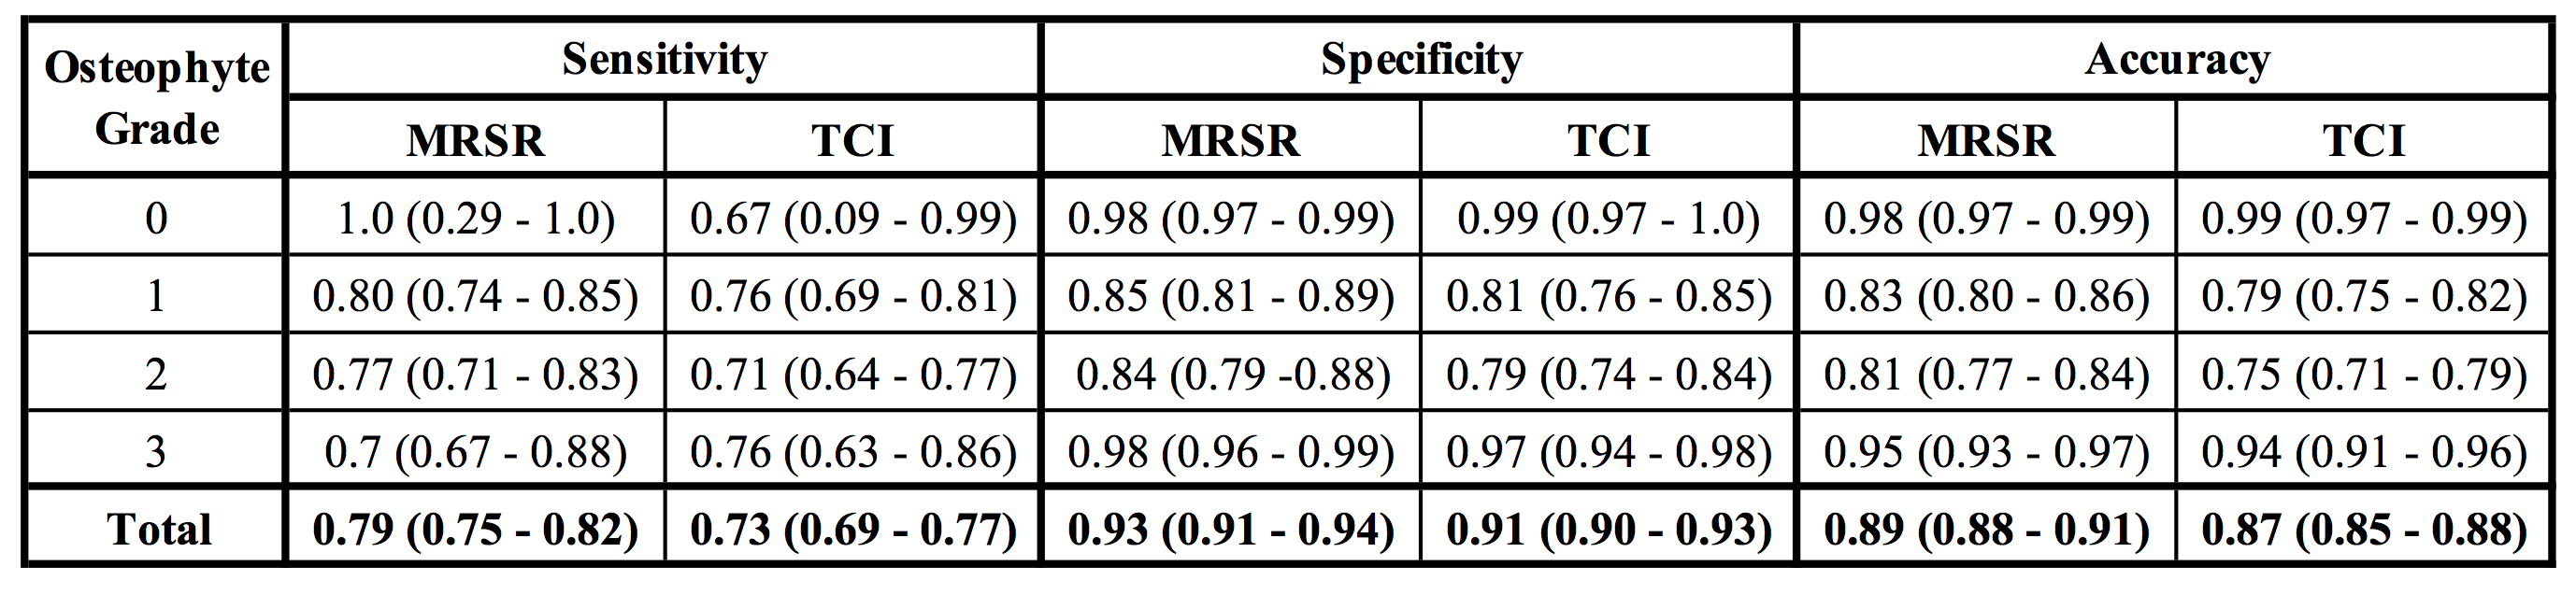
MRSR had comparable image quality to that of the original images (Fig.3) for sharpness, SNR, contrasts and artifacts (Fig.4). MRSR had significantly better sharpness (p<0.00001) than TCI. MRSR had higher sensitivity and specificity for classification of all grades of osteophytes, compared to TCI (Fig.5). An inter-reader Kappa of 0.45 (0.39-0.50) was comparable to previous studies7. Intra-reader MRSR Kappa of 0.71 (0.65-0.76) was significantly higher (p<0.01) than TCI Kappa of 0.63 (0.56-0.69).
Discussion
We utilized a highly-accurate automated cartilage segmentation technique (without inter-reader human biases) to demonstrate minimal image quality differences between the original and MRSR images, with nearly-identical segmentation and overlap metrics. The reader study demonstrated high image quality for cartilage and where osteophyte detection was considerably better with MRSR than TCI across all grades of osteophytes. This suggests that MRSR does not blur out cartilage or subtle bony features. Overall, MRSR-enhanced DESS accurately recreated quantitative biomarkers originally obtained from the time-consuming OAI DESS sequence.Conclusion
Using qualitative cartilage image quality, and quantitative cartilage morphometry and osteophyte detection, we have shown that deep-learning-based super-resolution can enhance slice-resolution of DESS threefold and offer the same utility as the original high-resolution acquisition for obtaining OA biomarkers.Acknowledgements
We would like the acknowledge the following NIH grants for providing research support: R01 AR0063643, R01 EB002524, P41 EB015891, K24 AR062068, along with GE Healthcare.References
1. Peterfy, C. G., Schneider, E. & Nevitt, M. The osteoarthritis initiative: report on the design rationale for the magnetic resonance imaging protocol for the knee. Osteoarthr. Cartil. 16, 1433–1441 (2008).
2. Blaimer, M. et al. SMASH, SENSE, PILS, GRAPPA: how to choose the optimal method. Top. Magn. Reson. Imaging 15, 223–36 (2004).
3. Park, S. C., Park, M. K. & Kang, M. G. Super-resolution image reconstruction: A technical overview. IEEE Signal Process. Mag. 20, 21–36 (2003).
4. Chaudhari, A. S. et al. Super-resolution musculoskeletal MRI using deep learning. Magn. Reson. Med. 80, 2139–2154 (2018).
5. Çiçek, Ö., Abdulkadir, A., Lienkamp, S. S., Brox, T. & Ronneberger, O. 3D U-Net: Learning Dense Volumetric Segmentation from Sparse Annotation. (2016).
6. Ronneberger, O., Fischer, P. & Brox, T. U-Net: Convolutional Networks for Biomedical Image Segmentation. Miccai 234–241 (2015). doi:10.1007/978-3-319-24574-4_28
7. Hunter, D. J. et al. Evolution of semi-quantitative whole joint assessment of knee OA: MOAKS (MRI Osteoarthritis Knee Score). Osteoarthr. Cartil. 19, 990–1002 (2011).
8. Liu, F. et al. Deep Convolutional Neural Network and 3D Deformable Approach for Tissue Segmentation in Musculoskeletal Magnetic Resonance Imaging. 00, (2017).
9. Norman, B., Pedoia, V. & Majumdar, S. Use of 2D U-Net Convolutional Neural Networks for Automated Cartilage and Meniscus Segmentation of Knee MR Imaging Data to Determine Relaxometry and Morphometry. Radiology 000, 172322 (2018).
Figures