1135
DOSMA: A deep-learning, open-source framework for musculoskeletal MRI analysis1Radiology, Stanford University, Stanford, CA, United States, 2Physics and Astronomy, University of Bologna, Bologna, Italy, 3Mechanical Engineering, Stanford University, Stanford, CA, United States, 4Bioengineering, Stanford University, Stanford, CA, United States, 5Orthopedic Surgery, Stanford University, Stanford, CA, United States, 6Electrical Engineering, Stanford University, Stanford, CA, United States
Synopsis
With the onset of deep learning, many novel post-processing networks are emerging. However, these algorithms are decentralized, and thus are difficult to consolidate and implement in a clinical setting. To this end, we have developed a Python-based deep-learning, open-source musculoskeletal MR analysis framework termed DOSMA to reduce the complexity of tissue segmentation, registration, and quantitative analysis. We hope that by encouraging contributions from many researchers, this pipeline will facilitate automating traditionally laborious, manual, decentralized MR image processing tasks and will provide a standardized comparison framework for different quantitative estimation techniques.
Introduction
MRI can be utilized to capture quantitative image-based biomarkers to evaluate tissue biochemistry and to track the progression of degenerative musculoskeletal diseases. Quantitative parameters such as T2, T1ρ, and T2* relaxation times have shown promise for detecting degeneration of cartilaginous tissues1,2. To obtain such quantitative biomarkers, regions of interest must be segmented; volumes from different protocols must be registered to each other; and quantitative calculations must be performed in a standardized manner to generate reproducible results. While automatic, machine learning-based methods have been developed to replace tedious manual tasks, most methods are either not publicly available or are not seamlessly compatible with existing image processing tools.
To this end, we have designed a Python-based deep-learning, open-source musculoskeletal MR analysis framework termed DOSMA that consolidates automatic MR image processing techniques. Currently, the pipeline supports femoral cartilage segmentation in DESS scans, inter-scan registration, and quantitative analysis and visualization. In this work, we demonstrate the design and utility of DOSMA and discuss how the current backbone can be extended by collaborators to include additional image processing tasks.
Features
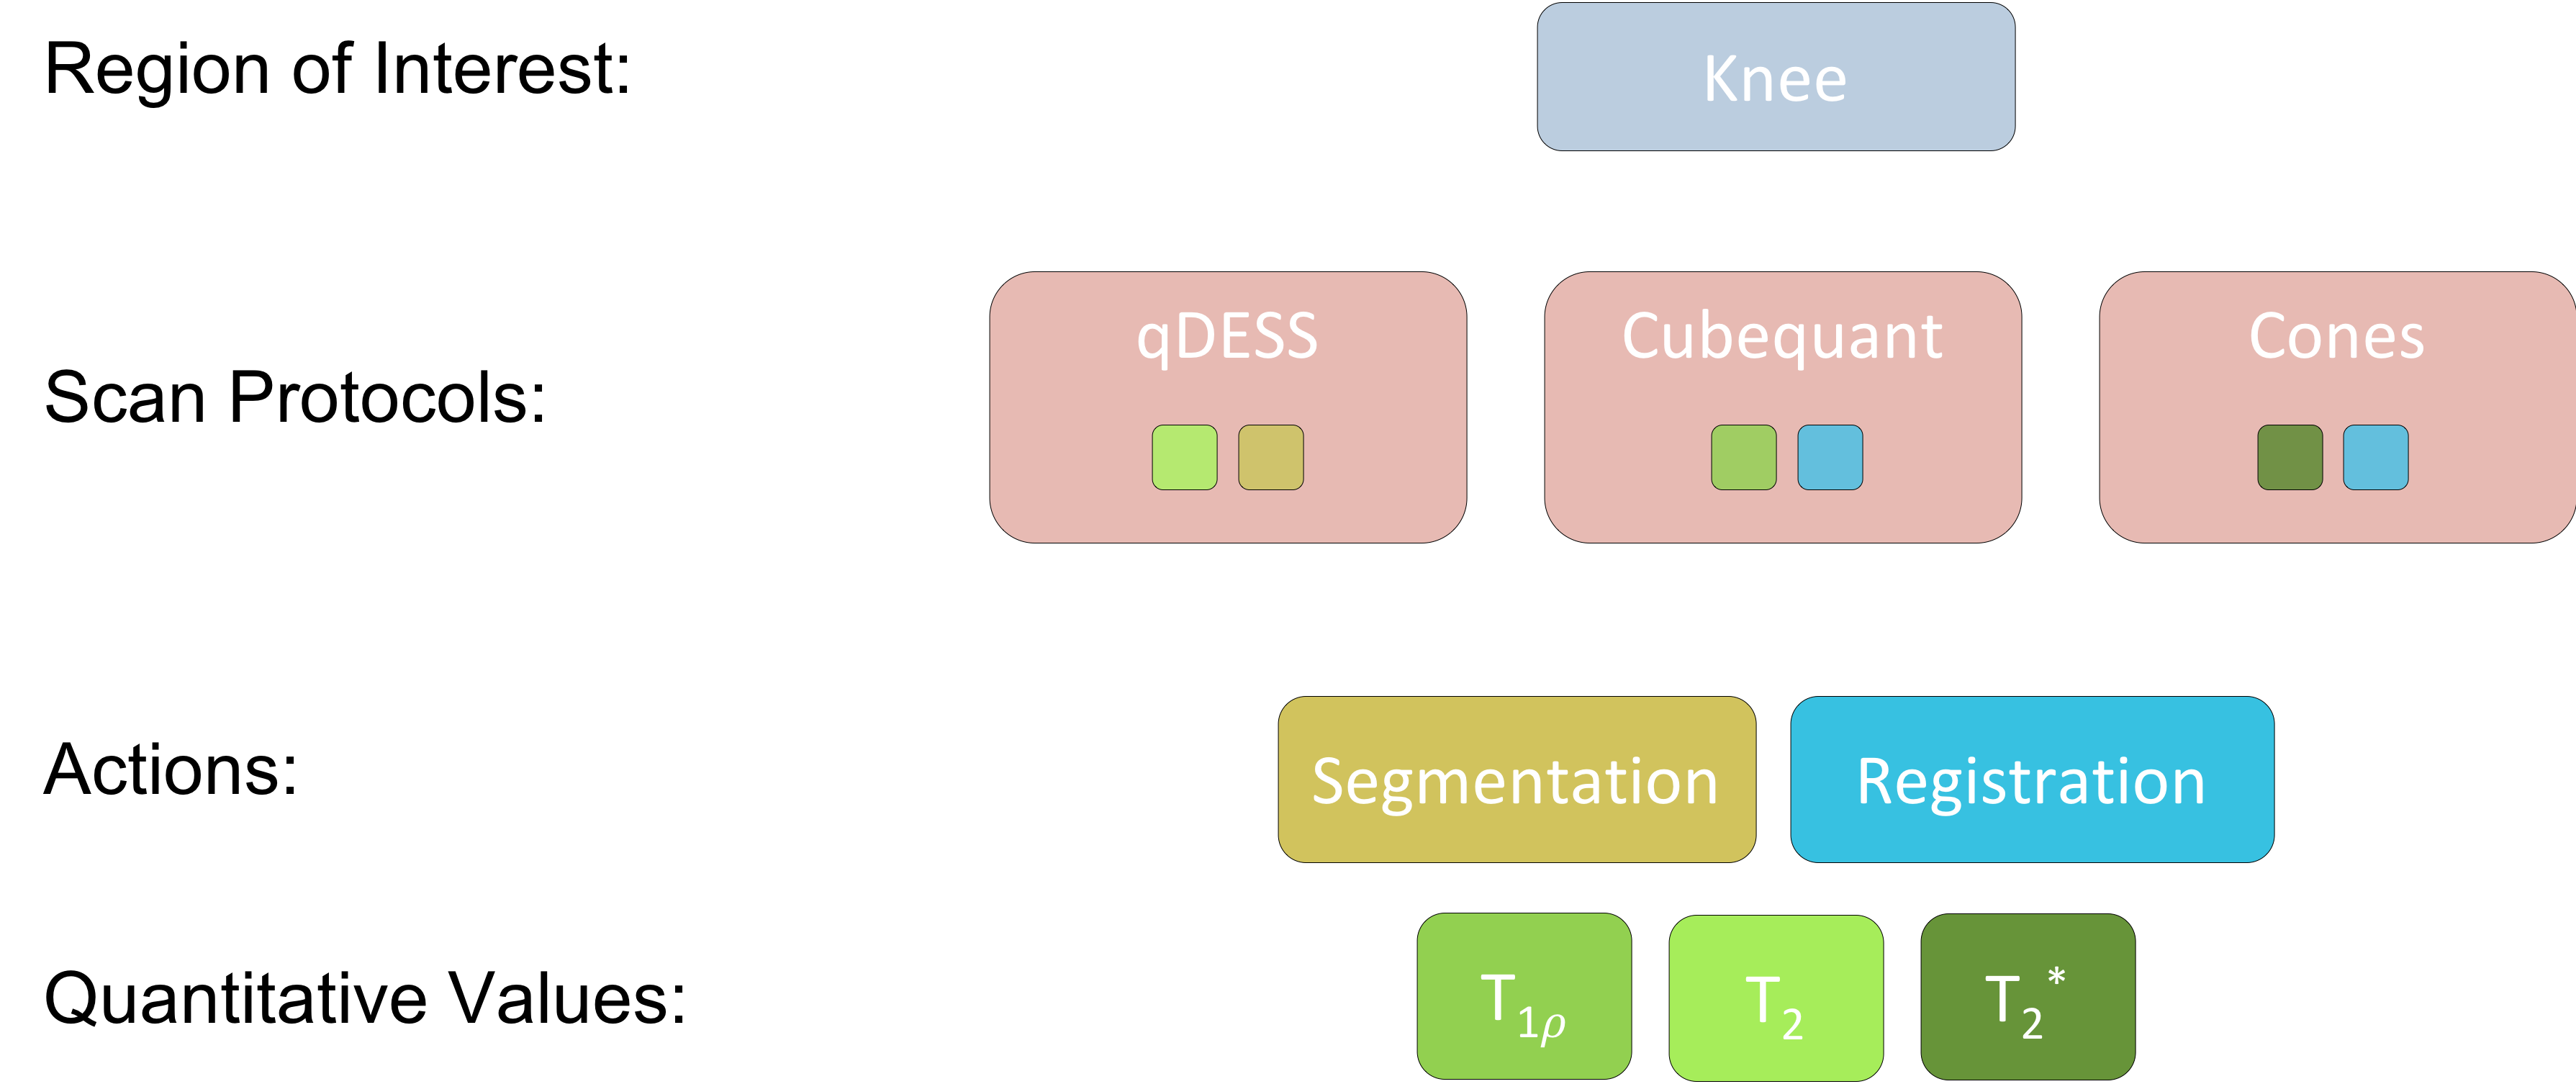
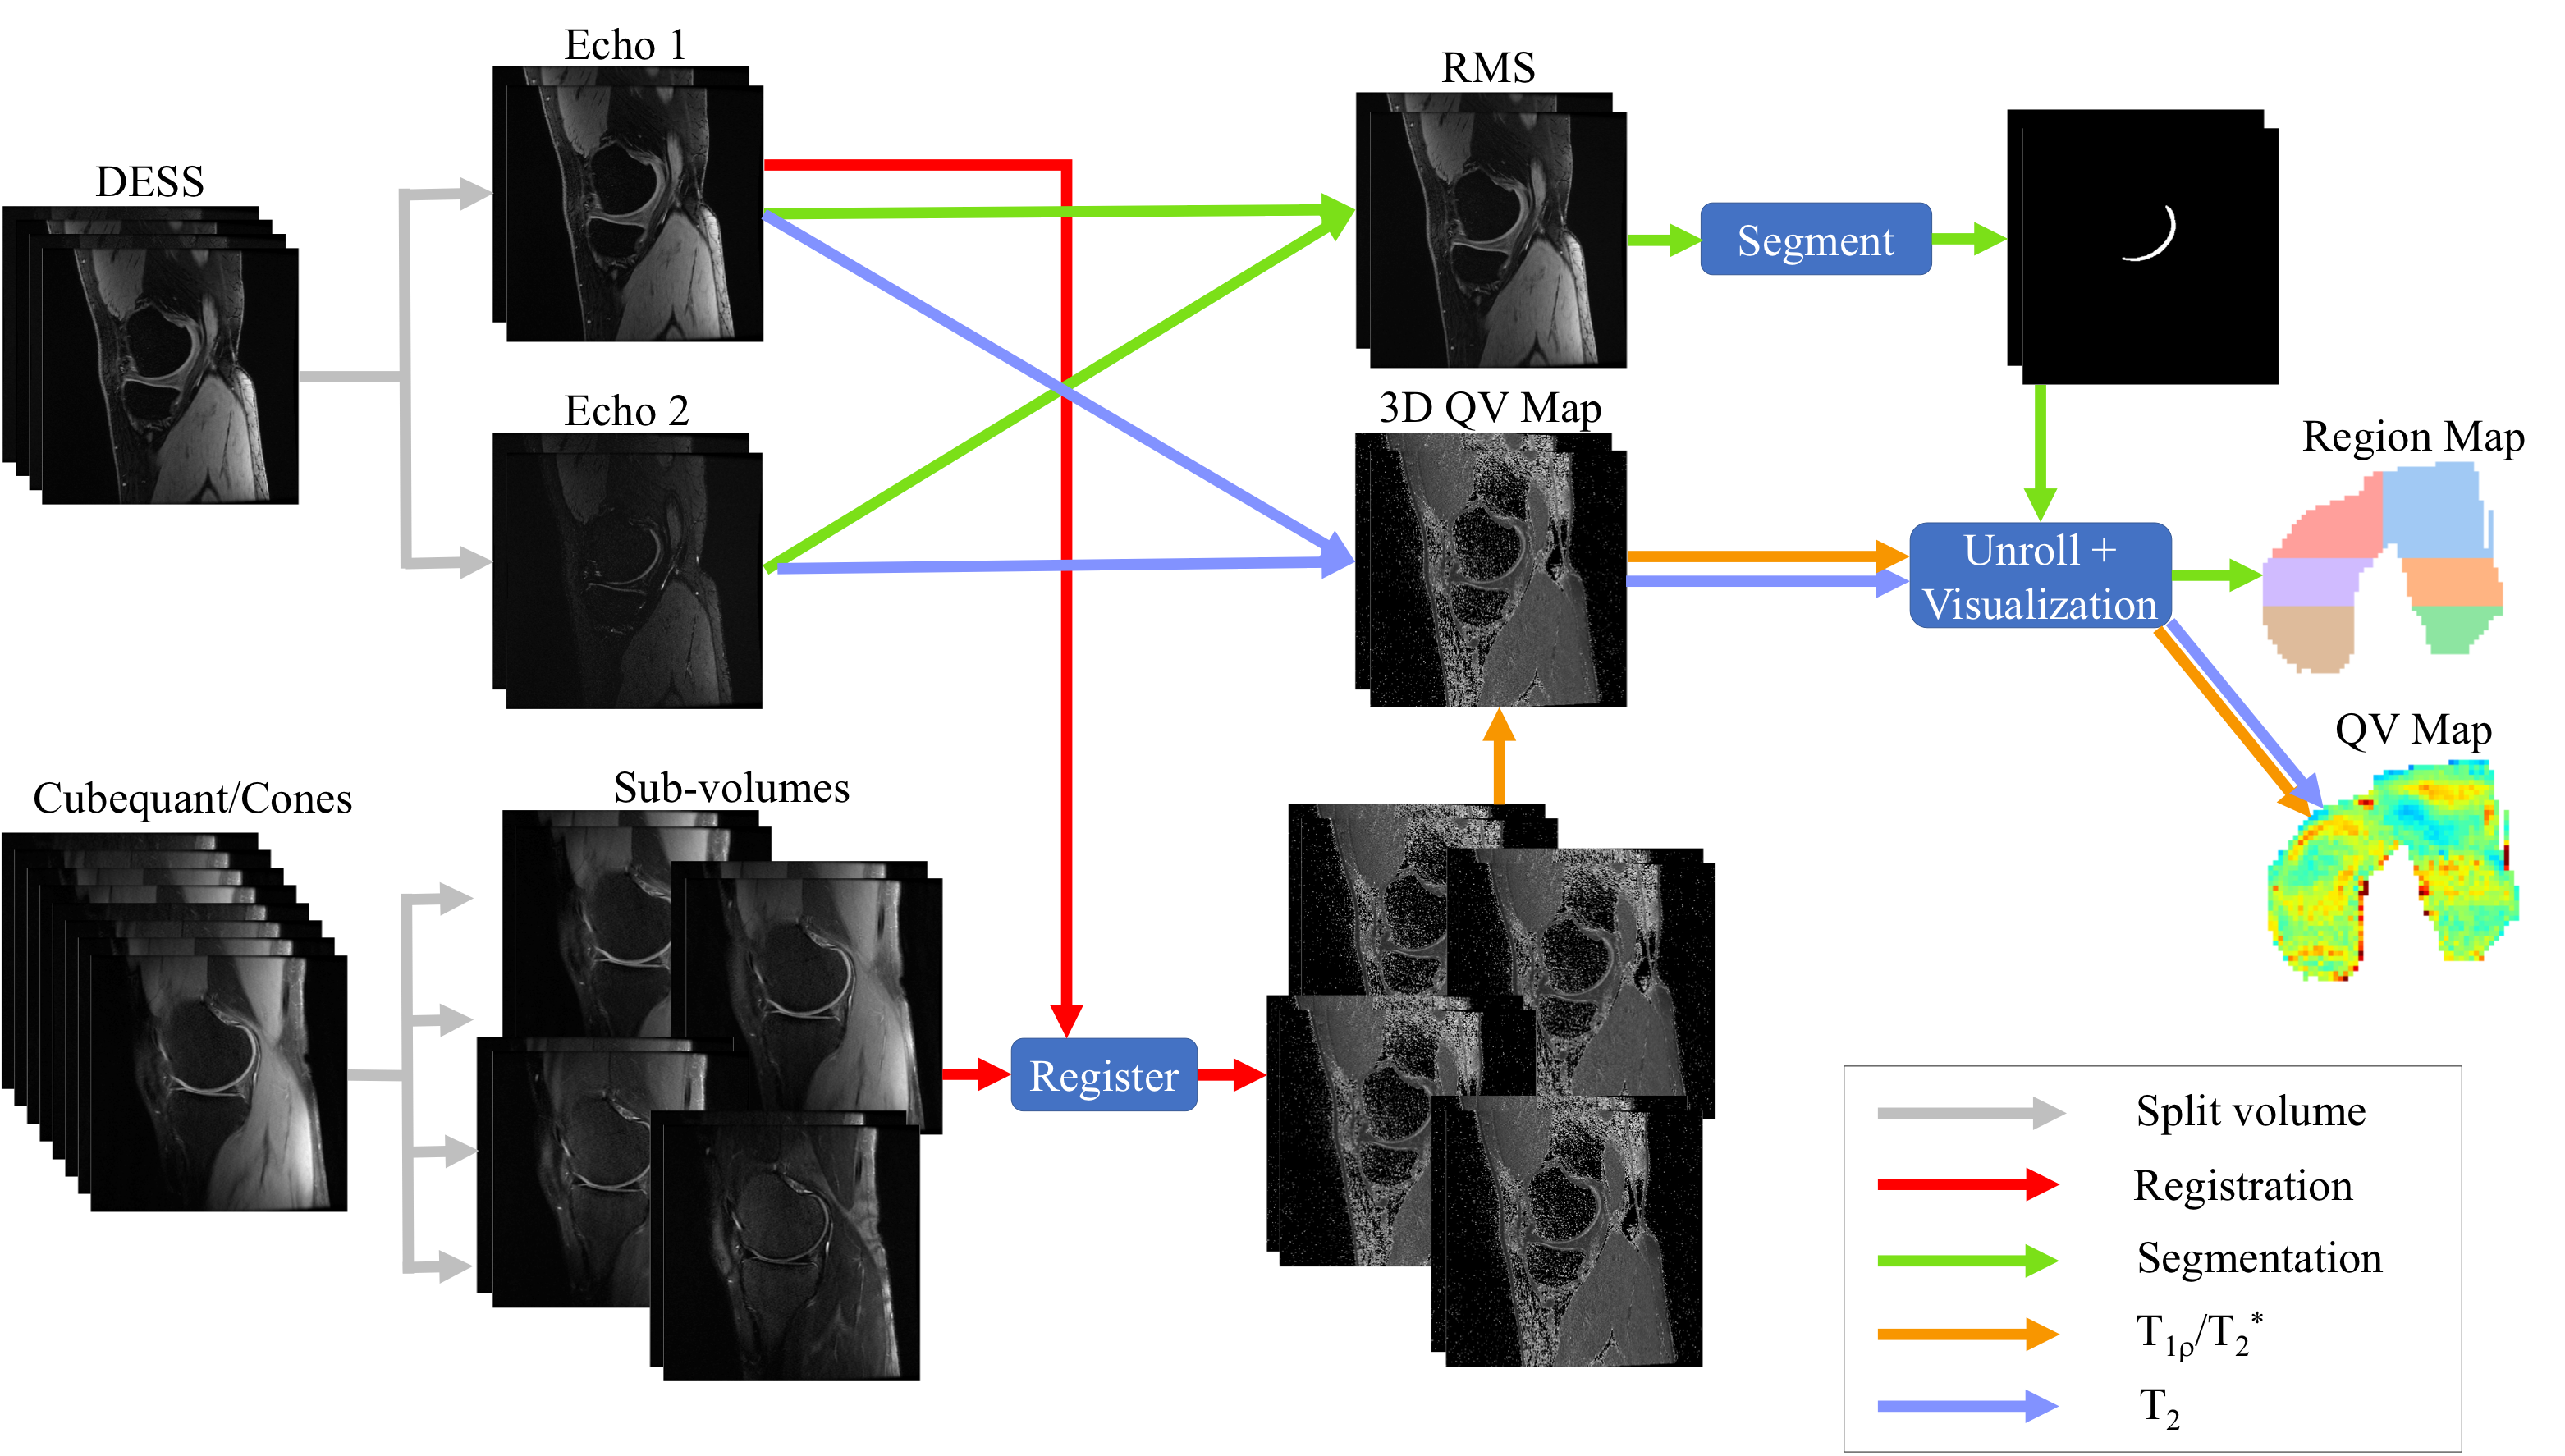
To facilitate the processing of MR scan volumes, DOSMA currently supports the analysis of femoral cartilage using the following quantitative imaging protocols: multi-echo spin-echo, multi-echo gradient-echo, and double-echo in steady-state (DESS). In this specific study, we demonstrate how we utilize DOSMA for quantitative analysis of DESS3 (qDESS), cubequant4 T1ρ, and ultrashort echo time cones5 T2* analysis. Each scan is associated with a set of plausible actions and quantitative value analysis methods (Fig. 1). A flowchart detailing processing features for DOSMA are below (and depicted in Fig. 2).
Automatic segmentation
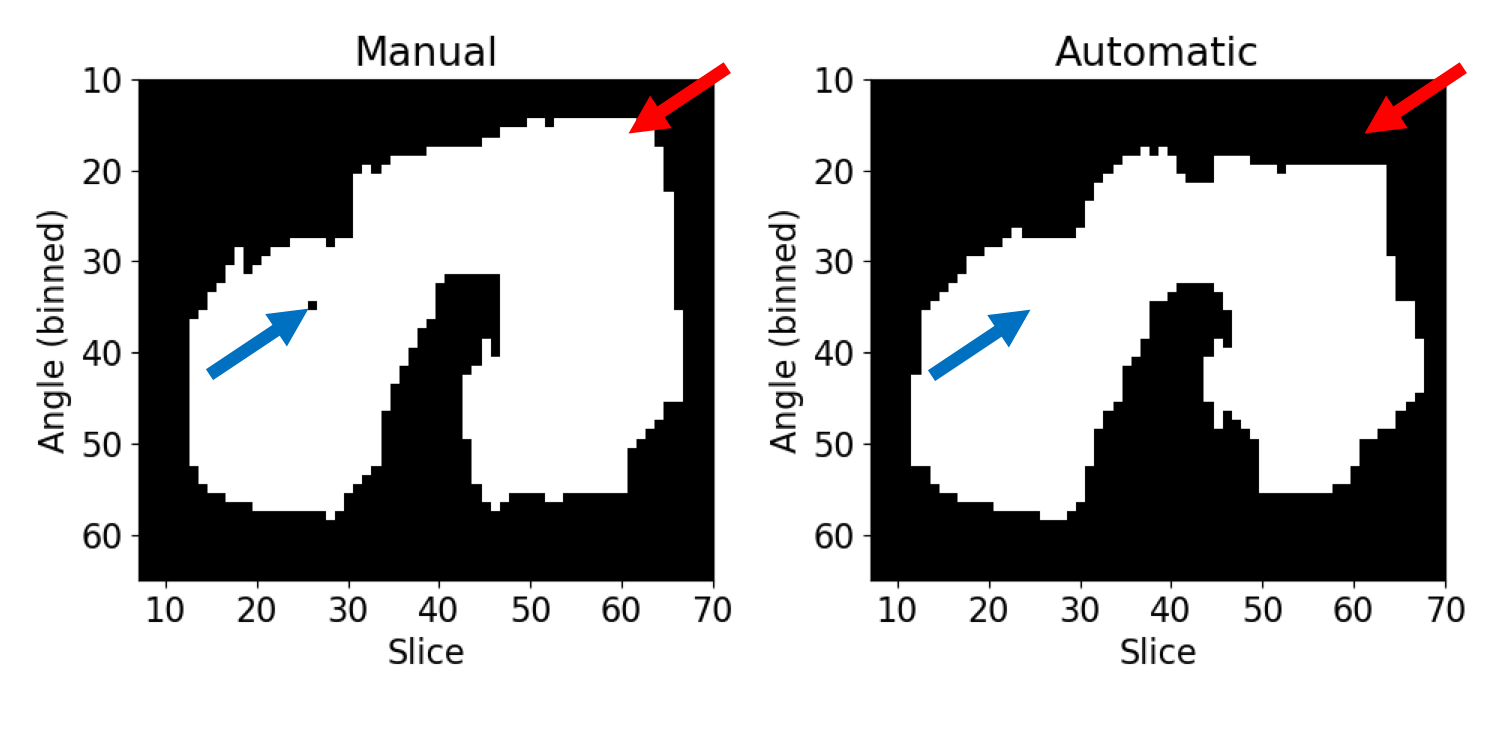
DOSMA leverages an open-sourced, automated femoral cartilage segmentation algorithm, described previously6, for segmenting single-echo DESS from the Osteoarthritis Initiative (OAI) or root-mean-squared images of the qDESS separated echo scans. Scan volumes and segmentation masks are deidentified and stored in a standardized 3D NIFTI format, compatible with prevalent image visualization tools such as ITK-Snap7 and Seg3D8. The algorithm achieved a 90.6% dice score segmentation accuracy on an unseen set of single-echo DESS patient scans from the OAI iMorphics dataset9. The algorithm does have some failure cases (Fig. 3), but DOSMA supports public contributions for improved algorithms.
Automatic registration
DOSMA supports registration both between improperly registered intra-scan and inter-scan volumes. The program supports rigid, affine, and b-spline registration from a moving scan to a target (base) scan using Elastix10 and Transformix10 libraries. For improved spatial registration, the program also accepts a mask, which is dilated to restrict the registration process to the region of interest. In cases where scan volumes are challenging to segment because of low contrast, these volumes can be registered to target scans that can be segmented. As a result, these registered volumes are also well aligned with the segmentation mask.
Quantitative value estimation and visualization
DOSMA supports T2, T1ρ, and T2* estimation that is generalizable to multi-echo spin-echo and multi-echo gradient-echo sequences. qDESS T2 estimation is performed by analytically inverting the DESS signal method, as described previously11. T1ρ and T2* are numerically estimated following a mono-exponential fit. A similar fit for estimating T2 with a general multi-echo spin-echo can be easily extended under the framework.
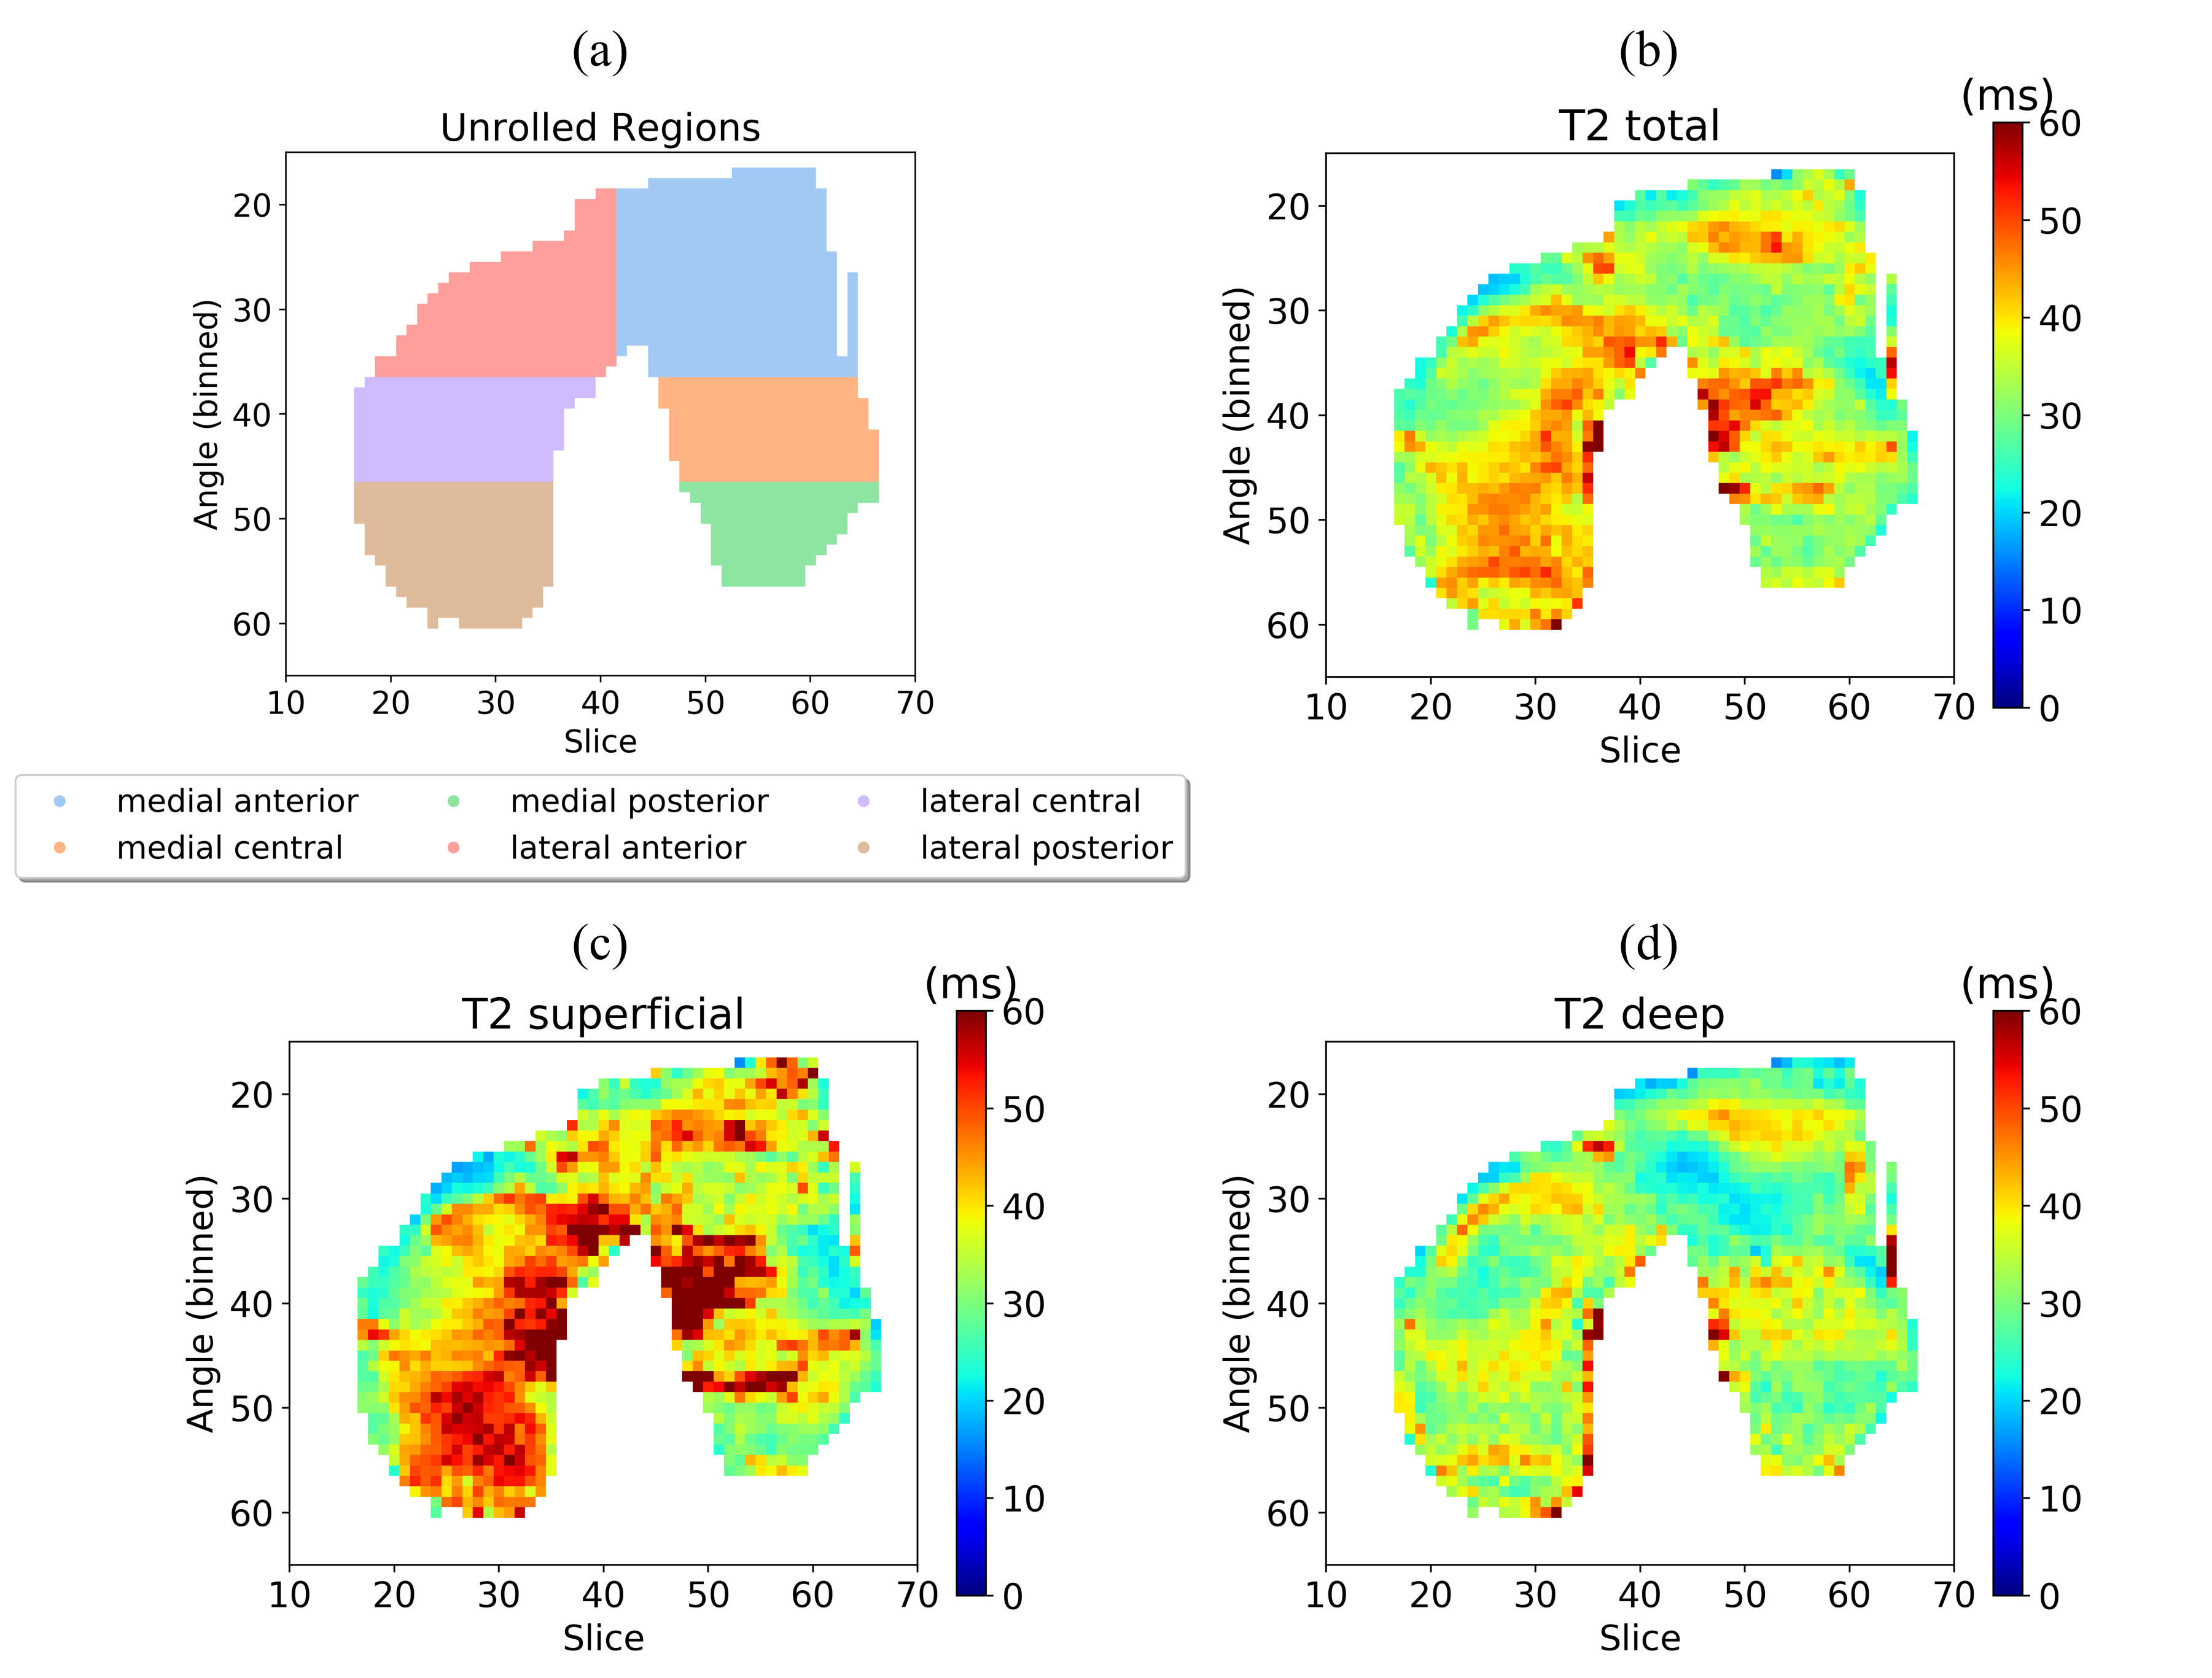
To better visualize the complex 3D tissue surface of femoral cartilage, the cartilage surface is projected onto 2D planes12 and divided into deep/superficial, medial/lateral, and anterior/central/posterior regions12,13. All visualization images are deidentified and stored in the PNG format for easy display. Mean quantitative values for each region are written to an Excel file. Examples of the region map and corresponding deep, superficial, and total T2 estimation using qDESS are shown in Fig. 4.
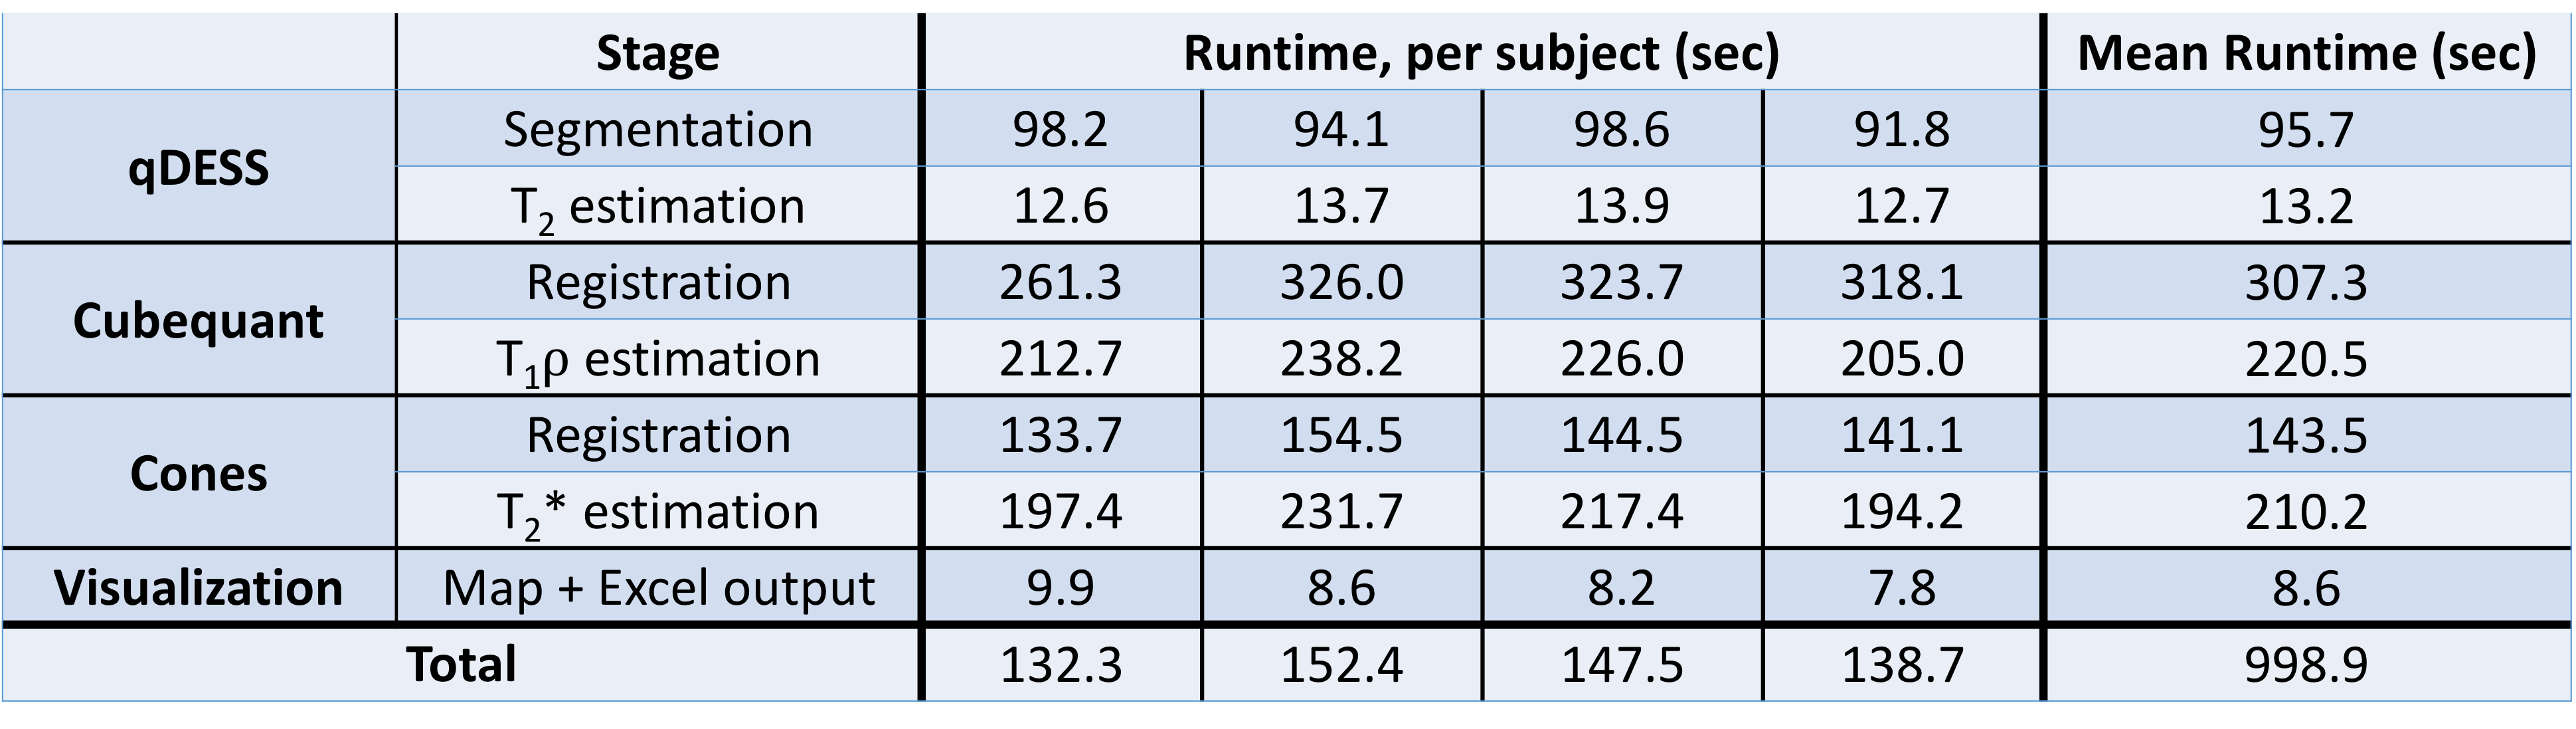
Mean computational time for processing 80-slice qDESS, 72-slice cubequant, and 28-slice cones scan volumes acquired from four patients following IRB protocol was 16.7 CPU minutes, where a bulk of the computational time was spent on registration and mono-exponential fitting. However, femoral cartilage segmentation, a traditionally time-consuming manual task, in the qDESS volume averaged only 1.6 minutes. A detailed subdivision of computational times is shown in Fig. 5.
Conclusion
We have presented DOSMA, a publicly-available framework for musculoskeletal MR processing. The flexible framework is designed to be easily extendable to support analysis for different scanning protocols and tissue regions. We encourage collaborators to submit pull requests to the GitHub repository (https://github.com/ad12/DOSMA) to add functionality. By centralizing support for features such as segmentation, registration, and streamlined quantitative value estimation and visualization, DOSMA enables a one-shot image-processing framework that can automate tedious MR processing and can facilitate quantitative analysis of musculoskeletal tissues.
Acknowledgements
Research support provided by NIH AR0063643, NIH EB002524, NIH AR062068, NIH EB017739, NIH EB015891, and Philips.References
[1] Li X, Pai A, Blumenkrantz G, Carballido‐Gamio J, Link T, Ma B, Ries M, Majumdar S. Spatial distribution and relationship of T1ρ and T2 relaxation times in knee cartilage with osteoarthritis. Magnetic Resonance in Medicine: An Official Journal of the International Society for Magnetic Resonance in Medicine 2009;61(6):1310-1318.
[2] Williams A, Qian Y, Golla S, Chu C. UTE-T2∗ mapping detects sub-clinical meniscus injury after anterior cruciate ligament tear. Osteoarthritis and cartilage 2012;20(6):486-494.
[3] Chaudhari AS, Black MS, Eijgenraam S, Wirth W, Maschek S, Sveinsson B, Eckstein F, Oei EH, Gold GE, Hargreaves BA. Five‐minute knee MRI for simultaneous morphometry and T2 relaxometry of cartilage and meniscus and for semiquantitative radiological assessment using double‐echo in steady‐state at 3T. Journal of Magnetic Resonance Imaging 2018;47(5):1328-1341.
[4] Nguyen MLH, Chen W, Gold GE. Quantitative Assessment of Cartilage Using CubeQuant. 2012; Melbourne.
[5] Qian Y, Williams AA, Chu CR, Boada FE. Multicomponent T2* mapping of knee cartilage: technical feasibility ex vivo. Magnetic resonance in medicine 2010;64(5):1426-1431.
[6] Chaudhari A, Fang Z, Lee J, Gold G, Hargreaves B. Open-Sourced Deep-Learning for Cartilage and Meniscus Segmentation. 2018; Menton.
[7] Yushkevich PA, Gao Y, Gerig G. ITK-SNAP: An interactive tool for semi-automatic segmentation of multi-modality biomedical images. 2016. IEEE. p 3342-3345.
[8] Seg3D C. Volumetric image segmentation and visualization. Scientific Computing and Imaging Institute (SCI) 2013.
[9] Peterfy C, Schneider E, Nevitt M. The osteoarthritis initiative: report on the design rationale for the magnetic resonance imaging protocol for the knee. Osteoarthritis and cartilage 2008;16(12):1433-1441.
[10] Klein S, Staring M, Murphy K, Viergever MA, Pluim JP. Elastix: a toolbox for intensity-based medical image registration. IEEE transactions on medical imaging 2010;29(1):196-205.
[11] Sveinsson B, Chaudhari A, Gold G, Hargreaves B. A simple analytic method for estimating T2 in the knee from DESS. Magnetic resonance imaging 2017;38:63-70.
[12] Monu UD, Jordan CD, Samuelson BL, Hargreaves BA, Gold GE, McWalter EJ. Cluster analysis of quantitative MRI T2 and T1ρ relaxation times of cartilage identifies differences between healthy and ACL-injured individuals at 3T. Osteoarthritis and cartilage 2017;25(4):513-520.
[13] Black MS, Young K, Chaudhari AS, Sveinsson B, Kogan F, Monu U, McWalter E, Levenston M, Gold GE, Hargreaves BA. T2-mapping of Femoral Cartilage 3-months Following ACL Reconstruction Surgery. 2018; Paris, France.
Figures