1130
Tumor-Specific Self-Assembly of DiaCEST Nanoparticles as Theranostic Agents1Johns Hopkins University, Baltimore, MD, United States, 2Chinese Academy of Sciences, Beijing, China, 3Kennedy Krieger Institute, Baltimore, MD, United States
Synopsis
We employed a tumor-specific enzyme (furin)-mediated conversion of the anti-cancer and CEST MRI-visible drug olsalazine (Olsa), which resulted in the formation of self-assembled intracellular nanoparticles in tumor cells. In vivo studies using high-furin and low-furin expressing human xenografts showed that the OlsaCEST signal and anti-tumor therapeutic effect were 5 to 6-fold increased compared to single olsalazine molecules. An excellent “theranostic correlation” (R2 = 0.97) could be observed between the magnitude of the CEST MRI signal and therapeutic response (normalized tumor size).
Introduction
A concentration of labile protons in the millimolar range is needed for the detection of diaCEST agents. To enhance the sensitivity and signal-to-noise ratio, a novel strategy may be to employ molecular self-assembly of nanoscale/microscopic structures (1-3), which has not been explored yet for designing diaCEST contrast agents. Cell-specific enzyme-mediated intracellular self-assembly of nanoparticles (NPs) can increase the local concentration of CEST contrast agents, increasing sensitivity while minimizing non-target toxicity. Our goal was to develop a tumor-specific enzyme-responsive theranostic platform for tumor imaging and therapy. To this end, we conjugated the small molecule anti-cancer drug olsalazine(Olsa) to RVVR as a cleavable substrate for the tumor-specific enzyme furin. Belonging to the group of salicylates, the hydroxyl proton on olsalazine provides a distinct CEST signal at 9.8 ppm away from water. We hypothesized that the catalyzed intracellular formation of Olsa-NPs may enhance the intracellular concentration of olsalazine, prolong its retention time and anti-tumor effcet, and provide an amplified OlsaCEST signalMethods
NU/J nude mice (female, 6-8 weeks, n=20) were subcutaneously injected with 1×10⁶ HCT116 (furin-overexpressing) human tumor cells in the left flank and 1×10⁶ LoVo (low furin-expressing) human tumor cells in the right flank. When the tumor reached a volume of 100-200 mm3, 0.2 mmol/kg bw RVRR-OLSA or 0.2 mmol/kg bw OLSA was injected i.v. In vivo CEST MRI was performed at different time points using a 11.7 T Bruker horizontal scanner. A modified RARE sequence with a saturation pulse of B1=3.6 µT/4 s and a 1 mm slice thickness and 3.2×3.2 cm field-of-view was used. When the tumor volume reached 50-100 mm3, animals were randomly divided into three groups (n=4 for each group), and 0.1 mmol/kg RVRR-OLSA, 0.1 mmol/kg OLSA, or PBS only (as control) was injected 8 times with 3-day intervals. Three-dimensional structured illumination microscopy (3D-SIM) was used to prove the existence of self-assembled nanoparticles within tumor cells in vivo.Results
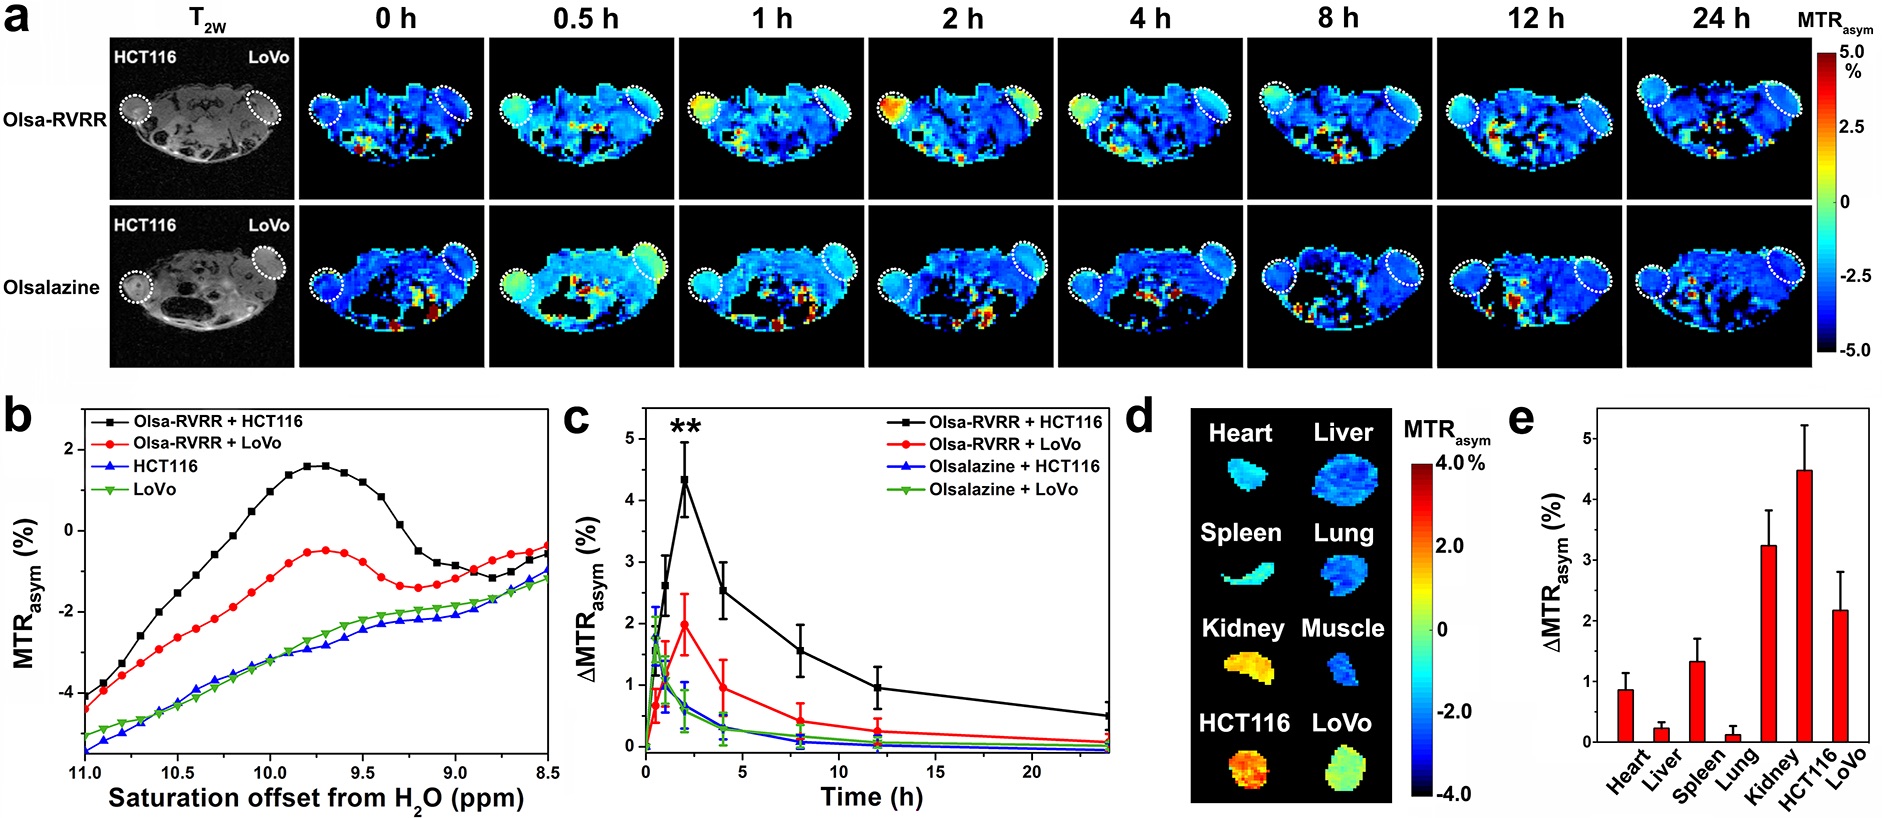
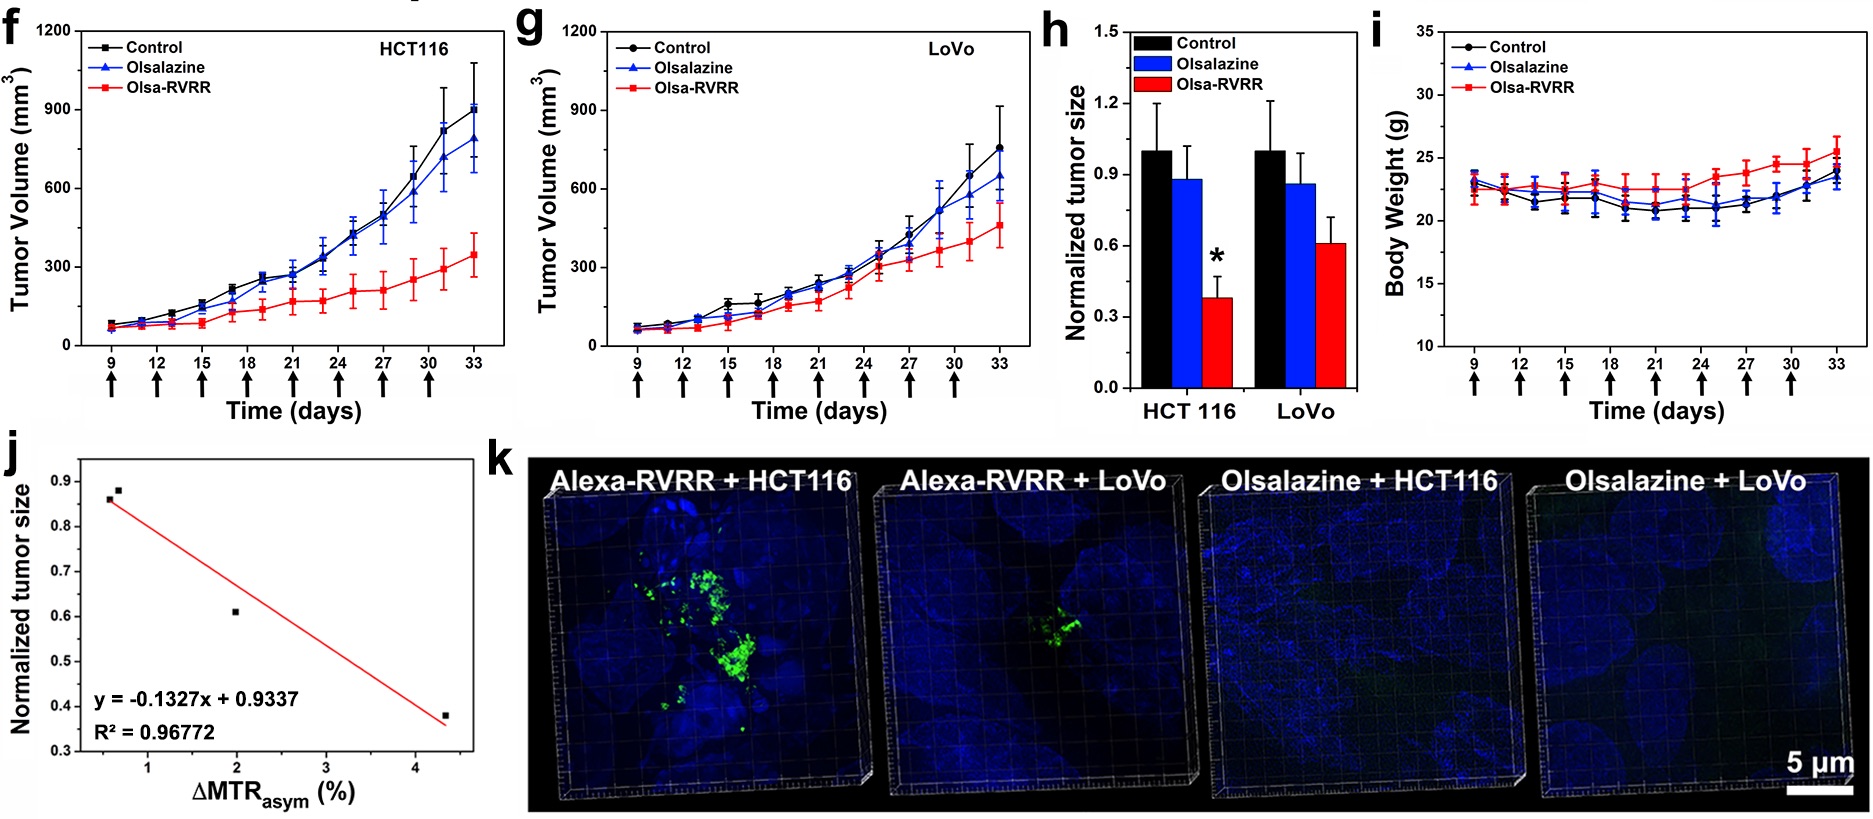
Serial CEST MRI was obtained over 24 h to determine the time course of substrate uptake within the tumors (Figs. 1a-c). The OlsaCEST contrast was higher for HCT116 compared to LoVo for all time points. For HCT116, a maximum OlsaCEST signal increase of 4.3% was observed at 2 h post-injection (p.i.) of Olsa-RVRR, which was two-fold higher than that for the LoVo tumor (2.0%) at this time point. In contrast to LoVo, OlsaCEST signal could still be detected in the HCT116 tumor at 24h p.i. For the olsalazine group, no significant signal differences were detected between the tumors at any time point. In order to assess the overall body biodistribution of the two substrates, mice were sacrificed at 2 h p.i. for Olsa-RVRR or 0.5 h p.i. for olsalazine, organs were collected, and conducted ex vivo CEST imaging. Mice injected with Olsa-RVRR showed the highest OlsaCEST signal in HCT116 tumor among the organs, followed by the kidney (Figs. 1d,e). These ex vivo data are consistent with the in vivo imaging results. We then studied the anti-tumor treatment effect. The Olsa-RVRR substrate showed a more effective inhibition of tumor growth compared to olsalazine for both the HCT116 and LoVo tumor, resulting from the enhanced intracellular tumor retention of olsalazine, in agreement with the above CEST MRI results (Figs. 1f-h). Compared to the PBS control group set at 100%, at day 33 the average volume of the HCT116 and LoVo tumor reduced to ~38% and 61%, respectively, for the Olsa-RVRR-treated group, and to ~88% and 86% for the olsalazine-treated group. Mice did not show any differences in body weight, in support of a tumor-specific toxicity (Fig. 1i). An excellent “theranostic correlation” (R2=0.97) was found between the magnitude of the OlsaCEST signal and therapeutic response (normalized tumor size) (Fig. 1j). 3D-SIM imaging showed a much higher quantity of green fluorescent nanoparticles inside Alexa-RVVR-treated HCT116 tumors compared to LoVo tumors, while a very week green fluorescence was detected for animals injected with Alexa 488 only (Fig. 1k).Conclusions
In vivo studies using HCT116 and LoVo murine xenografts showed that the OlsaCEST signal and anti-tumor therapeutic effect were 6.5-fold and 5.2-fold increased, respectively, compared to olsalazine without RVRR modification, with an excellent “theranostic correlation” (R2 = 0.97) between the magnitude of the imaging signal and therapeutic response (normalized tumor size). This furin-targeted MRI-detectable platform has potential for imaging tumor aggressiveness, drug accumulation, and therapeutic response.Acknowledgements
No acknowledgement found.References
1. Yang Z, Liang G, Xu B. Enzymatic hydrogelation of small molecules. Acc Chem Res 2008;41(2):315-326.
2. Aliprandi A, Mauro M, De Cola L. Controlling and imaging biomimetic self-assembly. Nat Chem 2016;8(1):10-15.
3. Tu Y, Peng F, Adawy A, Men Y, Abdelmohsen LK, Wilson DA. Mimicking the Cell: Bio-inspired functions of supramolecular assemblies. Chem Rev 2016;116(4):2023-2078.
Figures