1129
Synthesis of standard dose FDG PET images from low dose acquisition using a combination of atlas and CNN based method1Electrical and Computer Systems Engineering, Monash University, Monash, Australia, 2Computer Science and Engineering, Indian Institute of Technology, Bombay, Mumbai, India, 3IITB-Monash Research Academy, Mumbai, India, 4Monash Biomedical Imaging, Monash, Australia
Synopsis
Radiation exposure in positron emission tomography (PET) examination is a major issue for patient safety. PET image quality is severely degraded if low dose of radioactive tracer is administered. With a simultaneous magnetic resonance (MR)-PET scanner, MR anatomical priors can potentially improve PET image reconstruction. In this work, we introduce a framework to synthesize high quality standard dose PET images from the low dose PET and T1 MR images using an atlas guided convolutional neural network (CNN) approach. Compared with the conventional methods, the introduced method demonstrates improved PET image quality for datasets acquired with ten-fold PET dose reduction.
Introduction
Radiation exposure in PET scans is a major issue for patient safety. Reducing radiation dose in PET scans can exponentially decrease the signal to noise ratio (SNR) and the interpretation of the PET images becomes very challenging1. The synthesis of a standard dose (SDPET) image from a low dose (LDPET) image has been explored by using denoising methods1 , MRI anatomical prior based methods2,3, and deep learning methods (e.g. convolution neural networks (CNN)). Atlas based methods (AM) have previously been used to synthesize image contrasts4,5. However, it has not yet been used for synthesizing PET images. Compared with CNN, AM uses less complex models and requires lesser amount of training datasets. However, AM demonstrates low subject specificity, since the output is directly synthesized from the training database4,5. CNN, on the other hand, is able to learn complex non-linear mapping between images and hence better at tackling subject specific characteristics than AM1,3. However, CNN requires a large amount of training data for generalizability. We propose a joint framework of AM and CNN, termed AM-CNN, to improve the quality of the synthesized SDPET. The performance of AM-CNN is evaluated using experiments with ten-fold dose reduction.Method
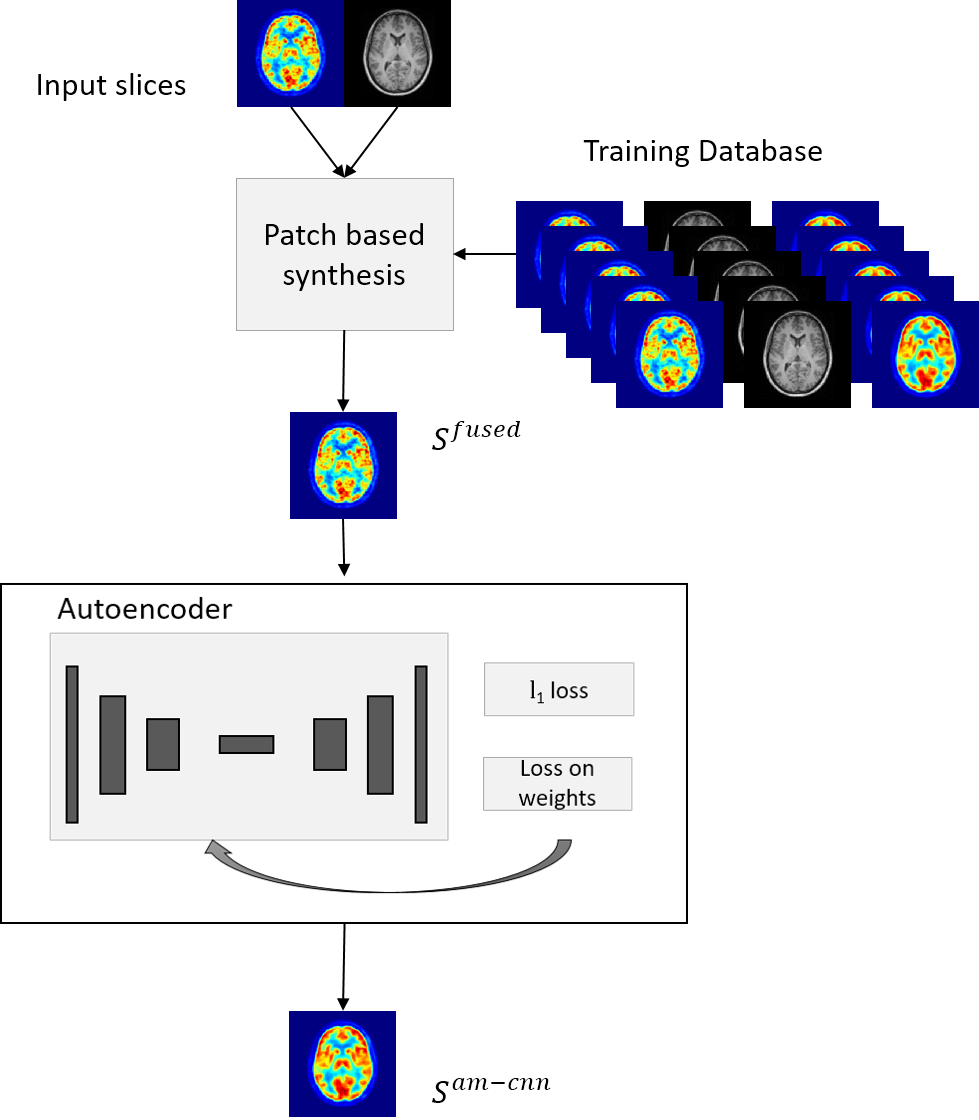
As shown in Figure 1, AM-CNN comprises of two components for accurate SDPET image synthesis: 1) AM based image fusion and 2) CNN based synthesis. The fused image from stage-1 $$$(S^{fused})$$$, is part of input to the CNN. Consider a database of training images, $$$\{L^{db}, S^{db}, M^{db}\}_{i=1}^{N}$$$ where $$$L, S, M$$$ represent the corresponding slices of LDPET, SDPET and MRI structural images in the database (db) respectively. Let $$$L^{test}, M^{test}$$$ represent the set of LDPET and MRI scans of incoming subject.
Atlas based image fusion:
Every pixel in $$$S^{fused}$$$ is populated as: $$$S^{fused}(x) = \frac{(L^{test}(x) + S^{db}_{n}(x))}{\gamma}$$$ where $$$S^{db}_{n}$$$ is the solution to: $$$\min_{S^{db}_{n}} \beta \|R_{x}(S^{fused}) - R_{x}(S^{db}_{n})\|_2^2 + (1-\beta) \|R_{x}(M^{test}) - R_{x}(M^{db}_{n})\|_2^2 \forall x$$$.
Here, $$$R_x$$$ extracts a patch (e.g. 3 x 3) around pixel . The search is conducted for multiple iterations (here 3) and $$$\beta$$$ is tuned for highest structural similarity index (SSIM)6. The weight $$$\gamma$$$ is empirically chosen as 2, which can also be determined during the optimization above.
Network Architecture:
A four layer autoencoder with standard convolution + max pooling in the encoder stage and convolution + up-sampling in the decoder stage was constructed along with skip connections. ReLu (rectified linear unit, $$$f(x) = \max(0,x)$$$ activation and batch normalization were used after each encoding layer. The input to the CNN is multi-channel image with channels: 1) $$$S^{fused}$$$ and 2) $$$M^{test}$$$. We employed l1 loss on images and l2 loss on network parameters for generalizability.
$$$loss(w) = \sum_{i=1}^{N} \|f(S;w)-S^{db}_{n}\|_{1} + \lambda\|w\|_2^2$$$
where $$$w$$$ are the network weights of the CNN.
Data Acquisition
Fifteen healthy subjects underwent simultaneous MRI and 18-F fludeoxyglucose (FDG) PET on a 3T Siemens Biograph mMR (approved by institute ethics committee). Each subject was infused with 240±14MBq of 18-F FDG. T1 MPRAGE was simultaneously acquired during PET scan. The PET list-mode data were binned into 600s and 1800s frames which were used as low and standard dose data respectively. PET images were reconstructed using OSEM with 3 iterations and 21 subsets. We retained 30% of the datasets for the testing stage and remaining were used for training.
Evaluation of synthesized images:
We evaluate SDPET image synthesized from three methods: i) $$$(S^{atlas})$$$ from AM ii) $$$(S^{cnn})$$$ from CNN using $$$L^{test}, M^{test}$$$ as inputs, and iii) $$$(S^{am-cnn})$$$ using AM-CNN method. Relative root mean-squared error (RRMSE) and SSIM were used to quantify performance.
Results and discussion
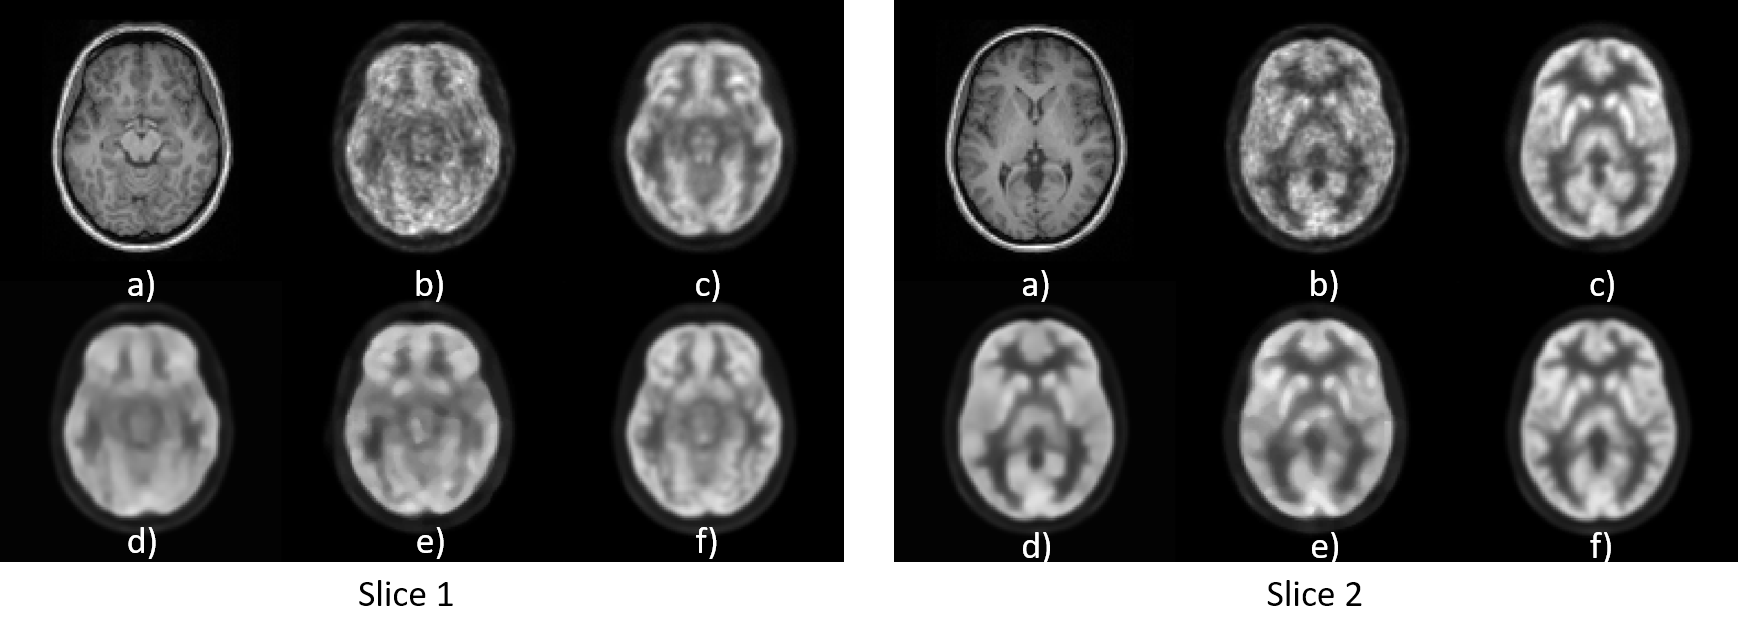
The inputs (LDPET and MRI) and the estimated SDPET images are shown in Figure 2. In both slices, $$$(S^{am-cnn})$$$ (Figure 2(e)) is very similar to reference images in Figure 2(c), whereas $$$(S^{cnn})$$$ (Figure 2(d)) shows severe under-estimation of the FDG activity and $$$(S^{atlas})$$$ (Figure 2(e)) has patchy and blurring artefacts. $$$(S^{am-cnn})$$$ preserves contrast and demonstrates significantly improved anatomical details in the white and grey matter. The image is slightly blurred compared to the reference image and further work will address this issue.
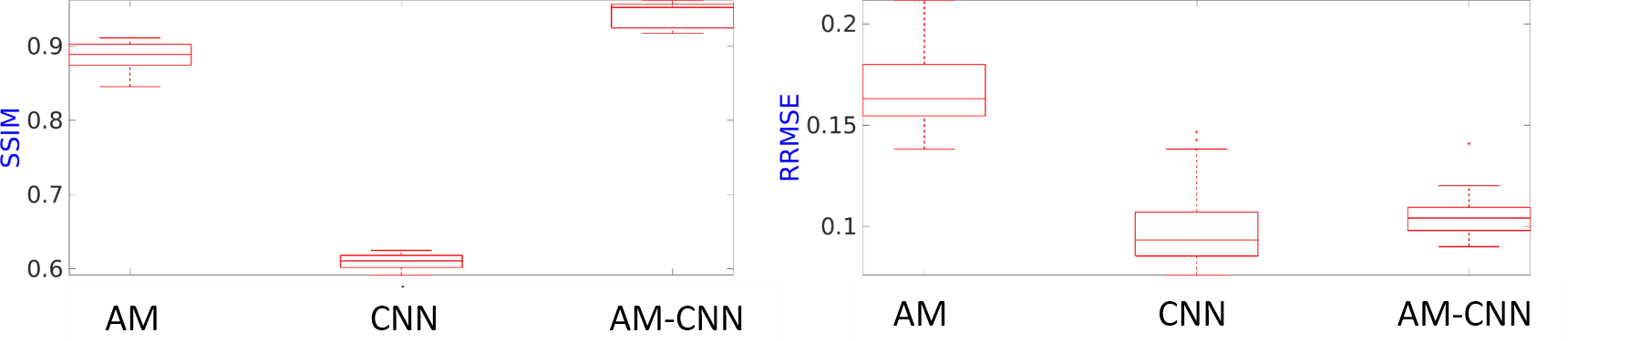
Quantitative performance of each method was evaluated on 30 slices of two subjects (Figure 3). The AM-CNN image shows the highest SSIM score (>90%) whereas the CNN image has significantly lower SSIM score (~60%) due to the blurring artefacts. In terms of RRMSE, AM-CNN performs significantly better (50%) than AM, and only lightly worse (2-3%) than CNN images.
Conclusion
In this work, we have introduced a novel method, AM-CNN, to synthesize high quality SDPET from LDPET and T1 MRI images. The proposed method provides more accurate estimation of PET images compared to both CNN and AM. The effectiveness of the proposed method has been evaluated using an FDG PET experiment with ten-fold dose reduction.Acknowledgements
No acknowledgement found.References
1. Kim K, Wu D, Gong K, Dutta J, Kim JH, Son YD, Kim HK, El Fakhri G, Li Q, “Penalized PET Reconstruction Using Deep Learning Prior and Local Linear Fitting,” IEEE Trans. Med. Imaging, vol. 37, no. 6, pp. 1478–1487, 2018.
2. Wang Y, Ma J, An L, Shi F, Zhang P, Lalush DS, Wu X, Pu Y, Zhou J, Shen D, “Semisupervised Tripled Dictionary Learning for Standard-Dose PET Image Prediction Using Low-Dose PET and Multimodal MRI,” IEEE Trans. Biomed. Eng., vol. 64, no.3, pp. 569–579, 2017.
3. Xiang L, Qiao Y, Nie D, An L, Wang Q, Shen D, “Deep auto-context convolutional neural networks for standard-dose PET image estimation from low-dose PET/MRI,” Neurocomputing, vol. 267, pp. 406–416, 2017.
4. Ye DH, Zikic D, Glocker B, Criminisi A, and Konukoglu E, “Modality propagation: Coherent synthesis of subject-specific scans with data-driven regularization,” Med. Image Comput. Comput. Interv., vol. 8149 LNCS, pp. 606–613, 2013.
5. Torrado-Carvajal A, Heraiz JL, Alcain E, Montemayor AS, Garcia-Canamaque L, Hernandez-Tamames JA, Rozenholc Y, Malpica N, “Fast Patch-Based Pseudo-CT Synthesis from T1-Weighted MR Images for PET/MR Attenuation Correction in Brain Studies,” J. Nucl. Med., vol. 57, no. 1, pp. 136–144, 2015.
6. Wang Z1, Bovik AC, Sheikh HR, Simoncelli EP, “Image quality assessment: From error visibility to structural similarity,” IEEE Trans. Image Process., vol. 13, no. 4, pp. 600–612, 2004.
Figures