1127
Longitudinal & quantitative 3D-R2* MRI validates methimazole-enhanced intranasal delivery of labeled neural stems cells for treatment of glioblastoma.1Radiology & Biomedical Engineering, Northwestern University, Chicago, IL, United States, 2Radiology, Northwestern University, Chicago, IL, United States, 3Neurosurgery, Northwestern University, Chicago, IL, United States
Synopsis
Longitudinal and quantitative 3D-R*2 MRI provides a unique platform for tracking labeled cells in vivo, across subjects and time-points following treatment. In this study we use this approach to demonstrate how FDA approved methimazole can enhance intranasal delivery and accumulation of labeled and therapeutically enhanced neural stem cells in glioma xenografts. 3D rendering of the high resolution quantitative maps across different sessions enhances visualization of the NSC accumulation and provides a unique tool to track the homing-pathway of the stem cells. Results were confirmed by survival data for different groups with the Met+NSC treated group exhibiting increased survival trends.
Introduction.
Stem cell-mediated glioblastoma (GBM) therapies represent one of the few potential new treatment options available for this disease. However this approach is limited in its efficacy due to the fact that GBM develops and progresses behind the blood brain barrier (BBB) hampering its effective targeting. Intranasal delivery (IN) has the potential to bypass the BBB and deliver stem cells to the tumor via different routes1-3. The rapid clearance of the IN administered stem cells however reduces their penetration to the brain. We hypothesized that labeled neural stem cells (NSCs) would more efficiently target intracranial xenografts if the clearance from the nasal cavity was delayed. We attempted this by pharmacological disruption of olfactory epithelium (OE) thickness using FDA approved drug methimazole (MT). Our MRI, ex vivo pathology and survival results suggest that the MT-induced disruption of OE improves non-invasive targeting of GBM in mice. This provides us a future non-invasive, reproducible and safe framework for investigating IN-delivery mode for novel therapeutics that could be leveraged to increase GBM patient treatment opportunities.Methods.
All animal experiments complied with Northwestern’s IACUC guidelines. Patient-derived GBM43 xenograft line (kindly provided by Dr.C.D.James, Northwestern University, Chicago, IL) and U87MG (ATCC) were injected intracranially into the right frontal lobe of 6 to 8 week-old male nude mice (Harlan Laboratories)1. Tumors were allowed to grow for a period of ~7 days and then animals were separated into groups: 1) N=5 MT and 2) N=5 Sal-control (no-treatment). Human NSCs’ clonal cell line HB1.F3.CD (Dr. K Aboody, City of Hope,CA) were labeled with SPIOs as described in 1 and altered via lentiviral transduction to overexpress C-X-C chemokine receptor type 4 (CXCR4) shown to facilitate migration to the brain4 . MT was delivered i.p. 48 hours prior to NSCs IN delivery (50 ug/g of MT in 100 microliters of sterile saline). Labeled NSCs were delivered intranasaly in anesthetized mice ( total of ~5x10⁵ cells). Multiple MRI sessions at 24, 48 and 120h post-NSC IN delivery were conducted on each group. Imaging was conducted under isofluorane anesthesia mixed with 100% O2 and maintaining normal body physiology. The following MRI sequences were used: 1) 2D-TSE (turbo spin echo) tri-axial; TR/TE = 1560/40 ms; voxel size = 0.074x0.074x0.7 mm3); 2) 3D-FLASH-MGRE (TR = 40 ms; multiple TEs = 2.51,6.04,9.57,13.1ms; FA=15; AVG=6; Matrix= 152x256x44; voxel=0.15x0.15x0.15mm3). 3D-R*2 maps were generated usingJim7.0 (Xinapse) to facilitate detection of SPIOs and longitudinal comparison across groups and time-points. Tumor region of interest were delineated using semi-automated threshold 3D-ROI segmentation-tool (ITK-SNAP 3.6.0). Survival data and immunofluorescence detection of viral protein were done to confirm disruption of nasal epithelial in treated mice and to validate MRI results.Results.
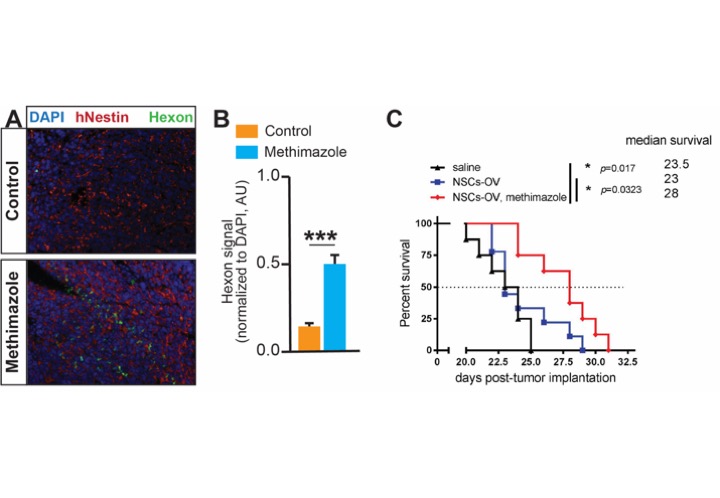
Fig1-A shows a representative transversal MRI slice from a (Met+NSC)-treated mouse compared to a Saline (Sal+NSC) mouse at 120h post IN-administration. The white arrows point to regions of reduced intensity assumed to be regions of accumulated NSCs. Fig1-B depicts a longitudinal view of a Met+NSCs versus Sal+NSC mouse brain. Decrease in signal intensity is observed within tumor of both Met treated and Sal treated mice, albeit we generally observed smaller decreases in Sal group as expected due to less efficient targeting in the latter. The dashed blow-up box shows the tumor outlined in blue and the regions of NSC accumulation in red. Fig1C. depicts 3D surface rendering of the head of a Met+NSC mouse together with rendered tumor morphometry (blue) and locations of NSC’s (red). The 3D isotropic and quantitative visualization approach provides a way to detect the NSC homing pathway across multiple days. A representative pathology section of a met-treated brain is shown in Fig1-E with tumor outlined in blue. Visible in the blow-up inset are some NSCs (blue dots) from Prussian Blue staining. Fig 2.A) show sections of GBM43 tissue from mice that received OV-NSC therapy, B) quantification of hexon signal and C) survival of animal comparison analyzed with log-rank test (n=8-9 per group * p<0.05).Discussion & Conclusions
In this study we explored the ability of quantitative 3D-R*2 MRI to validate the ability of an FDA approved drug (MT) to enhance targeting efficiency of intra-nasally delivered and therapeutically enhanced NSCs. The longitudinal MRI confirmed that this drug, by temporarily and reversibly disrupting the olfactory epithelium allows larger number of NSCs to accumulate in the tumor. The 3D-rendered depiction of tumor morphometry and corresponding patterns of NSC accumulation provide an additional tool to investigate and interpret the homing pathway of the cells. MRI results were confirmed pathologically and through survival comparisons. This data suggests, that acquiring longitudinal 3D isotropic and quantitative R*2-maps has the potential to be an essential tool for further investigation of enhanced delivery methods of therapeutically labeled cells.Acknowledgements
References
1. Balyasnikova IV, Prasol MS, Ferguson SD, Han Y, Ahmed AU, Gutova M, Tobias AL, Mustafi D, Rincon E, Zhang L et al. (2014). Intranasal delivery of mesenchymal stem cells significantly extends survival of irradiated mice with experimental brain tumors. Mol Ther. 22, 140-148.
2. Kozlovskaya L, Abou-Kaoud M, Stepensky D. (2014). Quantitative analysis of drug delivery to the brain via nasal route. J Control Release.189, 133-140.
3. Munster VJ, Prescott JB, Bushmaker T, Long D, Rosenke R, Thomas T, Scott D, Fischer ER, Feldmann H, de Wit E. (2012). Rapid Nipah virus entry into the central nervous system of hamsters via the olfactory route. Sci Rep.2, 736.
4. Dey M, Yu D, Kanojia D, Li G, Sukhanova M, Spencer DA, Pituch KC, Zhang L, Han Y, Ahmed AU et al. (2016). Intranasal Oncolytic Virotherapy with CXCR4-Enhanced Stem Cells Extends Survival in Mouse Model of Glioma. Stem Cell Reports.7, 471-482.
5. Xie F, Zhou X, Genter MB, Behr M, Gu J, Ding X. (2011). The tissue-specific toxicity of methimazole in the mouse olfactory mucosa is partly mediated through target-tissue metabolic activation by CYP2A5. Drug Metab Dispos.39, 947-951.
Figures
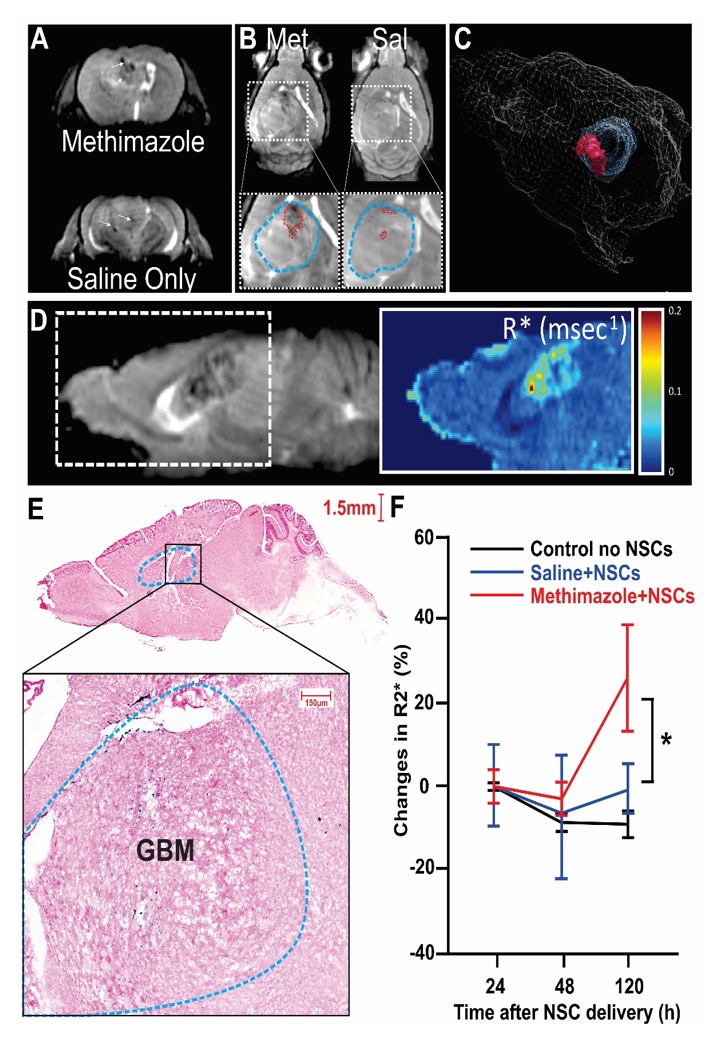
A & B). Transversal & Longitudinal MRI of (Met)-treated versus Saline-control 120h post-administration. Blow-up inset shows show localized intra-tumor signal decreases (red outline inside blue tumor outline) in both Met-NSC and Sal+NSC. However the extent of these low signal regions are much less in control vs treated. D) sagittal view of Met+NSC brain with corresponding R*2 map (inset). High R*2 correspond to accumulated SPIOs. E) ExVivo brain section of Met-NSC mouse. Blue dots correspond to Prussian Blue stained NSCs. F) Quantitative longitudinal plot of average tumor-R*2 for each group and time-point.