1124
Separating chemical shift/exchange from magnetic susceptibility in a phantom1Department of Electrical and Computer Engineering, Seoul National University, Seoul, Korea, Republic of
Synopsis
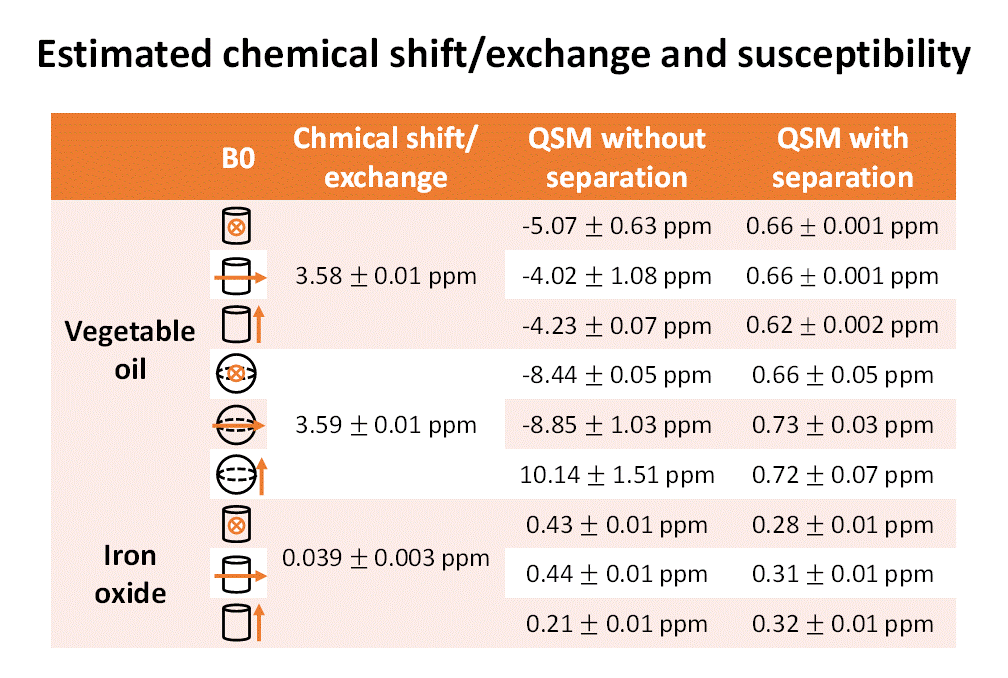
We proposed a new method that separates susceptibility-induced frequency shift from chemical shift/exchange-induced frequency shift in a phantom using three axes scanned datasets. The method was successfully validated in numerical simulation and phantoms and reported susceptibility and chemical shift/exchange in vegetable oil (susceptibility: 0.66±0.02 ppm; chemical shift: 3.58±0.01 ppm) and iron oxide (concentration: 0.025%; susceptibility: 0.30±0.02 ppm; chemical exchange: 0.039±0.003 ppm).
Purpose
The frequency shift or phase image of MRI has been widely used to measure magnetic susceptibility of a material using quantitative susceptibility mapping (QSM)1,2. However, the frequency shift is also known to be affected by chemical shift/exchange3,4, which may introduce errors in the susceptibility estimation. In this study, we developed a simple but effective method that separates the chemical shift/exchange effects from susceptibility effects in a phantom. This new method provides reliable measurements of the magnetic susceptibility and chemical shift/exchange.Methods
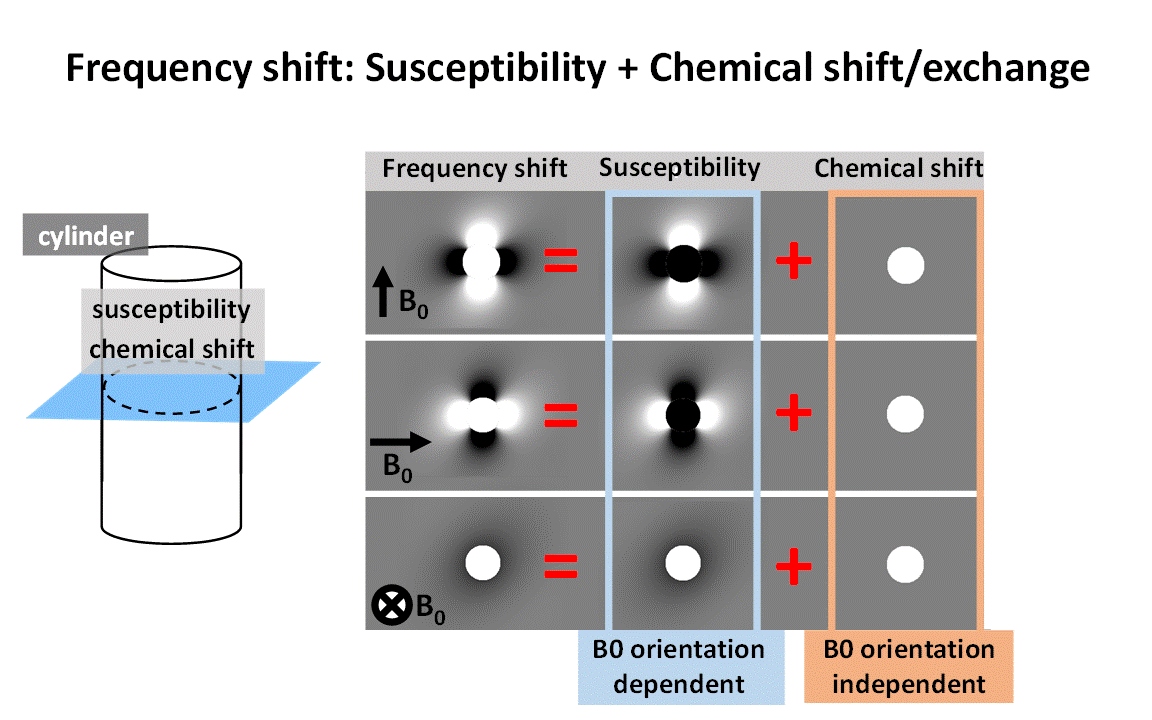
Susceptibility and chemical shift/exchange are the main sources of B0 perturbation. The field perturbation can be modeled as:
$$ΔB=B _{c}+B _{s}=B _{c}+d*\chi\quad\quad\quad\quad\quad[Eq.1] $$
where ΔB is the total field perturbation, Bc is the chemical shift/exchange-induced field, Bs is the susceptibility-induced field, d is a dipole kernel, and χ is (isotropic) magnetic susceptibility (Fig. 1). Since d is a function of the B0 orientation, Bs changes based on the direction of B0 whereas Bc is independent of the B0 direction.
When an object is scanned in the three orthogonal B0 directions (i.e. B0 is applied in x-, y-, z-axis), the dipole kernel becomes as follows:
$$d_{x}=\frac{1}{4\pi}\frac{3cos^2\theta _{x}-1}{r^3},d_{y}=\frac{1}{4\pi}\frac{3cos^2\theta _{y}-1}{r^3},d_{z}=\frac{1}{4\pi}\frac{3cos^2\theta _{z}-1}{r^3}.$$
where the sub-index, x, y, or z, indicates the direction of B0 along the index axis, θ is an angle between a position vector r and B0.
When the three susceptibility-induced fields are summed, they result in a null field:
$$B _{s,x}+B _{s,y}+B _{s,z}=(d _{x}+d _{y}+d _{z})*\chi =(\frac{1}{4\pi}\frac{3(cos^2\theta _{x}+cos^2\theta _{y}+cos^2\theta _{z})-3}{r^3})*\chi=0\quad\quad\quad\quad\quad[Eq.2]$$
,since $$$cos^2\theta _{x}+cos^2\theta _{y}+cos^2\theta _{z}=1$$$ for the three orthogonal axes.
Then, we can measure chemical shift/exchange-induced field directly from Eq.1: $$B _{c}=\frac{1}{3}(ΔB _{x}+ΔB _{y}+ΔB _{z})\quad\quad\quad\quad\quad [Eq.3] $$
Finally, the susceptibility-induced field can be calculated as follows:
$$B _{s}=ΔB-B _{c}\quad\quad\quad\quad\quad [Eq.4]$$
When applying the method to an object with geometric symmetry (e.g. sphere), one may acquire less dataset and the acquired image can be rotated.
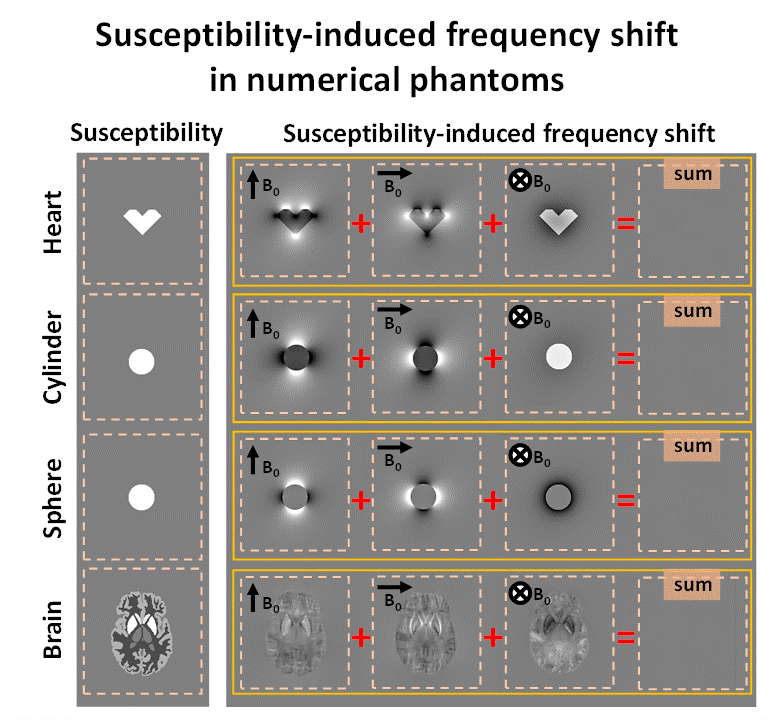
[Simulation] To validate Eq.2, four numerical phantoms in the shape of heart, cylinder, sphere, and brain5 were tested (Fig. 2). In each phantom, certain susceptibility values were assigned with zero chemical shift/exchange. The susceptibility-induced frequency shift maps were generated using the Fourier-based method6.
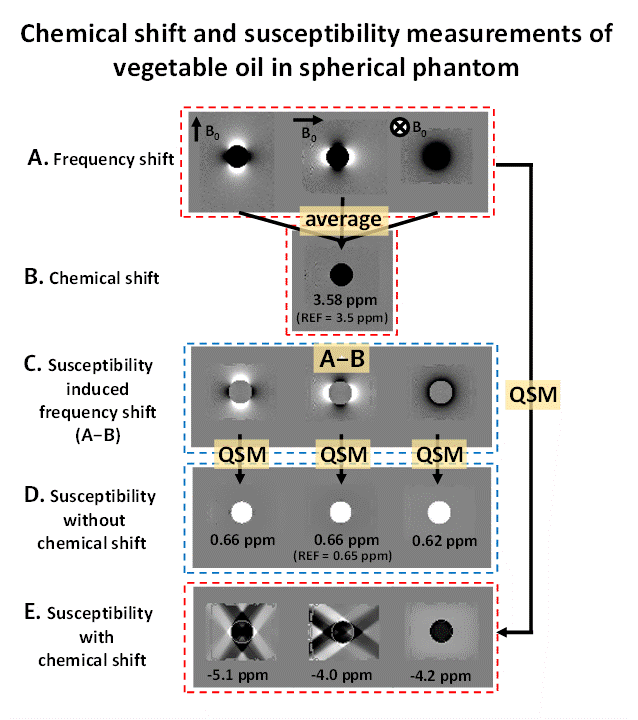
[Experiment] For the experimental validation, vegetable oil with known chemical shift (3.5 ppm7) and susceptibility (0.65ppm8) was chosen as a model. The oil was filled in a sphere- and cylinder-shaped containers. A GRE sequence (voxel size=2×2×2mm3, TR=53ms, and TE=1.5:0.92:9.78 ms) was scanned twice with the opposite gradients to cancel out eddy current effects9. To remove the background field, reference data without the oil was acquired and subtracted8. Because of the geometric symmetricity of the cylinder and sphere, the scans were performed for one axis for the sphere and two axes for the cylinder.
The separation of the susceptibility and chemical shift is illustrated in Fig.3. After generating the local field map, the three orientation field maps (Fig.3A) were registered and averaged, generating the chemical shift-induced frequency shift map (Fig.3B). From this map, the chemical shift of the oil was measured. Then the map was subtracted from the three orientation maps, resulting in the frequency shift maps solely from the susceptibility of the oil (Fig.3C). Then, the frequency shift maps were reconstructed to the susceptibility maps10 (Fig.3D).
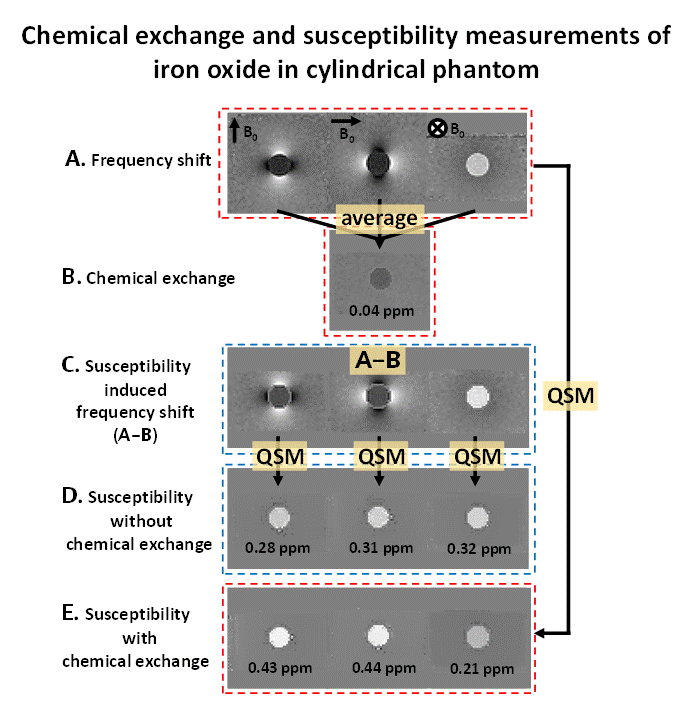
Another material, iron oxide (2.5%,ProMag 1 Series,Bangs), was tested. The iron oxide (25ppm) was mixed with 1.5% agarose in the cylindrical container. The same procedure was utilized to measure susceptibility and chemical shift/exchange (Fig.4).
Results
The numerical simulation demonstrates that susceptibility-induced frequency shifts from the three B0 orientations cancelled out perfectly regardless of the shapes (Fig.2).
In the phantom study, we successfully separated susceptibility from chemical shift/exchange (Figs.3 and 4). For both cylinder- and sphere-shaped phantoms, the estimated chemical shift of the oil was 3.58±0.01ppm, which was close to the literature value (3.5ppm). The susceptibility of the oil showed consistent measurements (0.67±0.03ppm; Table1) that were close to the reference (0.65ppm). When susceptibility was reconstructed without chemical shift separation, severe streaking artifacts were observed (Fig. 3E) and the measured susceptibility values are incorrect (-3.41±6.96ppm). For the cylinder-shaped iron oxide phantom, the chemical exchange, which was not reported previously, was measured as 0.039±0.003ppm. The susceptibility measurements without exchange (0.30±0.02ppm) were more consistent than those with exchange (0.36±0.13ppm), demonstrating the effectiveness of the proposed method.
Conclusion and Discussion
In this work, we demonstrated a new method that separates susceptibility from chemical shift/exchange in a phantom. Estimated chemical shift/exchange and susceptibility were validated using the reference values. The method has potential as a reference method to measure chemical shift/exchange and magnetic susceptibility.Acknowledgements
This work was supported by the National Research Foundation of Korea(NRF) grant funded by the Korea government(MSIT) (No. 2018R1A2B3008445).References
[1] Shmueli, Karin, et al. "The contribution of chemical exchange to MRI frequency shifts in brain tissue." Magnetic Resonance in Medicine 65.1 (2011): 35-43.
[2] Wang, Yi, and Tian Liu. "Quantitative susceptibility mapping (QSM): decoding MRI data for a tissue magnetic biomarker." Magnetic resonance in medicine 73.1 (2015): 82-101.
[3] Zhong,et al. "The molecular basis for gray and white matter contrast in phase imaging." Neuroimage 40.4 (2008): 1561-1566.
[4] Luo, Jie, et al. "Protein-induced water 1H MR frequency shifts: contributions from magnetic susceptibility and exchange effects." Journal of magnetic resonance 202.1 (2010): 102-108.
[5] Zubal, I. G., C. Harrell, and E. Smith. "Zubal phantom data." Voxel-based anthropomorphic phantoms (2003).
[6] Marques, J. P., and R. Bowtell. "Application of a Fourier‐based method for rapid calculation of field inhomogeneity due to spatial variation of magnetic susceptibility." Concepts in Magnetic Resonance Part B: Magnetic Resonance Engineering: An Educational Journal 25.1 (2005): 65-78.
[7] Bernstein, Matt A., Kevin F. King, and Xiaohong Joe Zhou. Handbook of MRI pulse sequences. Elsevier, 2004.
[8] De Rochefort, Ludovic, et al. "Quantitative MR susceptibility mapping using piece‐wise constant regularized inversion of the magnetic field." Magnetic Resonance in Medicine: An Official Journal of the International Society for Magnetic Resonance in Medicine 60.4 (2008): 1003-1009.
[9] Soliman, Abraam S., et al. "Fat quantification using an interleaved bipolar acquisition." Magnetic resonance in medicine75.5 (2016): 2000-2008.
[10] Liu, Jing, et al. "Morphology enabled dipole inversion for quantitative susceptibility mapping using structural consistency between the magnitude image and the susceptibility map." Neuroimage 59.3 (2012): 2560-2568.
Figures