1123
QSM and R2* measurements from cortical and subcortical regions of the human brain at 7T: a Multi-Centre Reproducibility Study1Wolfson Brain Imaging Centre, University of Cambridge, Cambridge, United Kingdom, 2Welcome Centre for Integrative Neuroimaging (FMRIB), University of Oxford, Oxford, United Kingdom, 3Cardiff University Brain Research Imaging Centre, School of Psychology, Cardiff University, Cardiff, United Kingdom, 4Sir Peter Mansfield Imaging Centre, University of Nottingham, Nottingham, United Kingdom, 5Imaging Centre of Excellence, University of Glasgow, Glasgow, United Kingdom
Synopsis
Multi-site studies allow for cost-effective research at high-field by increasing the size of the healthy and patient pool.
For T2*-weighted imaging, the variability in the scanners’ shimming conditions may contribute to inconsistent numerical results.In this study we present a multi-site, multi-vendor ‘travelling-heads’ study with harmonized protocols for QSM and R2*-mapping.
Average values across cortical and subcortical ROIs are in agreement with literature, show low variance and high correlation values when comparing measurements across different scanners. R2*-mapping is more stable than QSM due to shimming differences across scanners that affect the background field.
Introduction
T2*-weighted (T2*-w) MRI at 7 Tesla is an attractive option due to the ability to obtain quantitative susceptibility maps (QSM) as an indirect measurement of brain iron, as well as R2* maps that are sensitive to the degree of field inhomogeneity at a microscopic scale1.
Multi-site studies allow for cost-effective research at high-field by increasing the size of the healthy and patient pool, facilitating the detection of small effects or investigation of rare diseases2. However, to implement such studies it is necessary to guarantee that scanning protocols are matched across imaging sites and so generate comparable MRI data. Particularly for T2*-weighted imaging, the variability in the scanners’ shimming conditions may contribute to inconsistent numerical results3.
In this study we present a multi-site, multi-vendor ‘travelling-heads’ study with harmonized protocols for QSM and R2* mapping. We assess the robustness of both single and multi-echo T2*-w sequences, implemented on three scanner models, in order to provide a solid framework for future multi-site clinical studies at 7T.
Data Acquisition
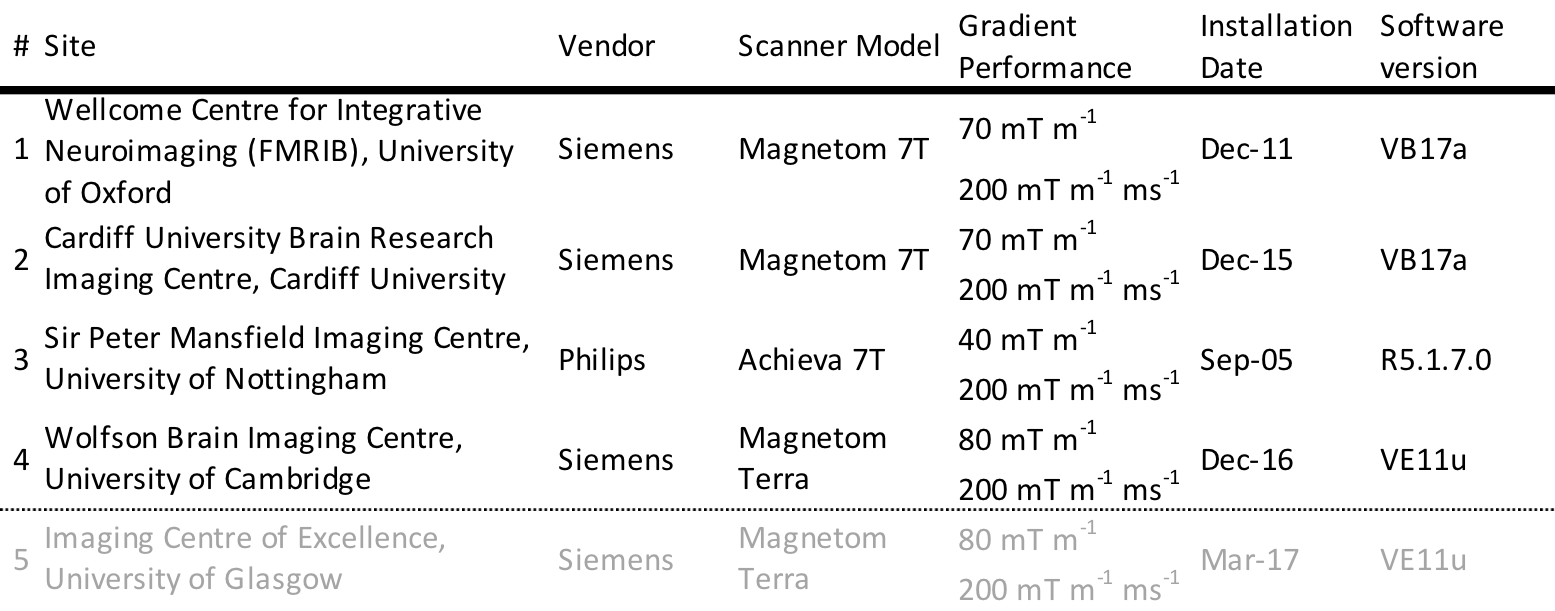
Eight healthy volunteers (2 female, 32.8±6.3 years-old) were recruited, two subjects per site (Table 1). Each subject was scanned five times at their home site, and once at the other sites, under local ethics approval.
Single-echo (SE) 0.7mm isotropic resolution, T2*-w images were acquired for QSM (TE/TR=20/31ms; FA=15º; BW=70Hz/px; in-plane acceleration-factor=4 (Sites-1/2/4) and 2x2 (Site-3); FOV=224x224x157mm3; scan-time=~9min). Multi-echo (ME) 1.4mm isotropic resolution, T2*-w scans were acquired and used for R2* mapping and QSM (TE1/TR=4/43ms; 8 echoes with monopolar gradient; echo-spacing=5ms; FA=15º; BW=260Hz/px; acceleration-factor=4 (Sites-1/2/4) and 2x1.5 (Site-3); FOV=269x218x157mm3; scan-time=~5.58min (Sites-1/2/4) and ~4.28min (Site-3)). For data acquired at sites A/B/D a reconstruction using Roemer’s coil combination method was implemented for both sequences4. A 0.7mm isotropic MP2RAGE scan was also acquired as described previously5.
Data Analysis
QSM data was generated using the multi-scale dipole inversion (MSDI) algorithm implemented in QSMbox6, using both the SE and ME T2*-w datasets. This involved phase unwrapping7, for ME images weighted least squares phase echo fitting, background field removal in two steps – LBV8 and vSMV with r0=40mm9, and MSDI inversion with 4 scales and regularization term $$$\lambda=10^{2.7}$$$.
For the ME dataset, voxel-wise quantitative maps of R2* were obtained using the ARLO method10.
For each subject, and separately for ME and SE data, the magnitude from all of the scans was were first combined with ANTs11 to create a subject specific template. The QSM, R2* and PSIR images were then mapped to each subject’s specific template.
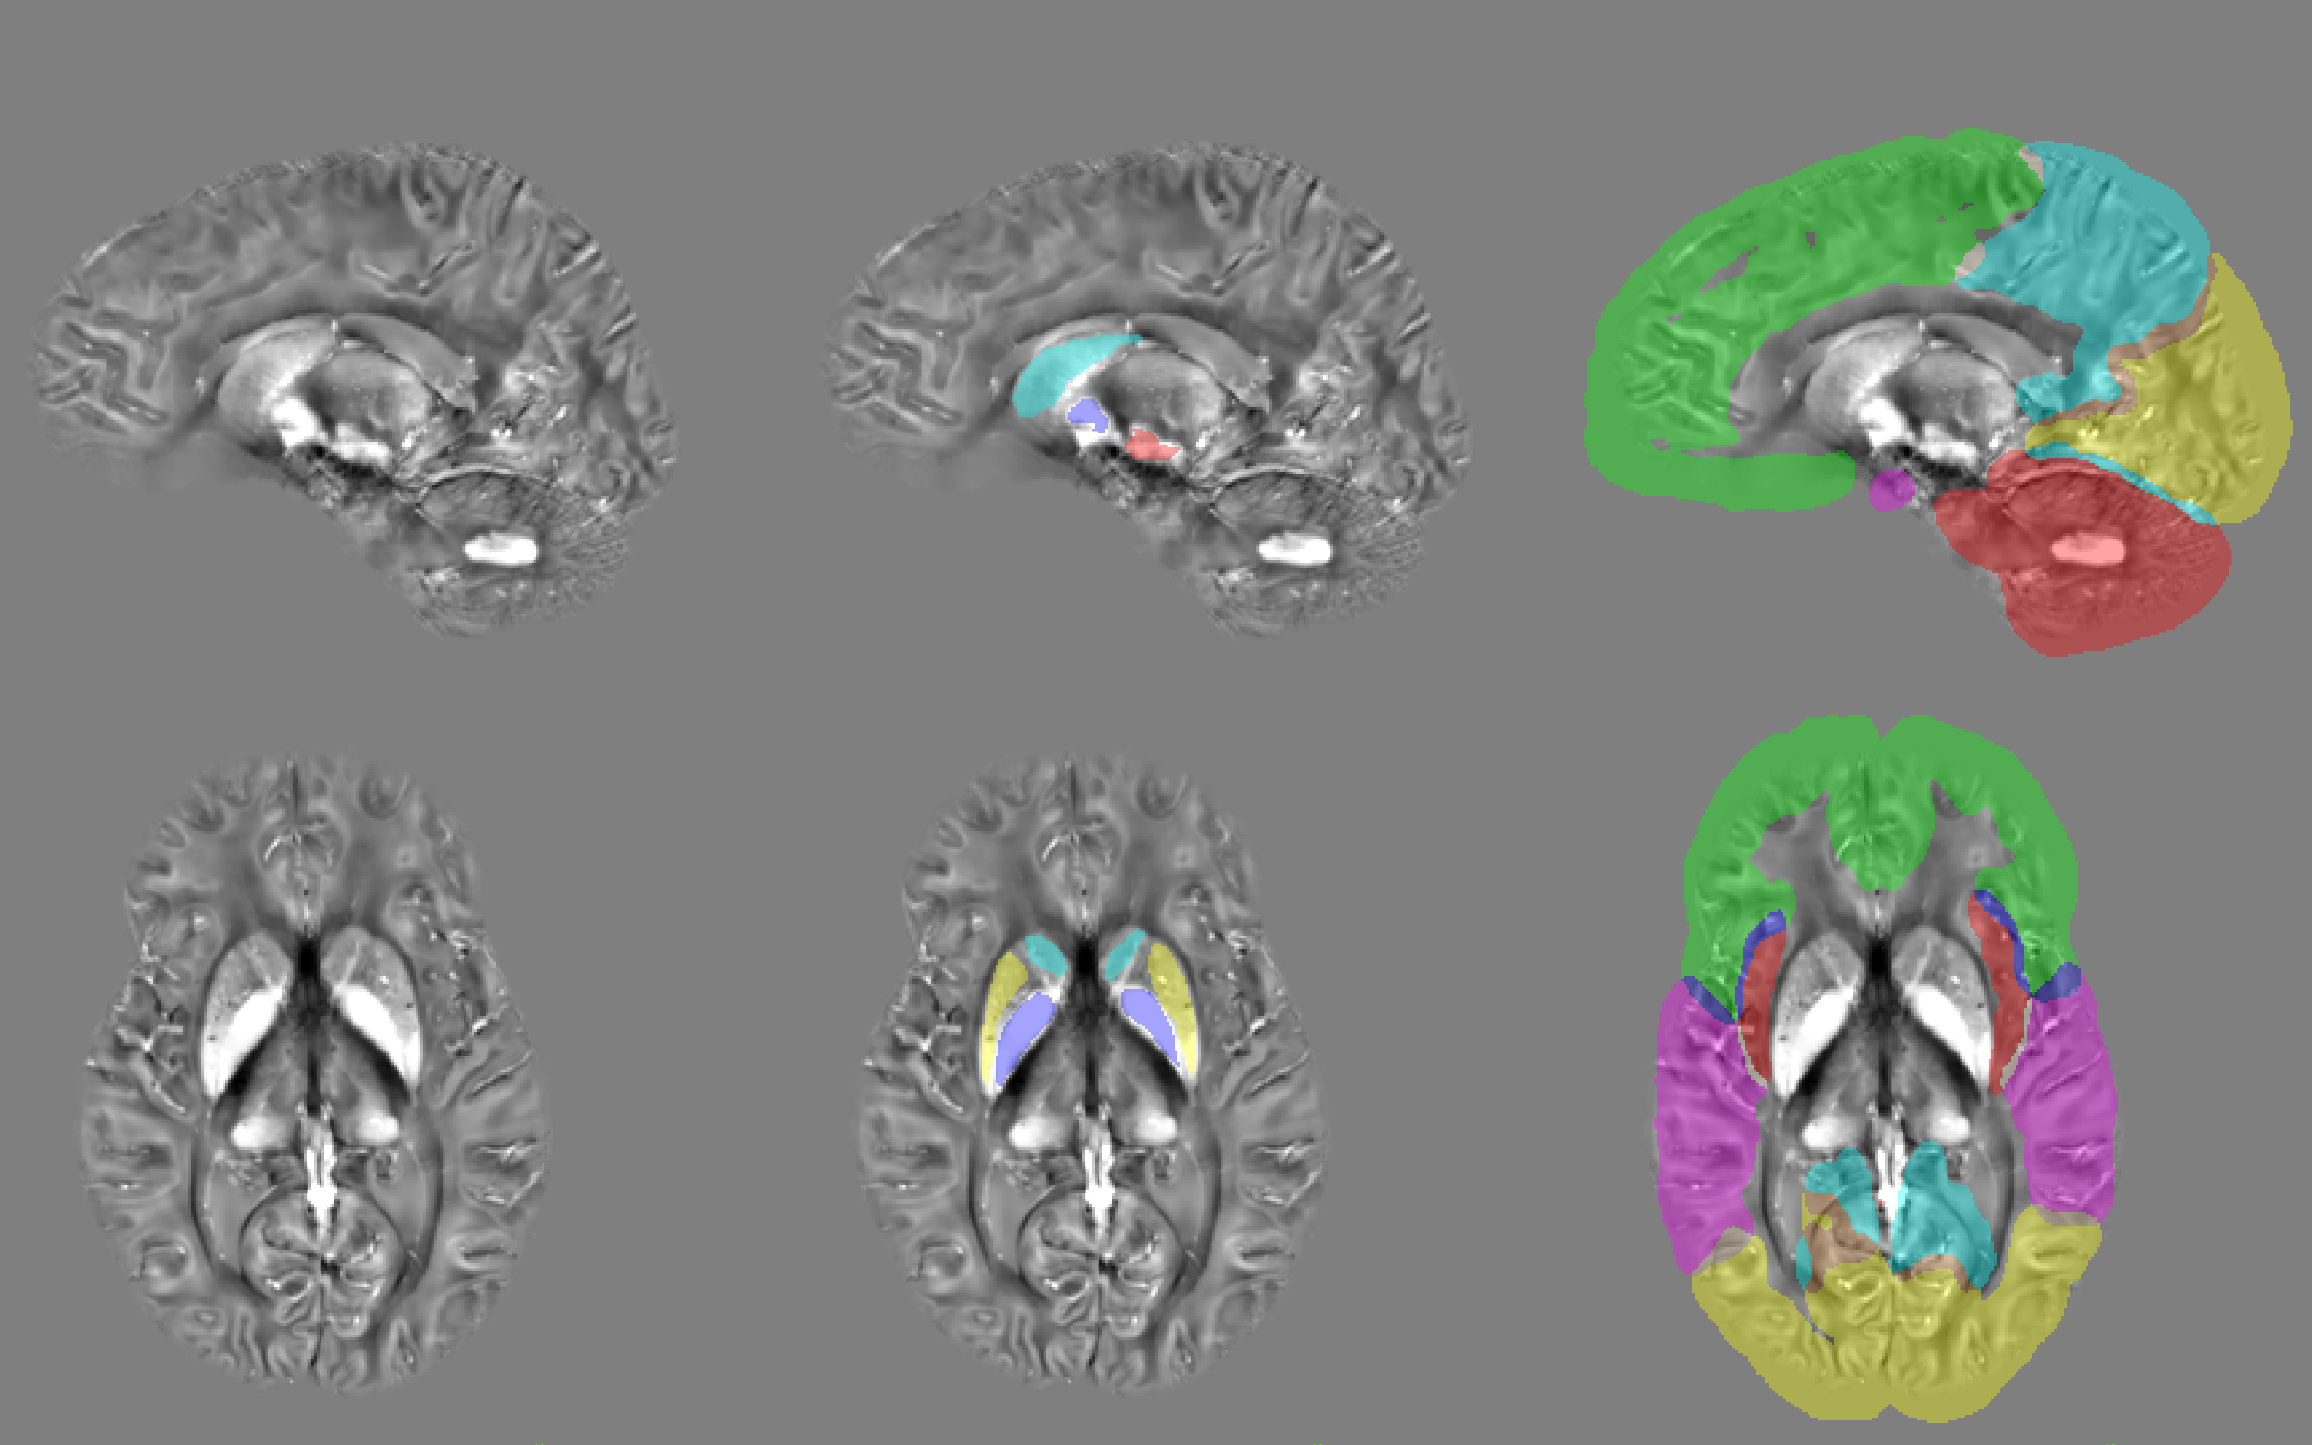
Five subcortical regions-of-interest (ROIs) were manually drawn on the registered susceptibility maps with ITK-Snap (http://www.itksnap.org) and six automatic cortical ROIs were mapped from the MNI152 atlas (Figure 1).
A CSF mask was obtained from the PSIR data and masked with an eroded brain mask (such that no surface CSF was included) and used for referencing the susceptibility values ($$$\Delta\chi=\chi_{ROI}-\chi_{CSF}$$$ ).
Averages of single-echo and multi-echo $$$\Delta\chi$$$, and R2* values were calculated for all the ROIs from all subjects and scans. Within-site and cross-site comparisons were made for each subject by computing the standard-deviation (SD) of the mean $$$\Delta\chi$$$ and R2* voxel-wise and in the ROIs.
Results
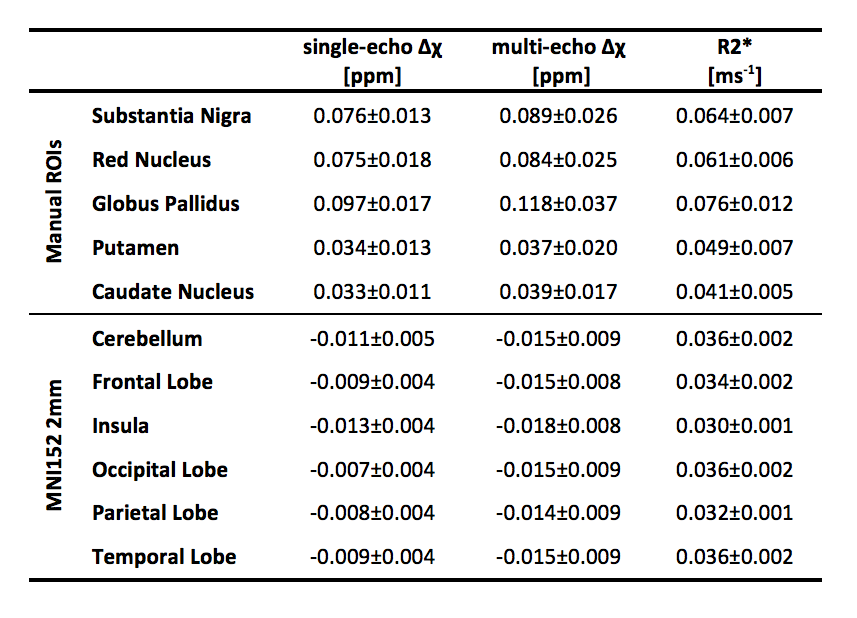
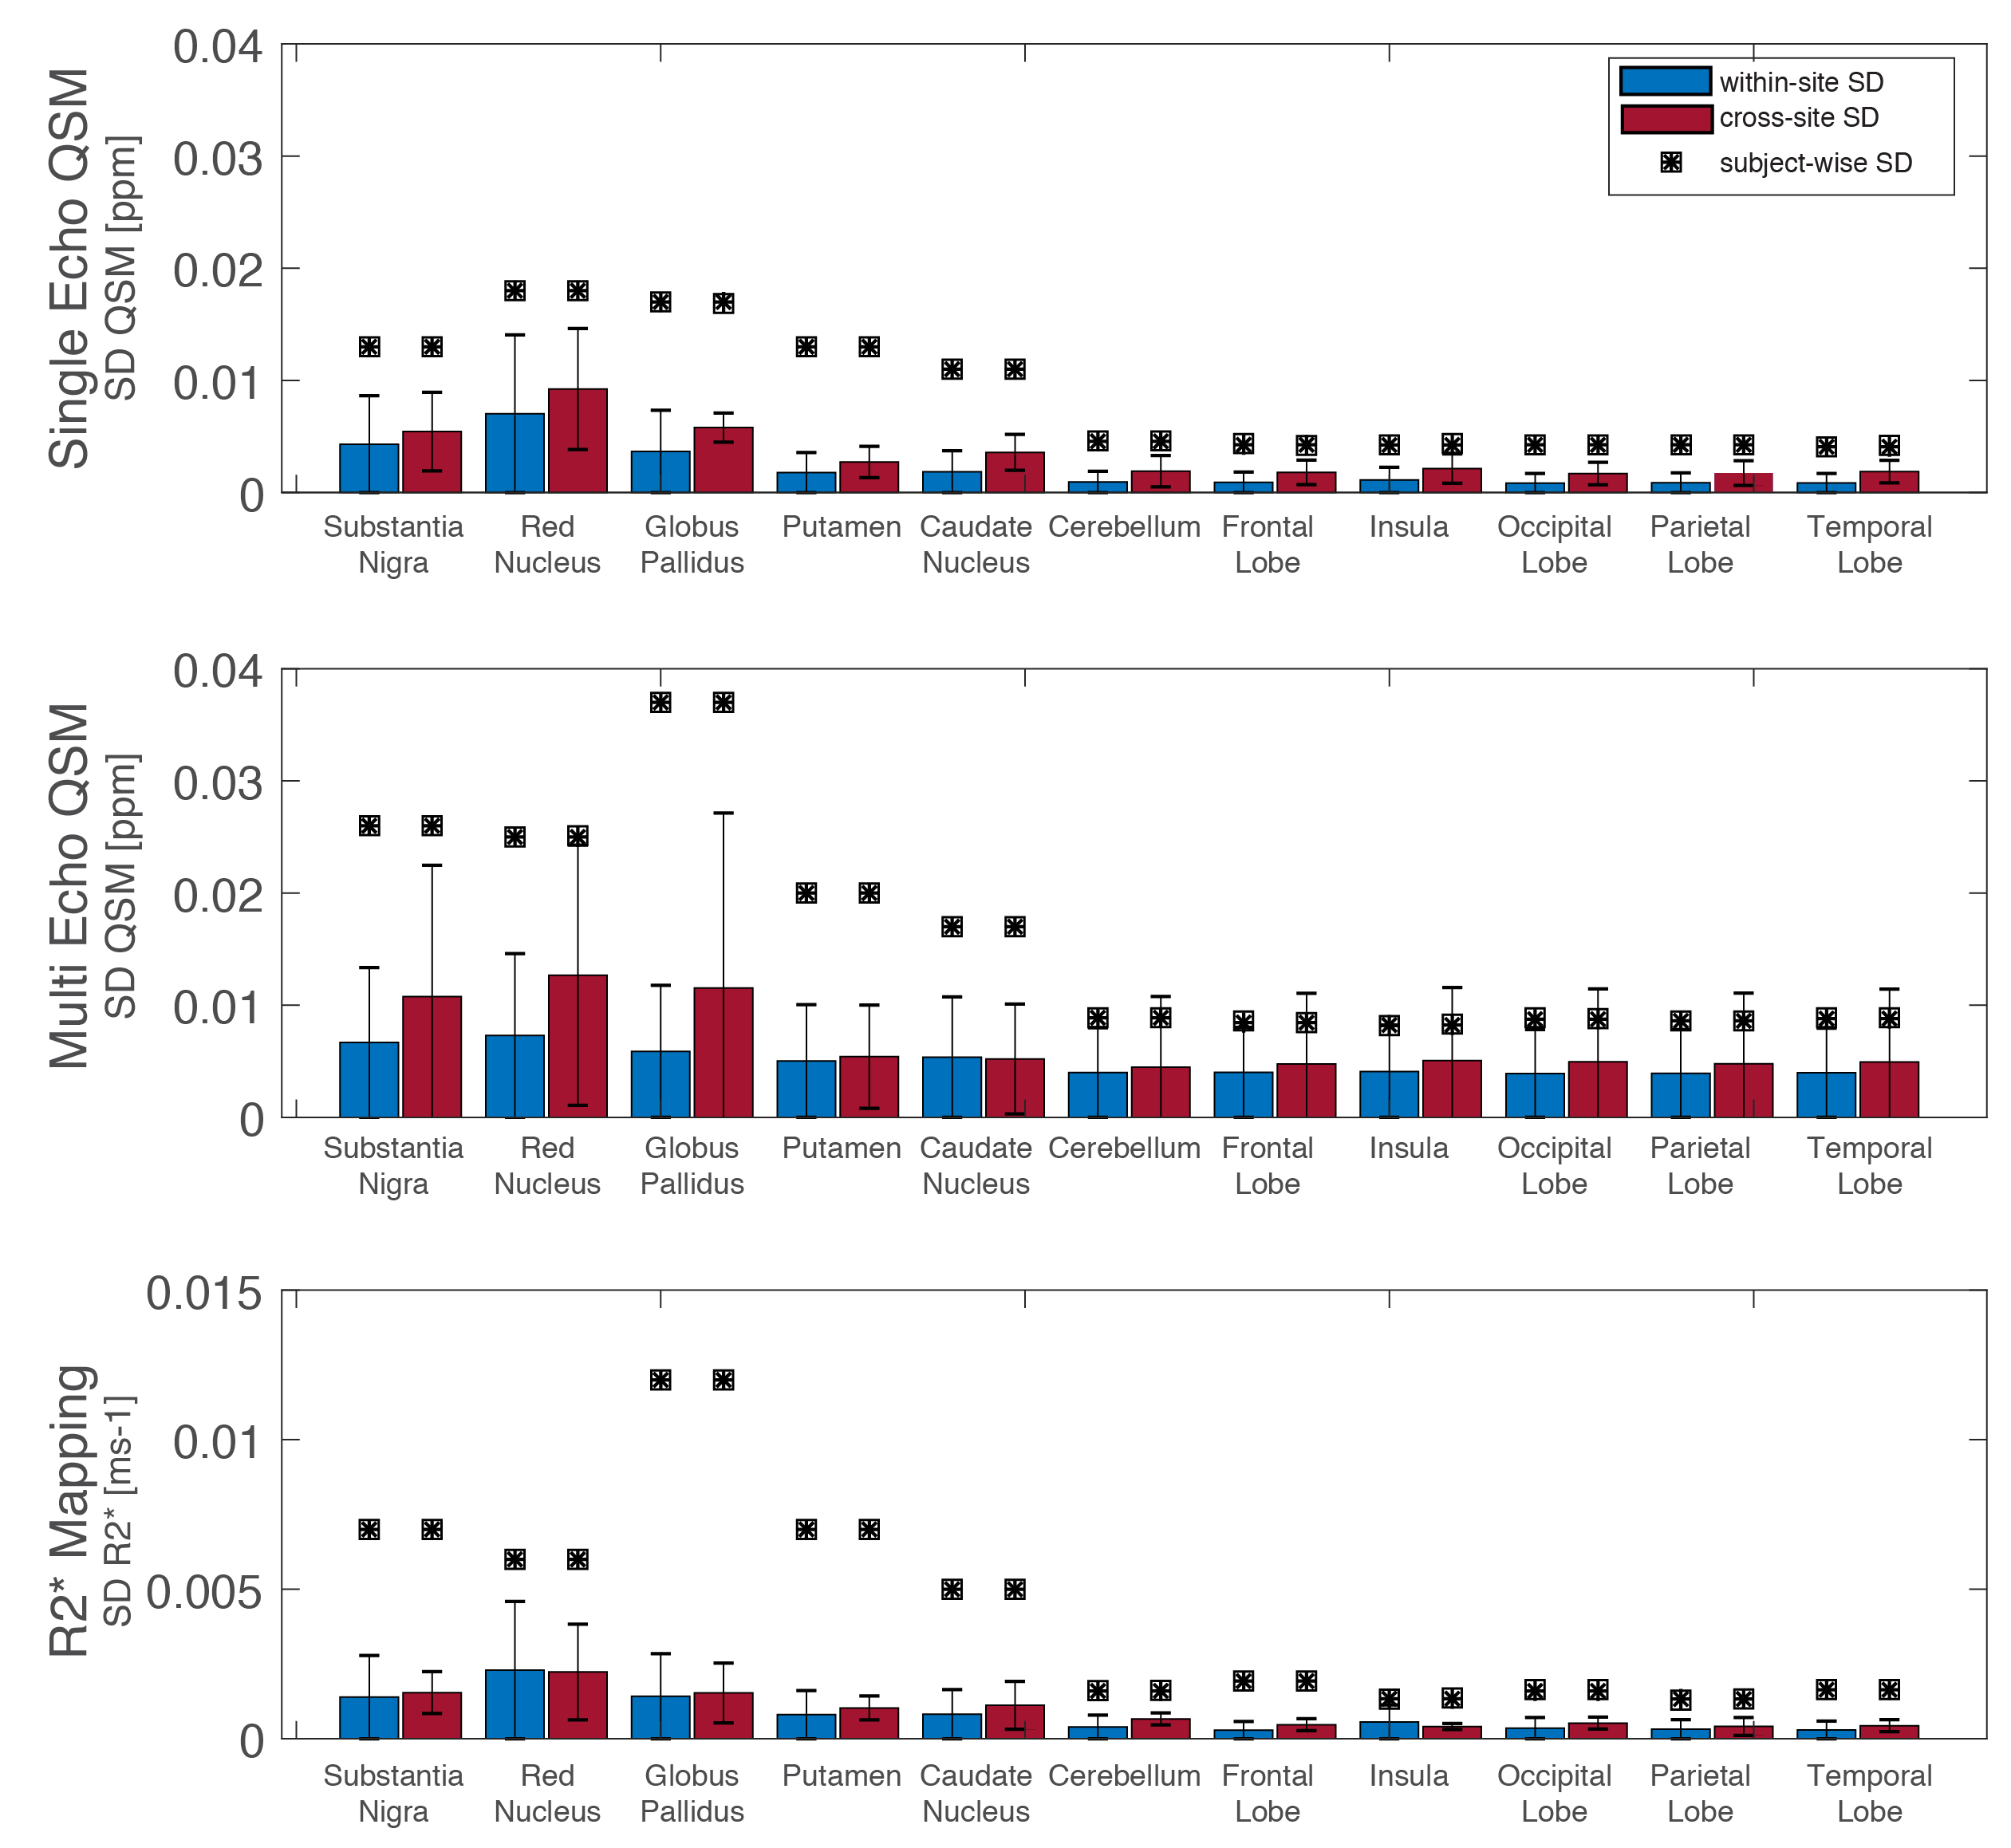
Average $$$\Delta\chi$$$ and R2* values calculated on cortical and subcortical ROIs are reported in Table 2. These are in good agreement with our pilot data18 and with literature values1. Cross-site variability was significantly larger than within-site in all ROIs measured (Figure 2). Yet, all results are lower than the subject-wise standard-deviation and are in agreement with3.
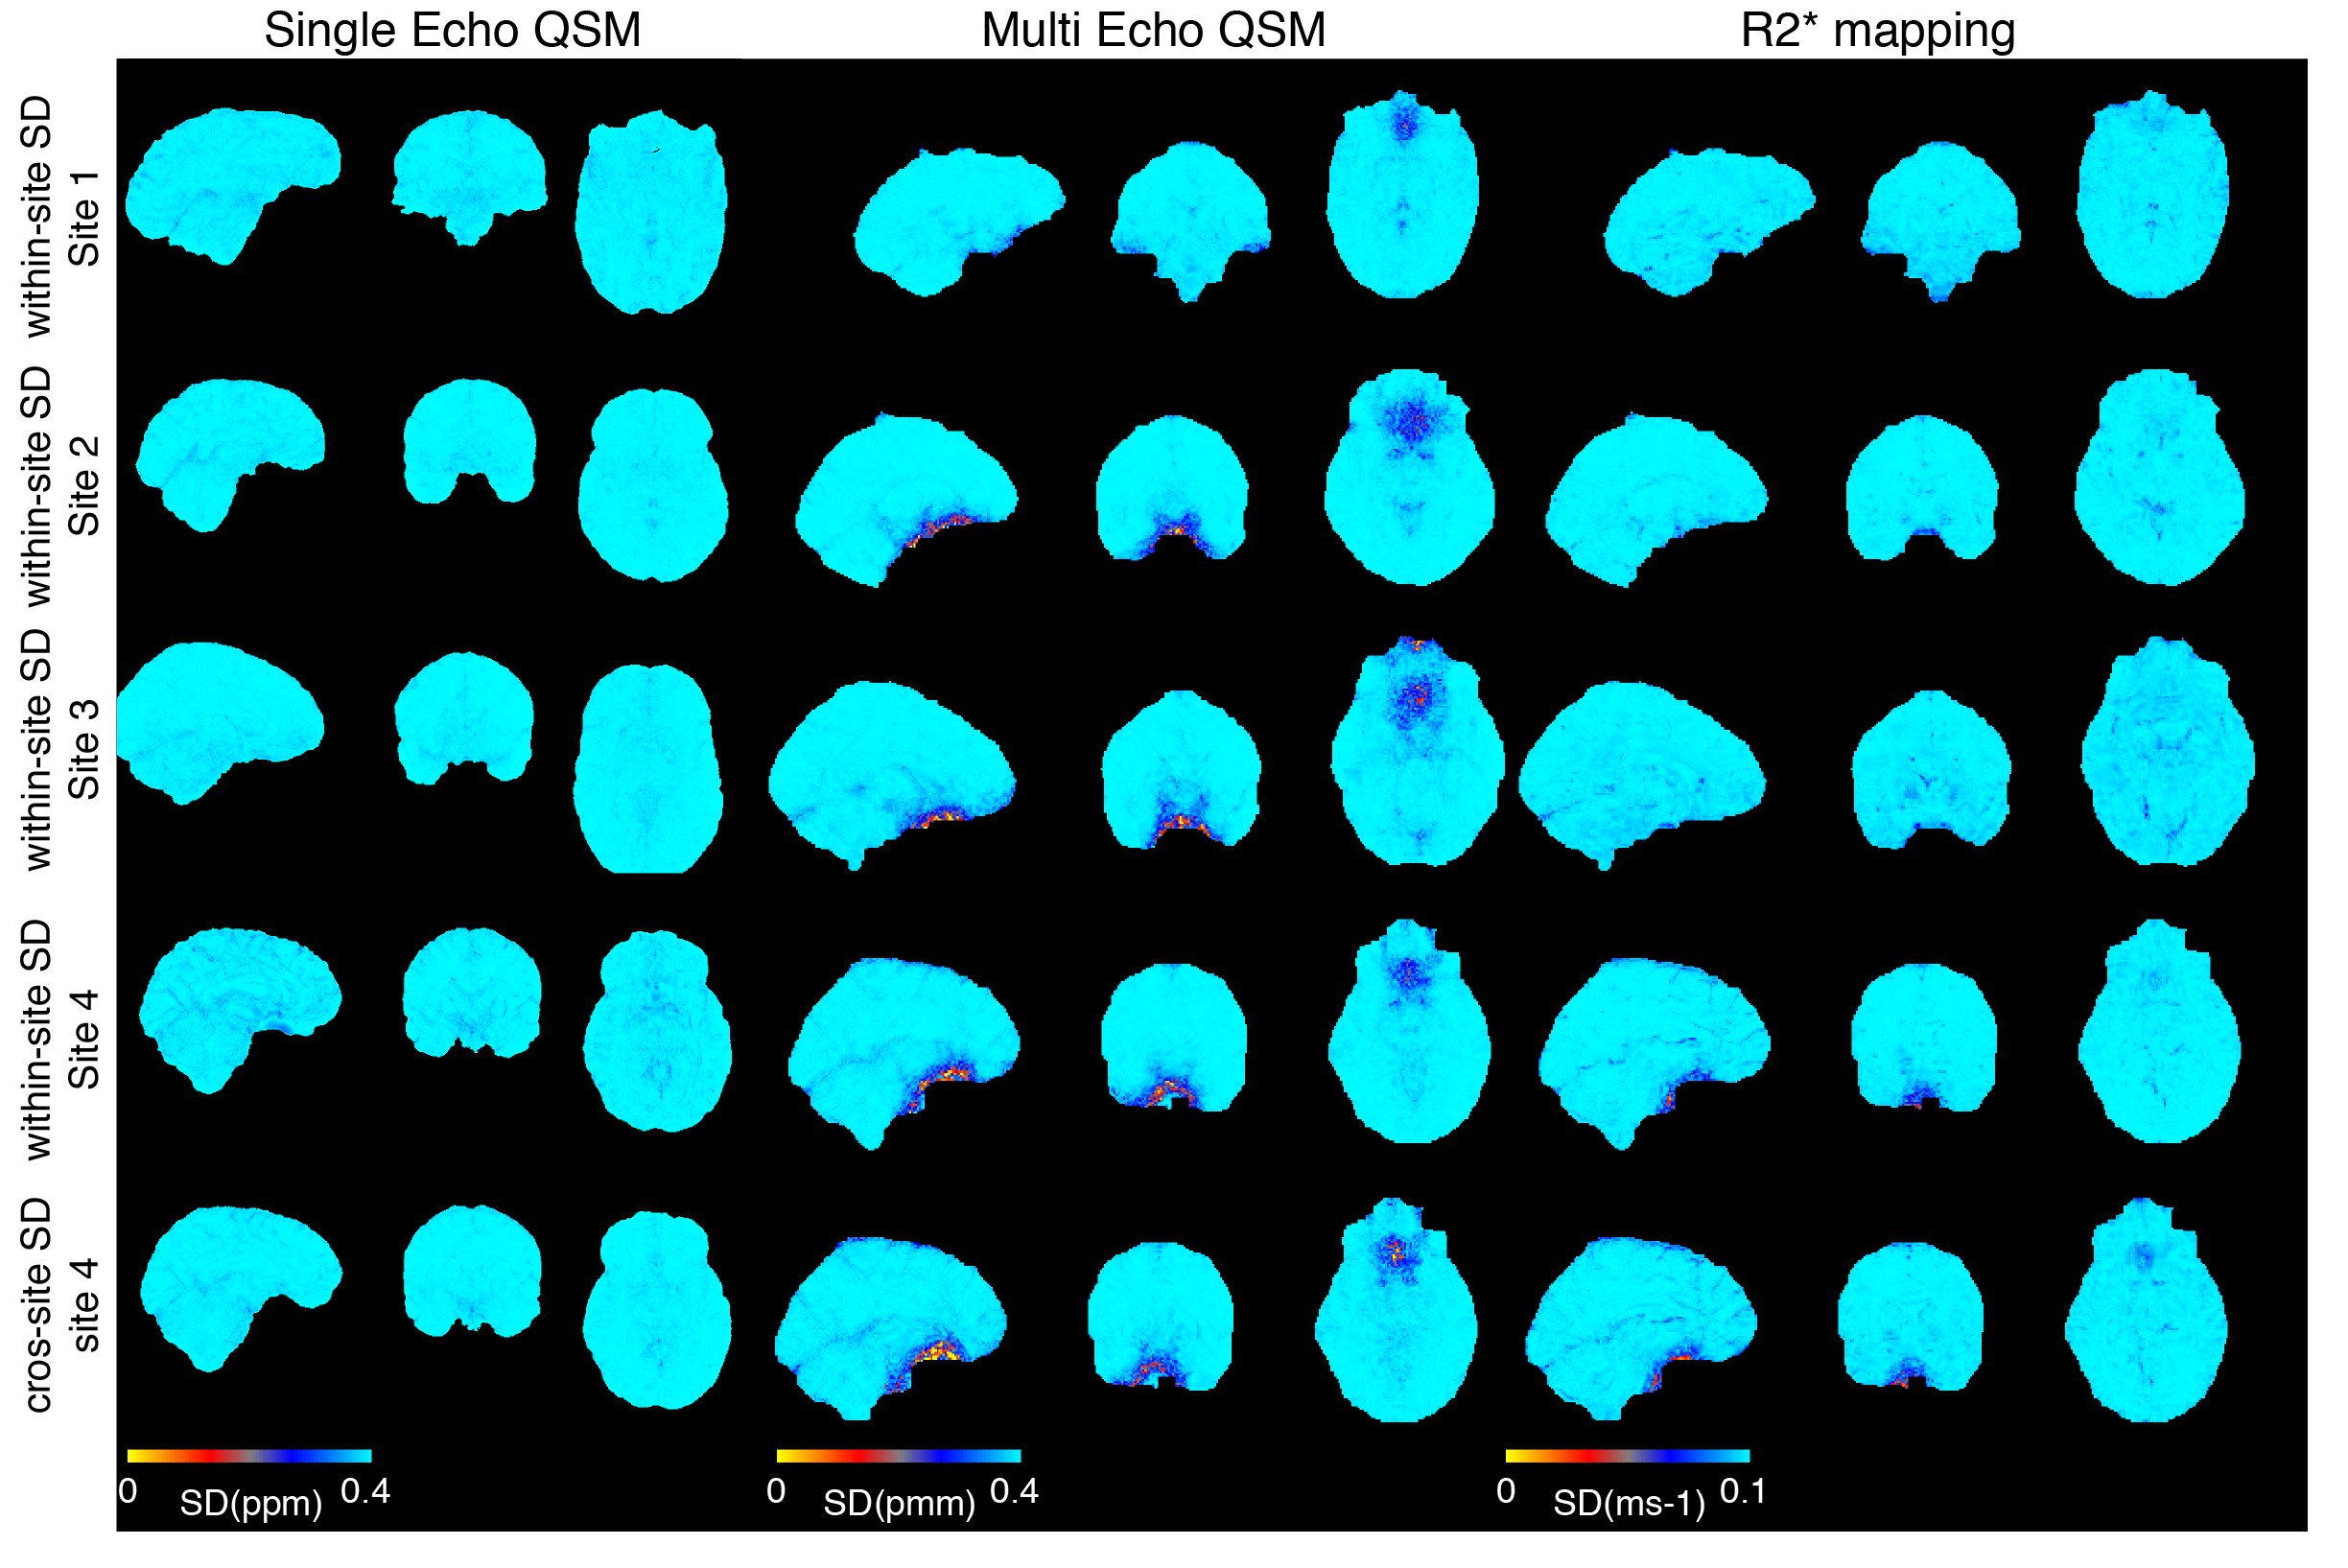
Figure 3 shows within and cross-site variability maps of QSM and R2* for example subjects. On all data, cross-site SD is higher than within-site SD. Compared to SE data, ME data shows larger local SD in the inferior temporal lobes, QSM being more severely affected than R2*.
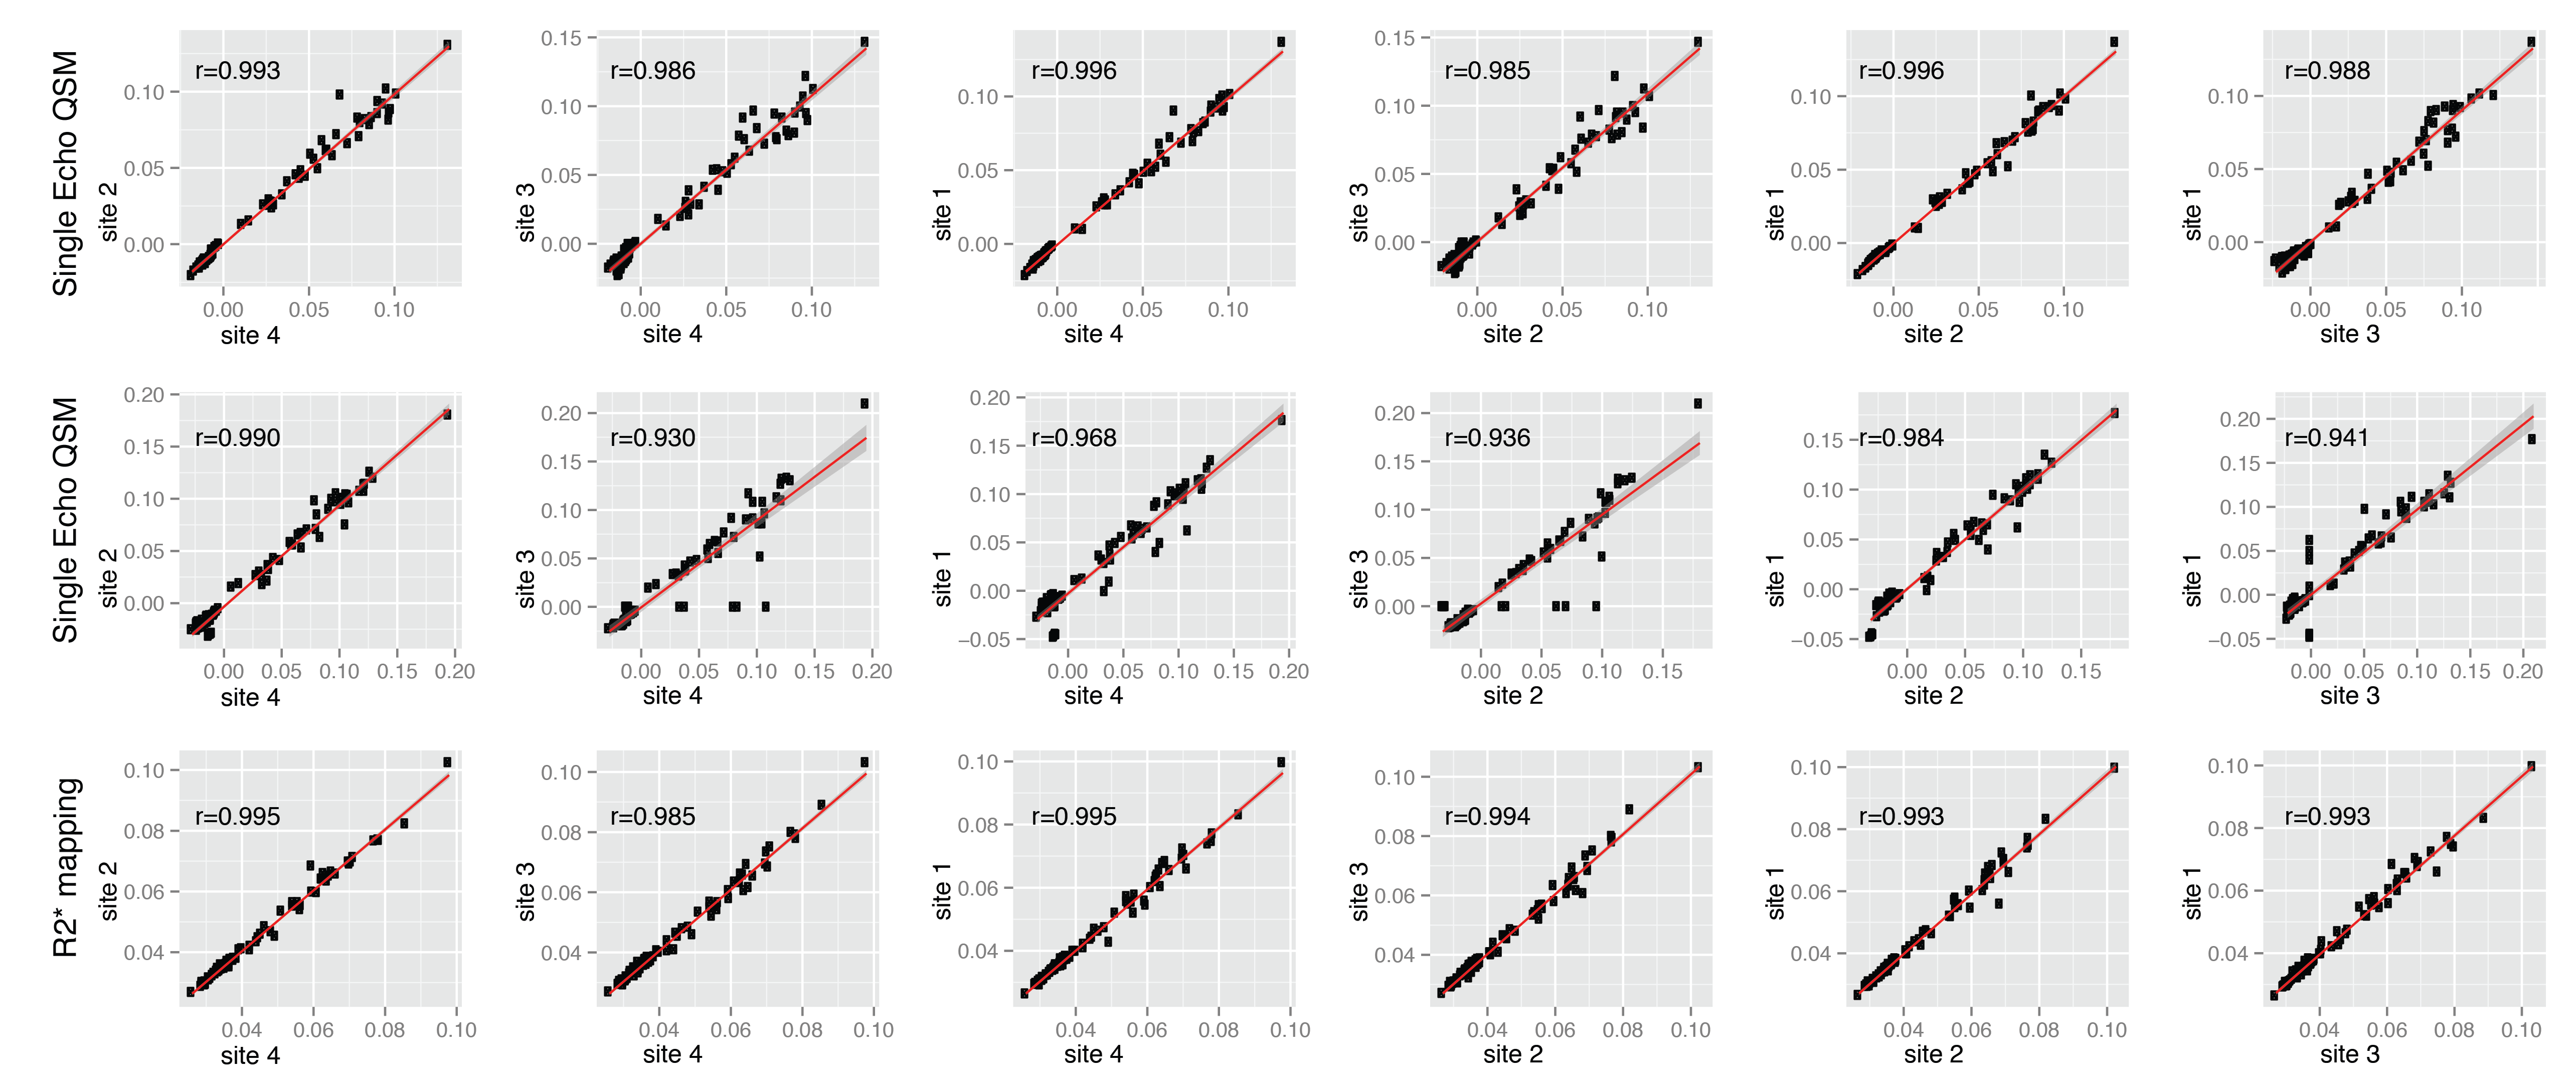
Cross-site correlation plots are shown in Figure 4. Although, on average, correlations with site-3 produced 1.9% lower r-values (p=0.04), all correlations are extremely high (r>0.93).
Discussion and Conclusions
This study shows that it is possible to obtain highly reproducible QSM and R2* maps in multi-site, multi-vendor studies at 7 Tesla. Average values across cortical and subcortical ROIs are in agreement with literature, show low variance and high correlation values when comparing measurements across different scanners. ME data showed greater variance in areas with large B0 inhomogeneity such as the inferior frontal cortex, which may be related to the long echo times used. R2* measurements are more stable than QSM due to shimming differences across scanners that affect the background field.
We conclude that both SE and ME T2* protocols implemented in this study can translate into gold-standard results for larger cohort multi-site studies.
Acknowledgements
This work was supported by the UK7T Network funded by the Medical Research Council Grant MR/N008537/1. CTR is funded by a Sir Henry Dale Fellowship from the Wellcome Trust and the Royal Society [098436/Z/12/B].References
1. Deistung A, Schäfer A, Schweser F, Biedermann U, Turner R, Reichenbach JR. Toward in vivo histology: a comparison of quantitative susceptibility mapping (QSM) with magnitude-, phase-, and R2*-imaging at ultra-high magnetic field strength. Neuroimage. 2013. 65: 299-314.
2. Tofts PS, Collins DJ. Multicentre imaging measurements for oncology and in the brain. Br J Radiol. 2012. 84: S213-S226. 3. Lin PY, Chao TC, Wu ML. Quantitative susceptibility mapping of human brain at 3T: a multisite reproducibility study. American Journal of Neuroradiology. 2015. 36(3): 467-74.
4. Roemer PB, Edelstein WA, Hayes CE, Souza SP, Mueller OM. The NMR Phased Array. Magn Reson Med 1990. 16: 192–225.
5. Mougin O, Clarke WT, Driver I, Rua C, Carpenter A, Francis S, Muir K, Wise R, Clare S, Bowtell R. High resolution T1-weighted brain imaging and segmentation at 7T: a travelling head study. ISMRM. 2018. 701.
6. Acosta-Cabronero J, Milovic C, Mattern H, Tejo C, Speck O, Callaghan MF. A robust multi-scale approach to quantitative susceptibility mapping. Neuroimage. 2018. 183: 7-24.
7. Abdul-Rahman HS, Gdeisat MA, Burton DR, Lalor MJ, Lilley F, Moore CJ. Fast and robust three-dimensional best path phase unwrapping algorithm. Appl. Optic. 2007. 46: 6623–6635.
8. Zhou D, Liu T, Spincemaille P, Wang Y, Background field removal by solving the Laplacian boundary value problem. NMR Biomed. 2014. 27: 312–319.
9. Li W, Wu B, Liu C, Quantitative susceptibility mapping of human brain reflects spatial variation in tissue composition. Neuroimage. 2011. 55: 1645–1656.
10. Pei M, Nguyen TD, Thimmappa ND, Salustri C, Dong F, Cooper MA, Li J, Prince M, Wang Y. An Algorithm for fast mono-exponential fitting based on Auto-Regression on Linear Operations (ARLO) of data. 2015. Magn. Reson. Med. 73(2): 843–850.
11. Avants, BB, Tustison NJ, Song G, Cook PA, Klein A, Gee JC. A reproducible evaluation of ANTs similarity metric performance in brain image registration. Neuroimage 2011. 54(3): 2033-44.
12. Rua C, Clarke W, Driver I, Mougin O, Clare S, Francis S, Muir K, Wise R, Williams G, Bowtell R, Carpenter A. Reproducibility of Quantitative Susceptibility Mapping and R2* Mapping of the Human Brain at 7T: a Multi-Centre Pilot Study. ISMRM. 2018. 2219.
Figures