1120
Evaluating the influence of contrast weighting, resolution, and parallel imaging on the reproducibility and tissue specificity of radiomic features1Biomedical Engineering, Case Western Reserve University, Cleveland, OH, United States
Synopsis
Computer-extracted (radiomic) features can provide a wealth of quantitative information that is useful for quantitative characterization of disease. However, routine image acquisition parameters can vary substantially across patients with the potential to confound or degrade results obtained by analysis of radiomic features. The extent to which the variation in routine image acquisition parameters can affect radiomic features in vivo is not well known. In this work, we evaluate the influence of varied contrast weighting (TR, TE), varied resolution, and the use of parallel imaging on intensity and textural radiomic features in T2-weighted images.
Introduction
While computer-extracted image (radiomic) features can aid in quantitative characterization of disease in routine MRI, benchmarking their reproducibility across different image acquisition parameters is critical for wider clinical deployment. In this work, we evaluated the effect of controlled variations in contrast weightings (TR and TE), in-plane resolution, and parallel imaging on the reproducibility of radiomic textural features from T2-weighted images. Our goal was to identify radiomic features most robust to typical ranges of acquisition parameters as well as to interpret the interplay between acquisition parameters and resulting radiomic features.Methods
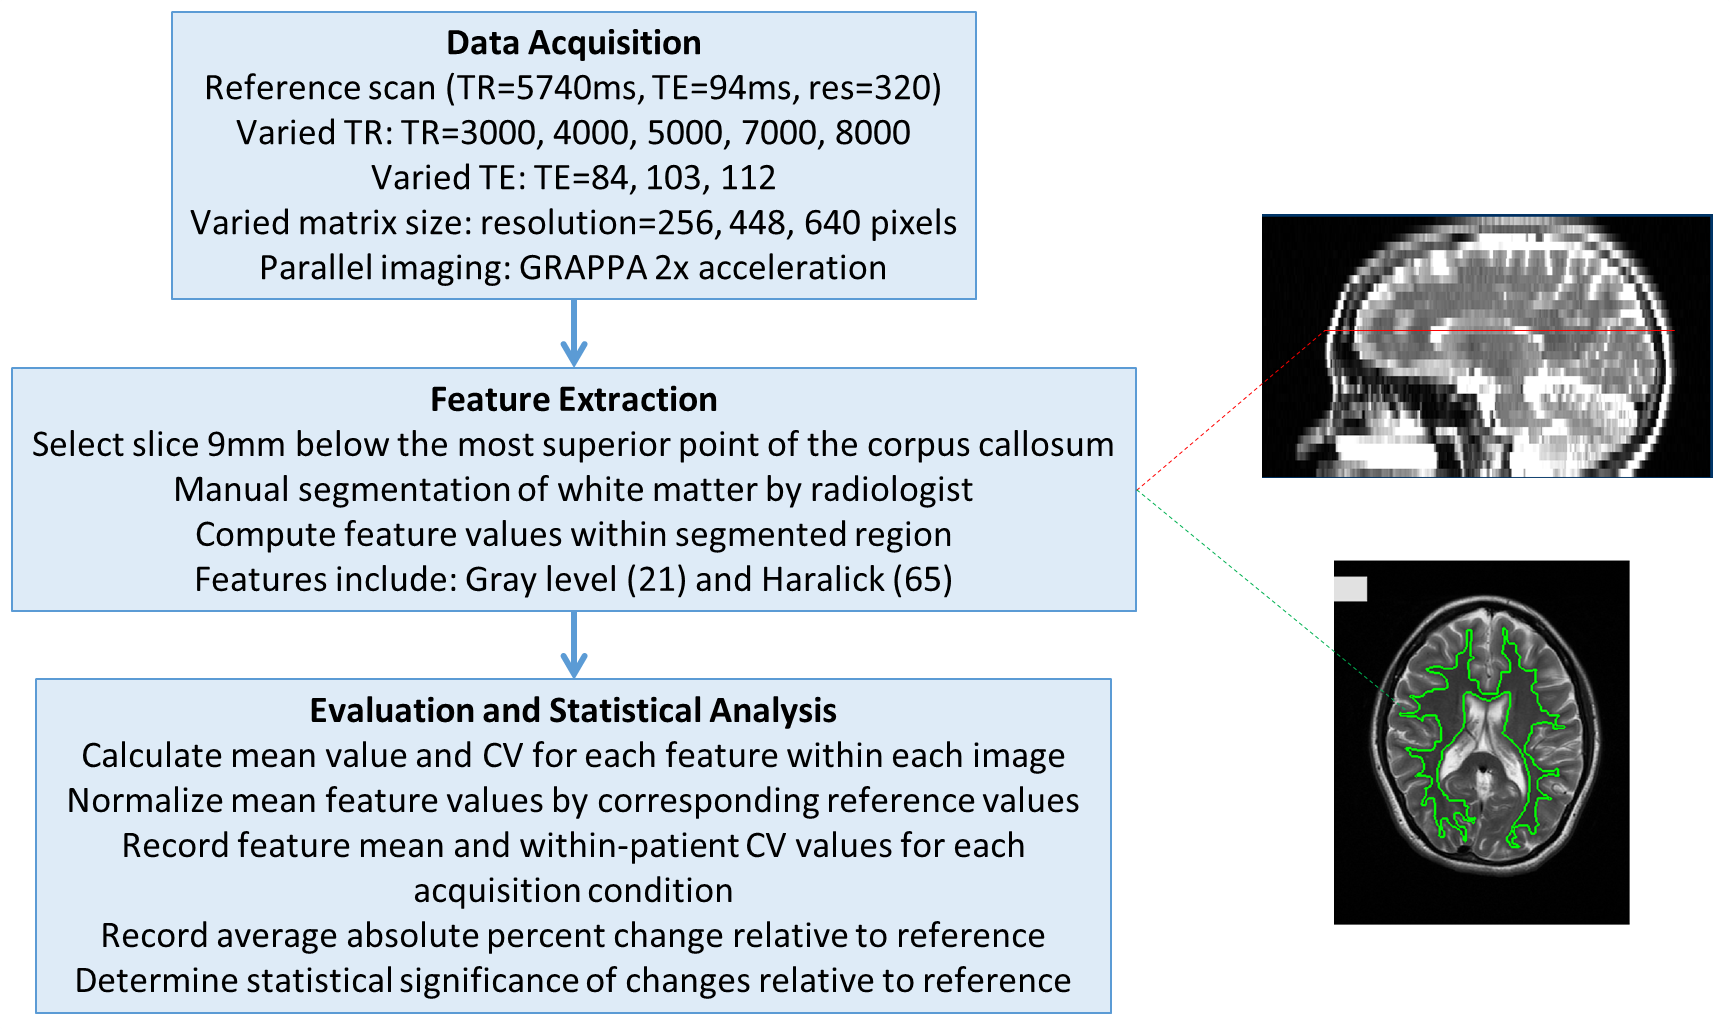
A “reference” T2-weighted brain imaging protocol was identified from the literature, which formed a baseline for varying acquisition parameters as well as evaluating radiomic features (see Figure 1). Non-contrast enhanced brain scans were obtained on a 3T Siemens Skyra scanner from N=15 volunteers under an IRB-approved protocol. All scans used an axial 2D turbo spin-echo pulse sequence where the reference scan used the following parameters: TR=5740ms, TE=94ms, 4mm slice thickness, 0.7mm in-plane resolution, and 230x187 mm field-of-view. Twelve imaging variants of four acquisition parameters from the reference scan were evaluated to span a typical range seen in clinical practice: (1) repetition time (TR) (3000ms, 4000ms, 5000ms, 7000ms, 8000ms), (2) echo time (TE) (84ms, 103ms, 112ms), (3) in-plane resolution (0.9mm, 0.5mm, 0.4mm), and (4) GRAPPA 2x acceleration. Images with a visually detectable level of motion were rejected to mitigate confounding effects, resulting in N=10-15 for each imaging variant. For each set of images, radiomic features (statistical Gray level1 and co-occurrence based Haralick2 feature families, most commonly used in the literature) were computed within the white matter region on a manually selected axial slice approximately 9mm inferior to the most superior point of the corpus callosum (identified by a trained radiologist, Figure 1). A total of 86 pixel-wise radiomic features, 21 Gray level and 65 Haralick, were derived based on varying associated square window sizes (3, 5, 7, 9, 11 pixels). For each feature the average value and the Coefficient of Variation (CV) was calculated within each image. Percent changes were then calculated with respect to the corresponding reference scan to yield two measures: Percent Change CV (%CV) which characterizes how a variable a feature is within the same tissue type for each imaging variant, and Percent Change Mean (%CM) which shows how sensitive a feature is between imaging variants. Statistical significance was evaluated by two-tailed t-tests with Bonferroni correction. Significant changes for each measure were counted and separated according to the four acquisition parameters as well as feature family (Gray, Haralick) to determine the interplay between them.Results
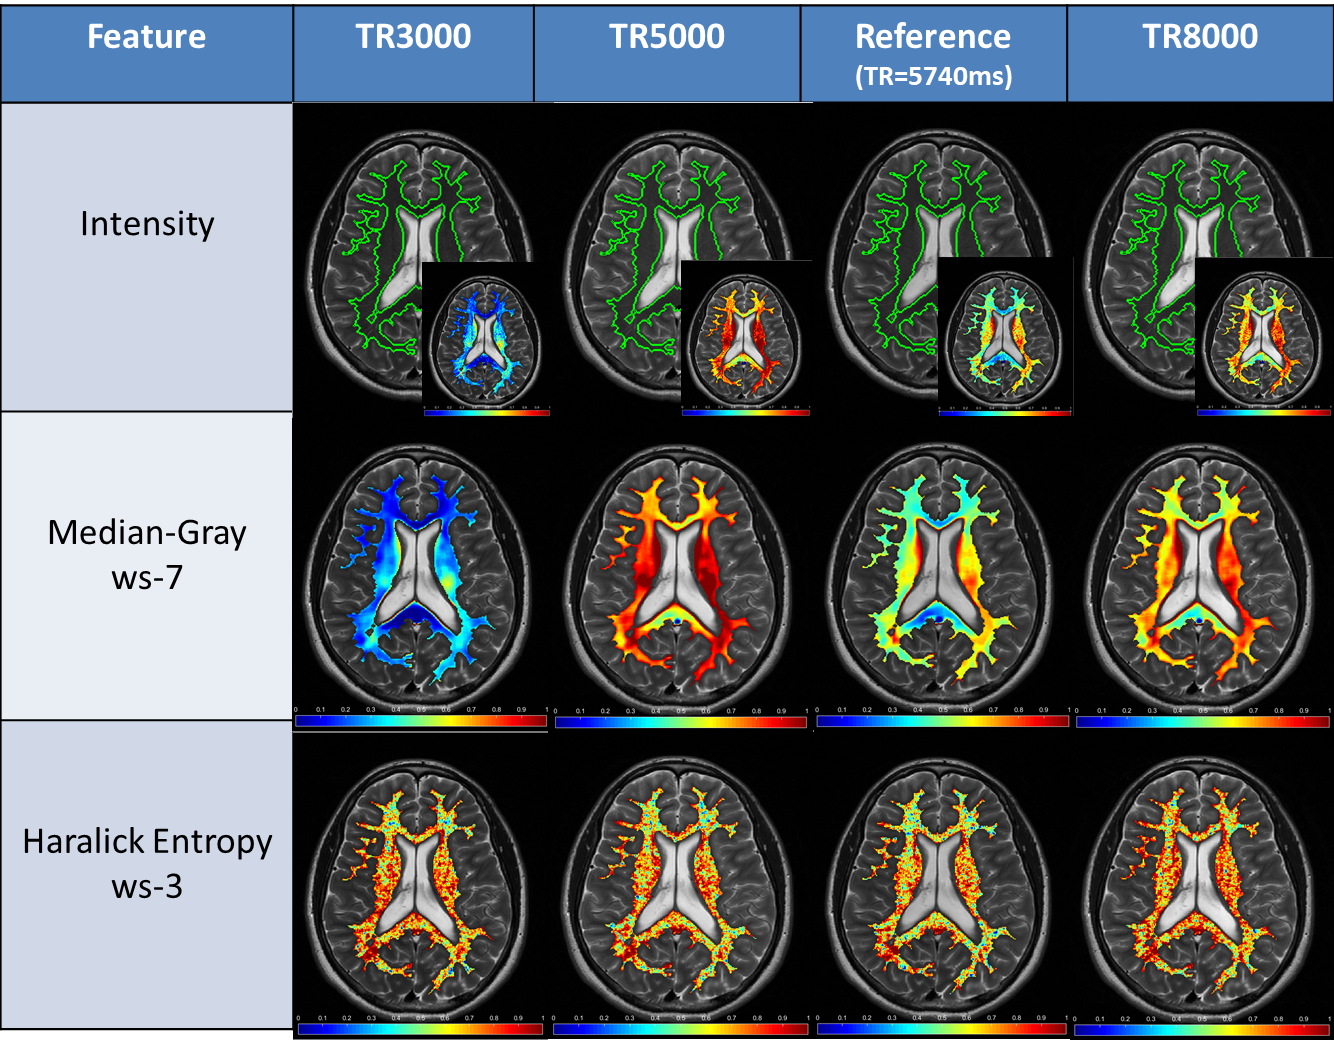
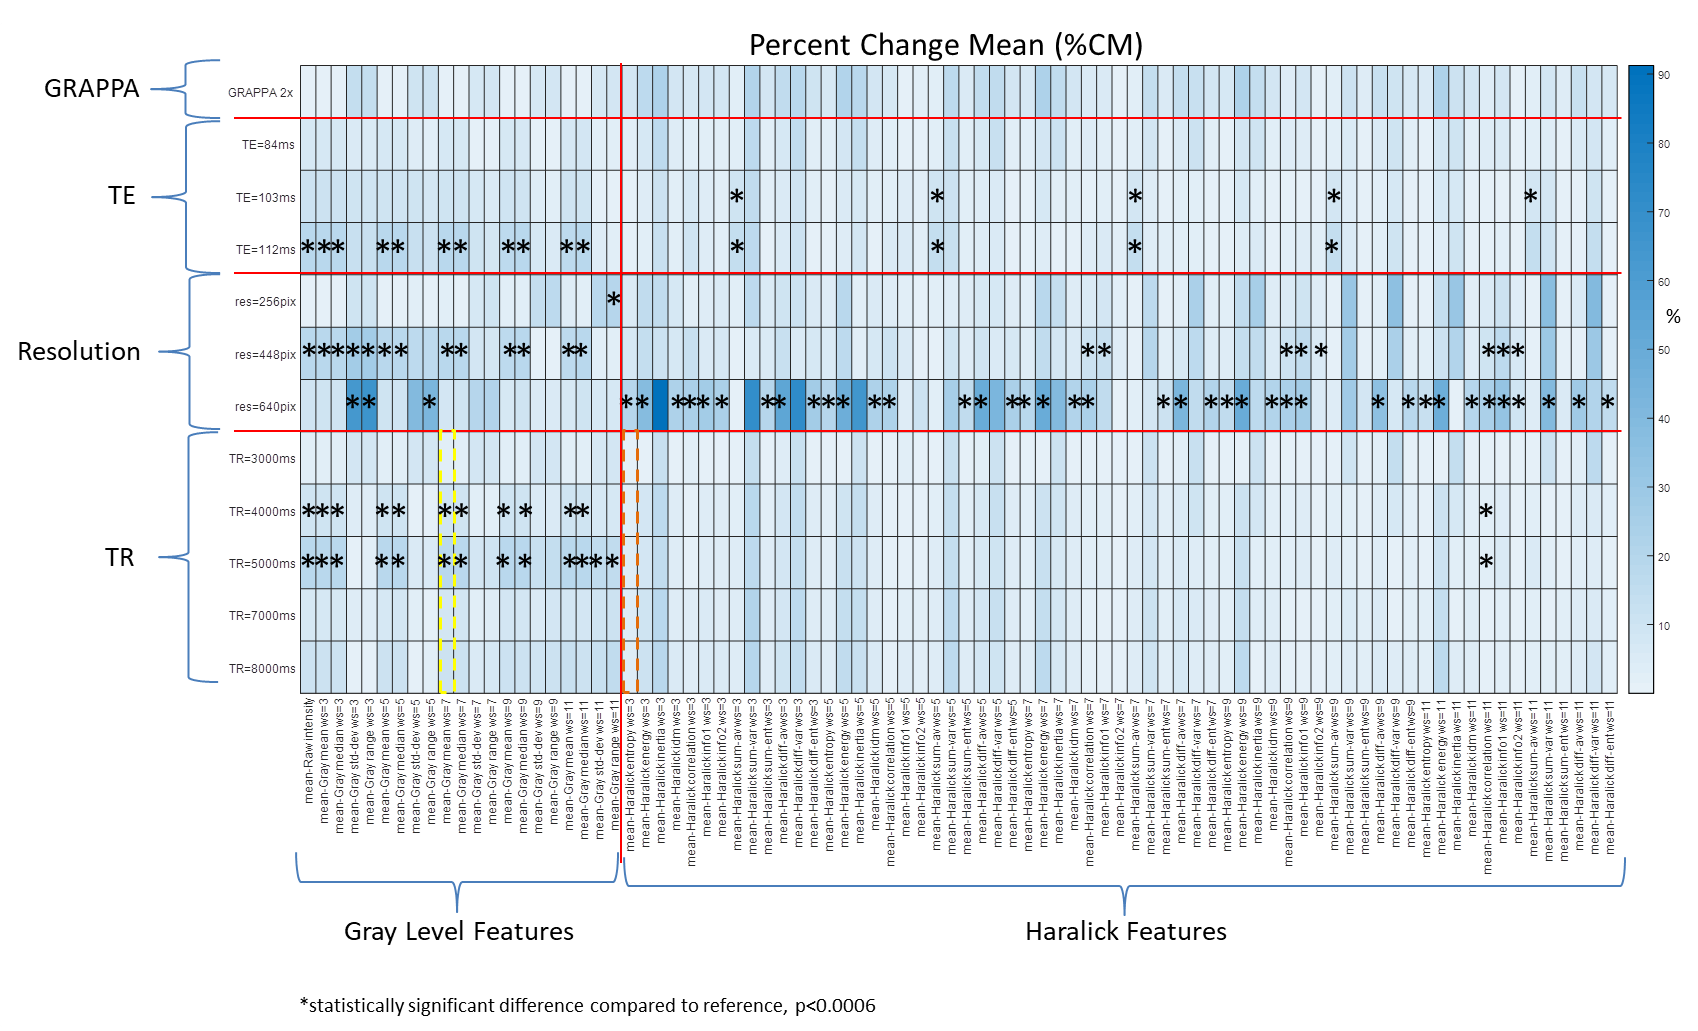
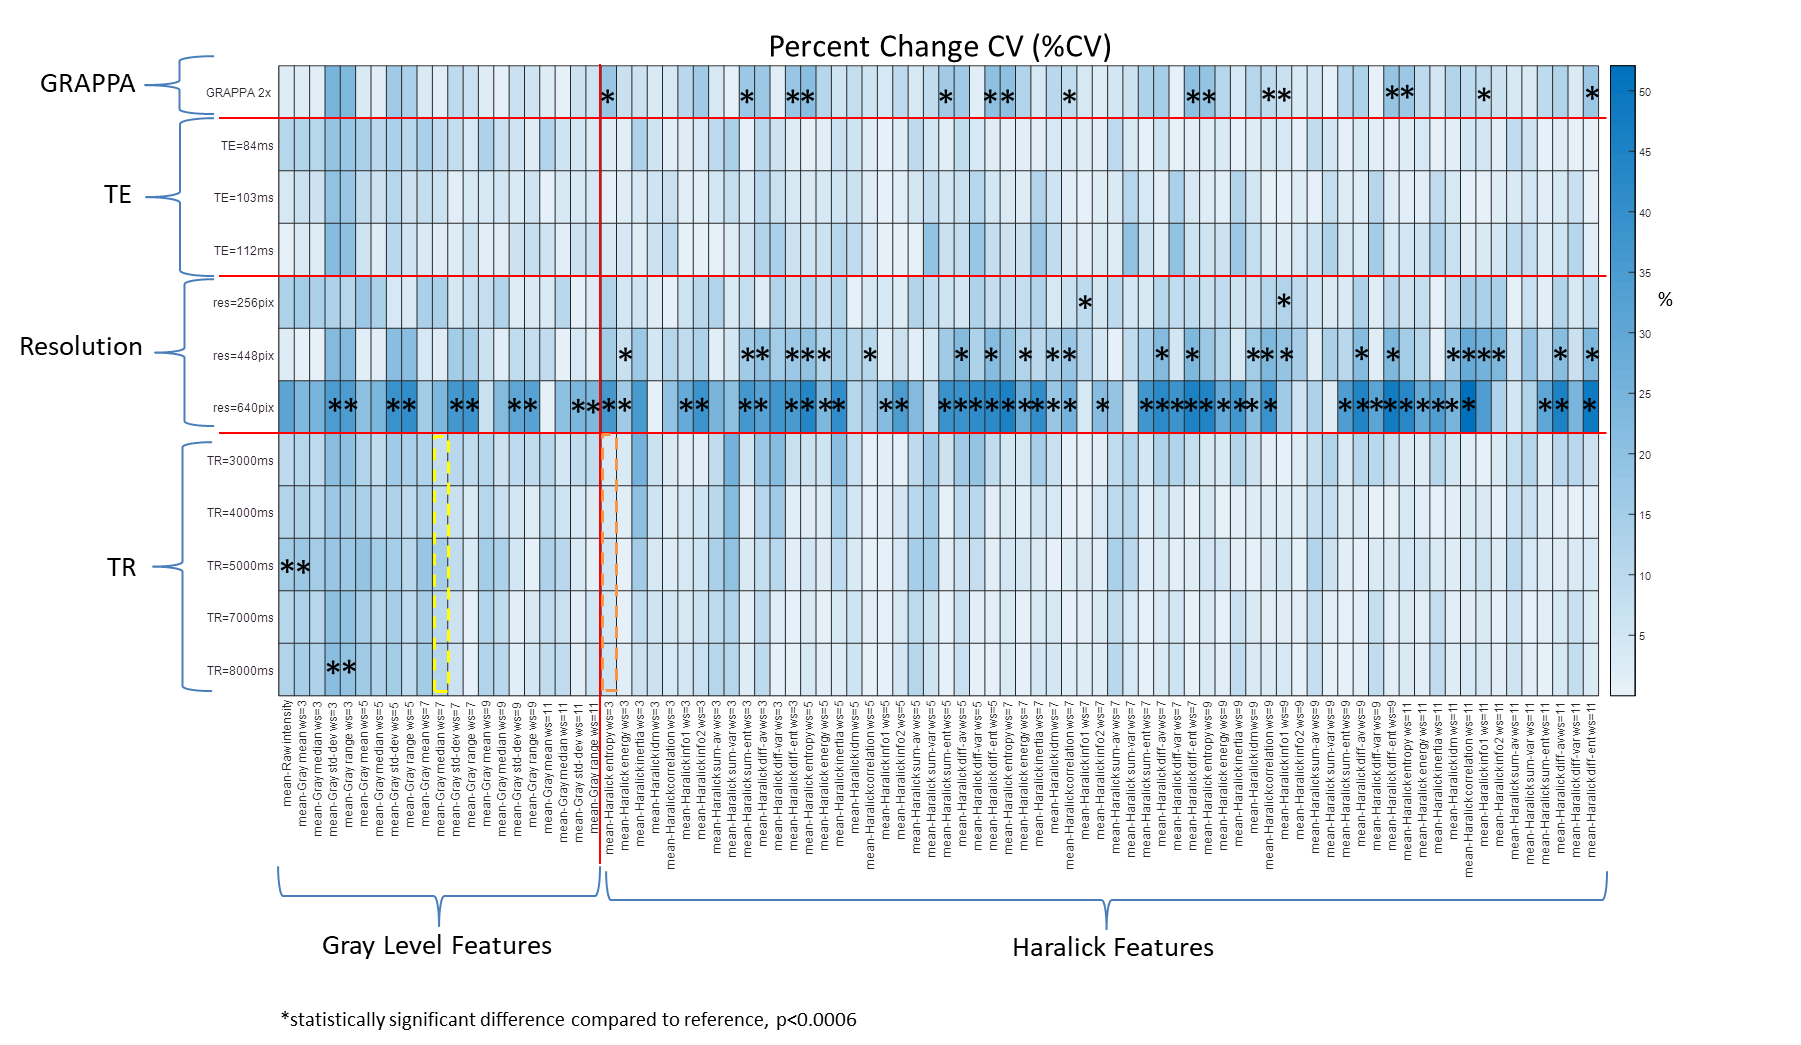
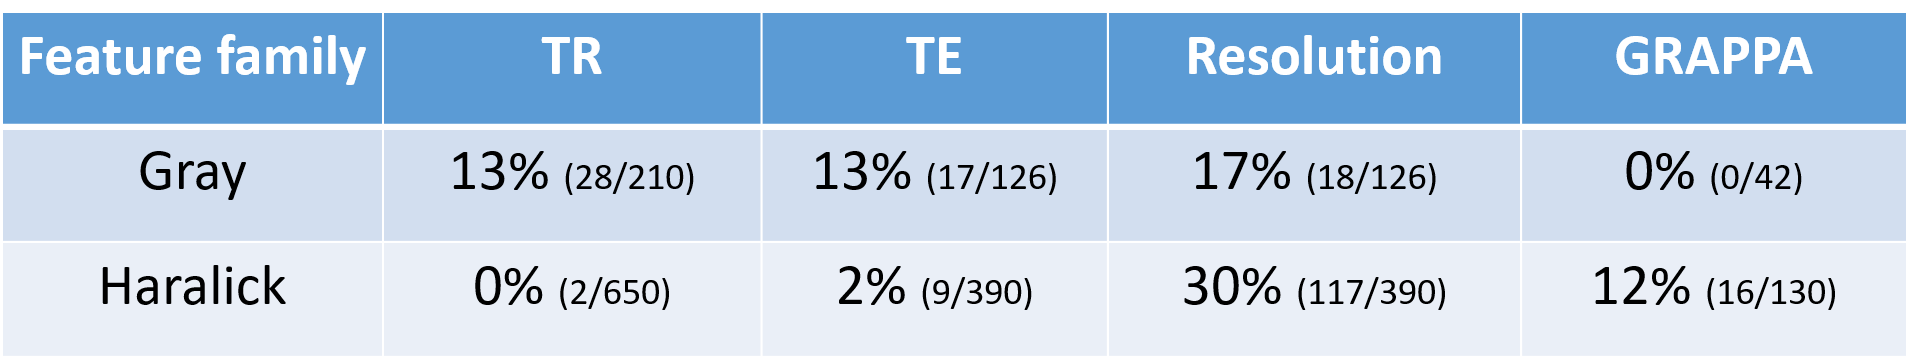
Figure 2 shows an example of changes in TR leading to changes in raw intensity appearance, as well as the impact on Gray level features (more variable) and Haralick features (more reproducible). In terms of inter-patient variability, Gray level features showed significant changes in %CM (Figure 3) across all TR and TE imaging variants compared to relatively consistent Haralick features. In terms of intra-patient variability (%CV, Figure 4), both Gray level and Haralick features were not significantly impacted across TR or TE imaging variants. Overall, Gray features were found to be primarily sensitive to TR and TE, while Haralick features were partially sensitive to GRAPPA (Table 1). Notably, both Haralick and Gray level features demonstrated significant changes across all imaging resolution variants in terms of both %CM and %CV.Discussion
The largest impact on radiomic features was caused by changes in imaging resolution. This is likely because changes in resolution impacts the area of tissue being interrogated, in turn dramatically changing local contrast and intensity compared to the reference. Changes in TR primarily impacted absolute T2 signal intensity value, and in turn first-order statistical Gray features. As Haralick features are not directly dependent on the intensity values (but instead on intensity co-occurrences), they were less affected by these changes. GRAPPA was found to impact certain Haralick features, which is likely due to interpolation and associated noise artifacts.Conclusion
Variations in acquisition parameters have substantial effects on associated radiomic texture features. Imaging resolution may have the most significant impact across all radiomic features, both in terms of inter-patient reproducibility and intra-patient tissue specificity. Additionally, Gray level features may be more sensitive to changes in contrast weighting while Haralick features may be sensitive to the use of GRAPPA. Controlling and correcting the influence of acquisition parameters on radiomic texture features is likely critical for creation of more reproducible and generalizable analytic and machine learning tools.Acknowledgements
This work was funded in part by the following sources: NIH R01HL094557, R01DK098503, R01EB016728, C06RR12463-01; NSF CBET 1553441, Siemens Healthineers (Erlangen, Germany). The content is solely the responsibility of the authors and does not necessarily represent the official views of the NIH.References
1. Chirra, P. et al. Empirical evaluation of cross-site reproducibility in radiomic features for characterizing prostate MRI. in Medical Imaging 2018: Computer-Aided Diagnosis (eds. Mori, K. & Petrick, N.) 10 (SPIE, 2018). doi:10.1117/12.2293992
2. Haralick, R. M. & Shanmugam, K. Textural features for image classification. IEEE Transactions on systems, man, and cybernetics 610–621 (1973).
Figures