1119
Uncovering 3D Axonal Morphologies with Synchrotron Imaging: Impact on Microstructure Imaging with Diffusion MRI1Danish Research Centre for Magnetic Resonance, Copenhagen University Hospital Hvidovre, Hvidovre, Denmark, 2Department of Applied Mathematics and Computer Science, Technical University of Denmark, Kongens Lyngby, Denmark, 3Signal Processing Lab (LTS5), Ecole Polytechnique Fédérale de Lausanne, Lausanne, Switzerland, 4European Synchrotron Research Facility, Grenoble, France, 5Radiology Department, Centre Hospitalier Universitaire Vaudois and University of Lausanne, Lausanne, Switzerland, 6Department of Medical Radiation Physics, Clinical Science, Lund University, Lund, Sweden
Synopsis
In this study, we segmented large axons from high resolution 3D synchrotron images of the monkey splenium. We simulate the intra-axonal MRI diffusion signal of both the segmented geometry and a simplified, corresponding cylindrical geometry, and calculate the corresponding axon diameter indices. The axon diameter index is well estimated in the simplified geometry, but is overestimated in the more complex segmented geometry, potentially due to variations in axon diameter and non-uniform trajectories. Lastly, we present the observation that segmented axons, which all have average diameters >2 µm, seem to experience similar absolute diameter variations.
Introduction
The diameter of a myelinated axon modulates its conduction speed 1. Diameters and densities of axons in white matter are thus indicators of brain performance, and a better understanding of how these properties compare in healthy/diseased conditions is important. Diffusion magnetic resonance imaging (MRI) provides non-invasive 3D insight into live brain microstructure. By designing biophysical models of the tissue architecture, axon diameter distributions (ADD) and densities can be estimated. These models e.g. ActiveAx 2, 3 and AxCaliber 4, often represent axons as parallel, straight cylinders with a distribution of diameters. Axon diameters are commonly overestimated by diffusion MRI when compared to histology and electron microscopy (EM) 3, 5, potentially due to both microstructural and mesoscopic effects e.g. diameter variations and non-parallel axons. To improve axon diameter and density estimates with diffusion MRI, knowledge concerning realistic axon morphologies is required. EM has high in-plane resolution, but suffers from long acquisition times, small field of view (FOV) and damage to tissue when slicing samples to obtain 3D volumes. Synchrotron radiation imaging (SRI) offers a non-destructive, high-resolution, large-FOV, 3D alternative.
In this study, we image samples from the corpus callosum of a monkey brain, previously studied with ActiveAx 2, with SRI. We segment large axons and observe axon diameter variation along a length of 150 µm. Furthermore, we compute the diffusion weighted (DW) signal arising from 1) the segmented axons and 2) a simplified substrate consisting of parallel cylinders. From these signals, we calculate an axon diameter index, $$$a’$$$.
Methods
Synchrotron Imaging
Splenium samples from a 32-month old female perfusion fixed Vervet monkey brain 2 were stained with 0.5% osmium tetroxide (OsO4) to give contrast to the myelin and embedded in EPON. X-ray phase contrast tomography (PCT) was performed on the samples at beamline ID16A of the European Synchrotron Research Facility (ESRF). The PCT produced 75 nm isotropic resolution 3D volumes (20483 voxels), with a cylindrical FOV of diameter and length 150 µm with an acquisition time of ~4h.
Segmentation
Large axons were roughly segmented in ITK-Snap. The axons were then automatically segmented by feeding their centerlines into a layered surface segmentation method that we have developed at the Technical University of Denmark and which detected axon-myelin boundaries. Manual correction was performed where needed. 54 meshes of axons longer than 110 µm were generated from the segmentations.
Simulations
Two substrates were used for simulations: 1) the 54 segmented axons and 2) 54 parallel cylinders with diameters equal to the average diameters of the corresponding segmented axons. The diffusion-weighted (DW) signals from these were simulated using an in-house Monte Carlo Simulator 6. The ex-vivo diffusivity was set to 0.6$$$\cdot$$$10-9 m2/s and the optimised ActiveAx 3-shell protocol described in 2 was employed.
Model Fitting
The simulated signals were fitted to a straight cylinder model with a Grid Search (GS) approach. We used the Camino toolkit 7 to generate DW signals from cylinders with diameters between 0.20 µm – 8.00 µm at intervals of 0.05 µm. These bounds were chosen to reflect the expected axon diameter range in the splenium of the monkey corpus callosum. The GS reported the axon diameter index 2, $$$a'$$$, which was the diameter of the cylinder whose signal was most similar (minimum mean-squared-error) to that of the simulated DW signal.
Results and Discussion
Figure 1 shows the diameter variations and trajectories of some axons in a sample from the monkey splenium. In Figure 2, we see that axon diameters and trajectories can vary considerably along a single axon, and that the straight cylinder model is not representative of the real axon morphology. Furthermore, we see that the quoted diameter is dependent on the diameter quantification method.
The diameter variation along axons was studied by normalizing all 54 axon diameter distributions and subtracting the respective median diameters. Although the axons had average diameters varying between 2.1 µm to 4.1 µm, Figure 3(a) surprisingly seems to suggest that they all experience similar diameter variations, regardless of diameter.
Figure 3(b) shows the average axon diameter distribution of the segmented axons. The volume-weighted mean axon diameter was 3.0 µm. For the axon segmentation, $$$a’$$$ was estimated to be 3.6 µm. This over-estimation is potentially caused by the diameter variations and non-straight trajectories present in the true, segmented axons. For the less complex simplified cylindrical substrate, $$$a’$$$ was estimated to be 2.9 µm, closely agreeing with the true mean axon diameter.
Conclusion
Synchrotron imaging enables super high resolution 3D reconstruction of axon geometries in a large field of view. The subsequent analysis of the segmentations can be used to increase our understanding of axon morphology and potentially develop improved biophysical models for microstructure imaging with diffusion MRI.
Acknowledgements
Capital Region Research Foundation (A5657)References
1. Innocenti G, Vercelli A, Caminiti R. The Diameter of Cortical Axons Depends Both on the Area of Origin and Target. Cerebral Cortex. 2014;24:2178–2188.
2. Alexander DC., Hubbard PL, Hall MG, Moore EA, Ptito M, Parker GJM, and Dyrby TB, Orientationally invariant indices of axon diameter and density from diffusion MRI. Neuroimage. 2010;52(4):1374-1389.
3. Dyrby, TB. and Sogaard LV, and Hall MG, Ptito M, Alexander DC. Contrast and stability of the axon diameter index from microstructure imaging with diffusion MRI. 2013;70(3):711-721;
4. Assaf Y, Blumenfeld-Katzir T, Yovel Y, Basser PJ. AxCaliber: a method for measuring axon diameter distribution from diffusion MRI. Magn Reson Med. 2008;59(6):1347-54.
5. Zhang H, Hubbard PL, Parker GJM, Alexander DC, Axon diameter mapping in the presence of orientation dispersion with diffusion MRI. Neuroimage. 2011;56(3):1301–1315.
6. Rafael-Patino J. MC-DC Simulator. https://github.com/jonhrafe/MC-DC-Simulator. Accessed November 7 2018.
7. Cook PA, Bai Y, Nedjati-Gilani S, Seunarine KK, Hall MG, Parker GJM, Alexander DC. Camino: open-source diffusion–MRI reconstruction and processing. Proc. Intl. Soc. Magn. Reson. Med. 2006;14.
Figures
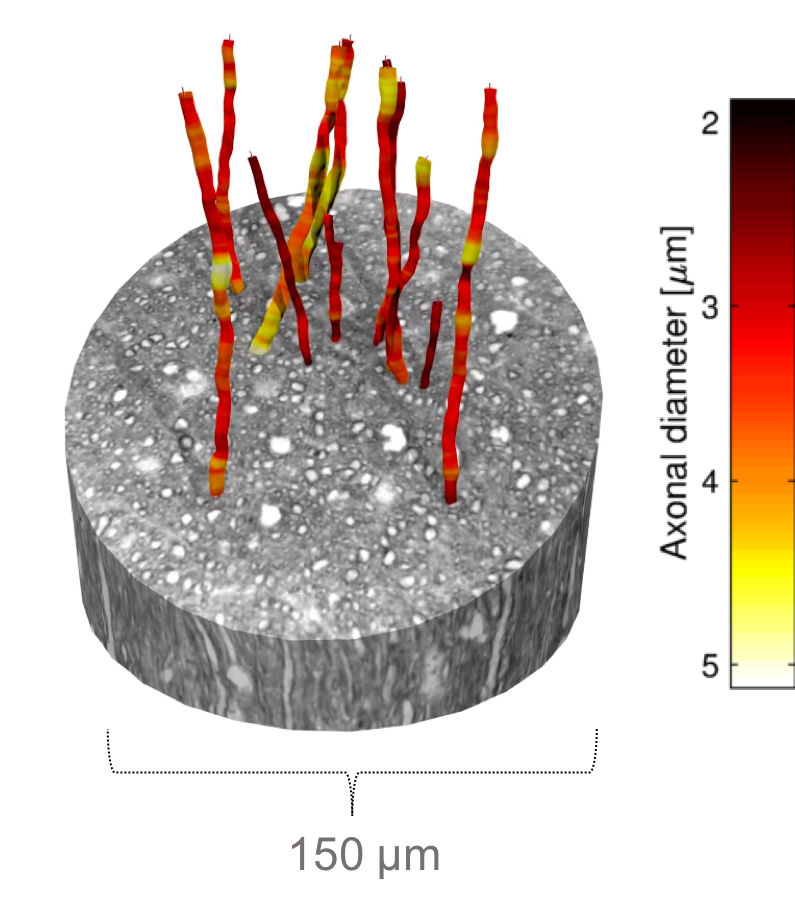
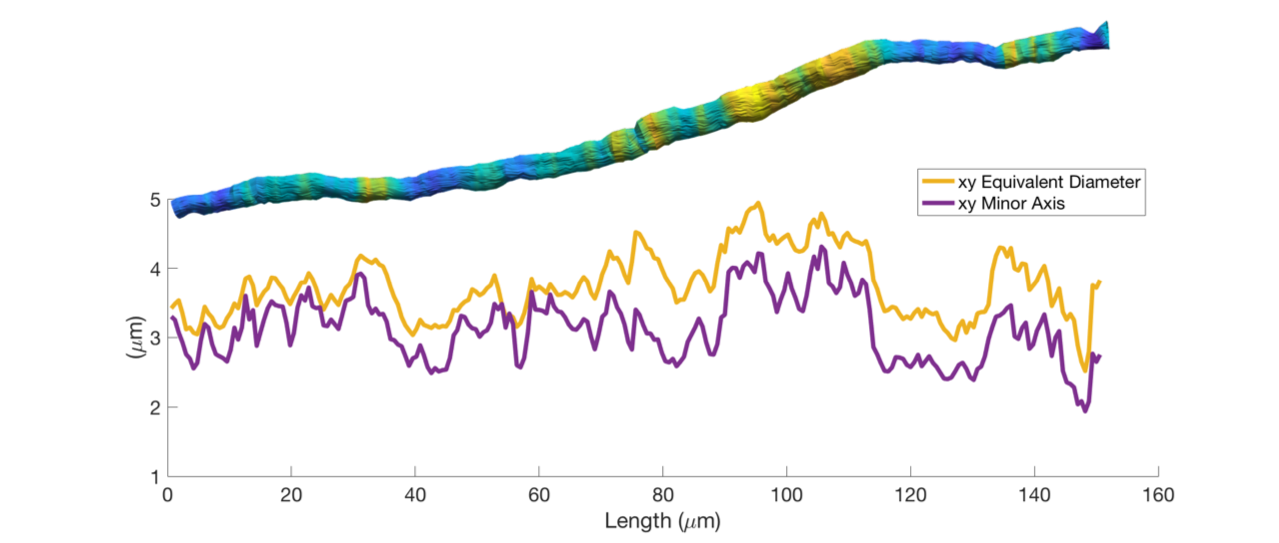
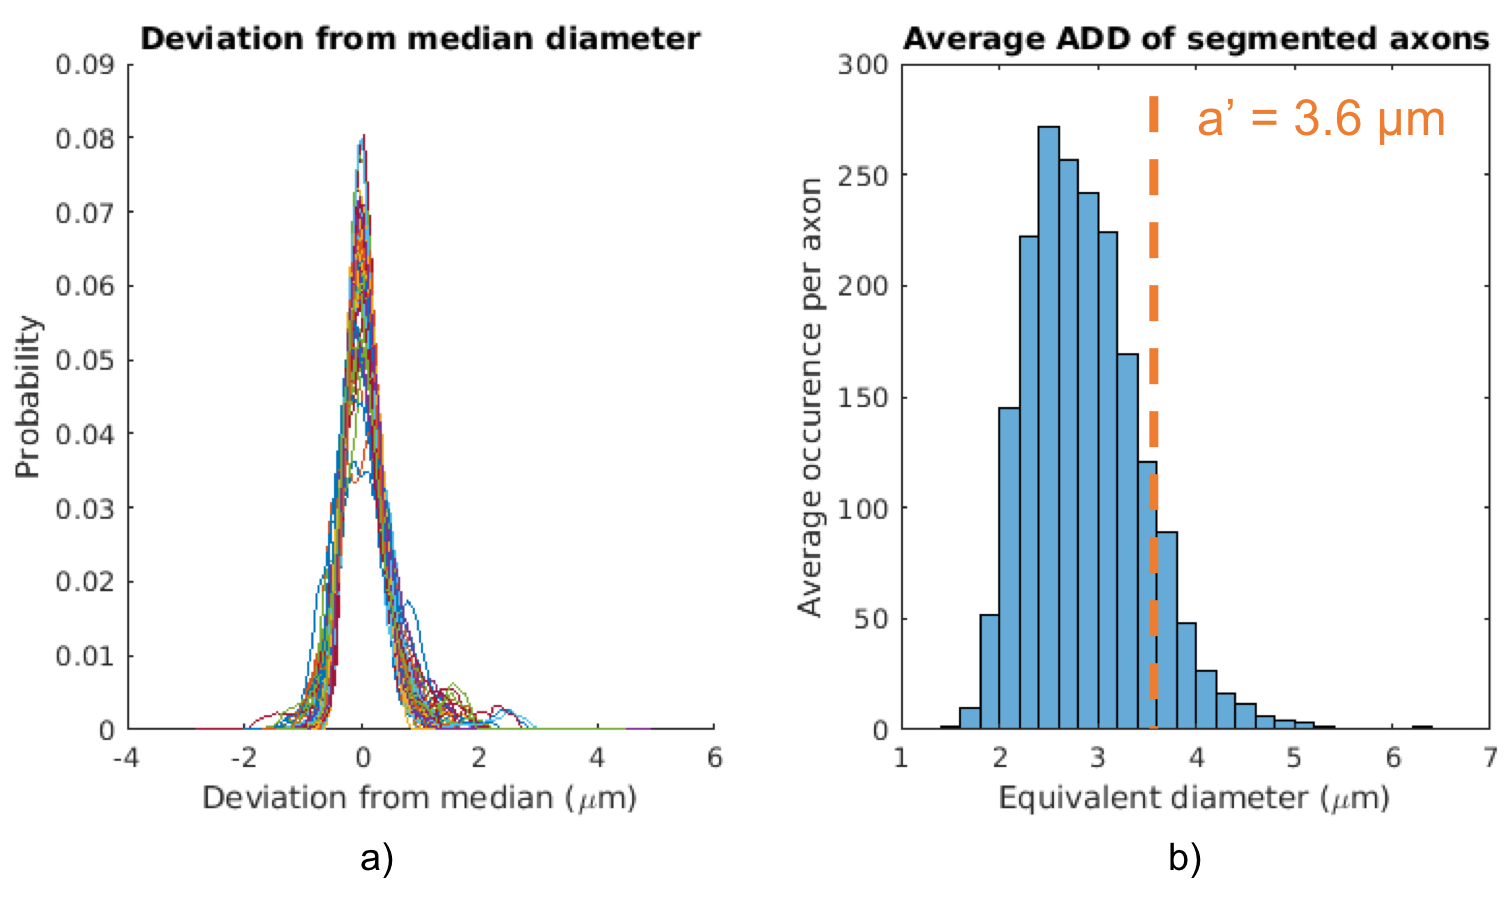
Figure 3 a) The distribution of axon diameters relative to the median diameter for each of the 54 axons. This plot describes the variance in the axon diameter along the axon length. Surprisingly, axons seem to experience similar diameter variations, regardless of individual axon average diameter.
Figure 3 b) The average ADD of the segmented axons. $$$a’$$$ is calculated as 3.6 µm -- an overestimation of the true volume-weighted average axon diameter (3 µm). This overestimation is thought to occur due to the complex geometry of the segmented axons, including varying trajectories and axon diameters.