1118
Advances in direct myelin imaging1Institute for Biomedical Engineering, ETH and University of Zurich, Zurich, Switzerland
Synopsis
Direct imaging of myelin is of great interest for improved diagnosis of neurodegenerative diseases. However, MR signals from myelin exhibit ultra-short T2 values in a range of 8 μs - 1 ms with a large fraction below 100 μs. Due to restrictions in sequence timing, current short-T2 imaging approaches cannot sufficiently capture these very short signals. In the present work, advanced short-T2 methodology and hardware are employed to actually image the majority of the ultra-short-T2 components in the brain. The abilities of the approach are proven in excised brain tissue and applied in vivo.
Introduction
Depiction and quantification of myelin is of great interest for the diagnosis of various neurodegenerative diseases. With MRI this is conventionally approached by using indirect techniques based on myelin water or magnetisation transfer1. However, due to limited specificity of such surrogate measures, direct detection of the myelin signal itself would be preferable2. The challenge for this task arises from the restricted mobility of the main constituents – lipids and proteins – of the myelin membrane. Their proton signals exhibit ultra-short T2 (uT2) values below 1 ms3-5 with a large fraction below 100 μs, including contributions as short as 8 μs6. Therefore, dedicated short-T2 techniques have been employed to directly image the uT2 signals of myelin2,6-9.
However, in all current approaches the timing of the MR sequence is not fully suited to sufficiently capture and spatially encode the large portion of signals with T2s below 100 μs. In particular, either extended excitation pulses, echo times (TE), gradient ramping, or readout times lead to considerable loss or blurring of such signals in the image2,10.
In the present work, advanced short-T2 methodology and hardware are employed to actually image the majority of the uT2 components in the brain. The abilities of the approach are proven in excised brain tissue and applied in vivo.
Methods
The basic requirements for proper depiction of uT2 components are short delays between signal excitation and acquisition and rapid spatial encoding. These were met by using RF hardware capable of creating short excitation pulses and switching rapidly from transmit to receive operation, and by employing a high-performance gradient system. These capabilities were exploited in short-T2 sequences tailored to achieve suitable resolution and SNR at the targeted T2s within useful scan times.
Hardware: 3T Philips Achieva; insert gradient providing strength G = 200 mT/m with slew rate 600 mT/m/ms at 100 % duty cycle11; custom-built RF chain12; rapid T/R switches13; proton-free loop and birdcage coils14,15.
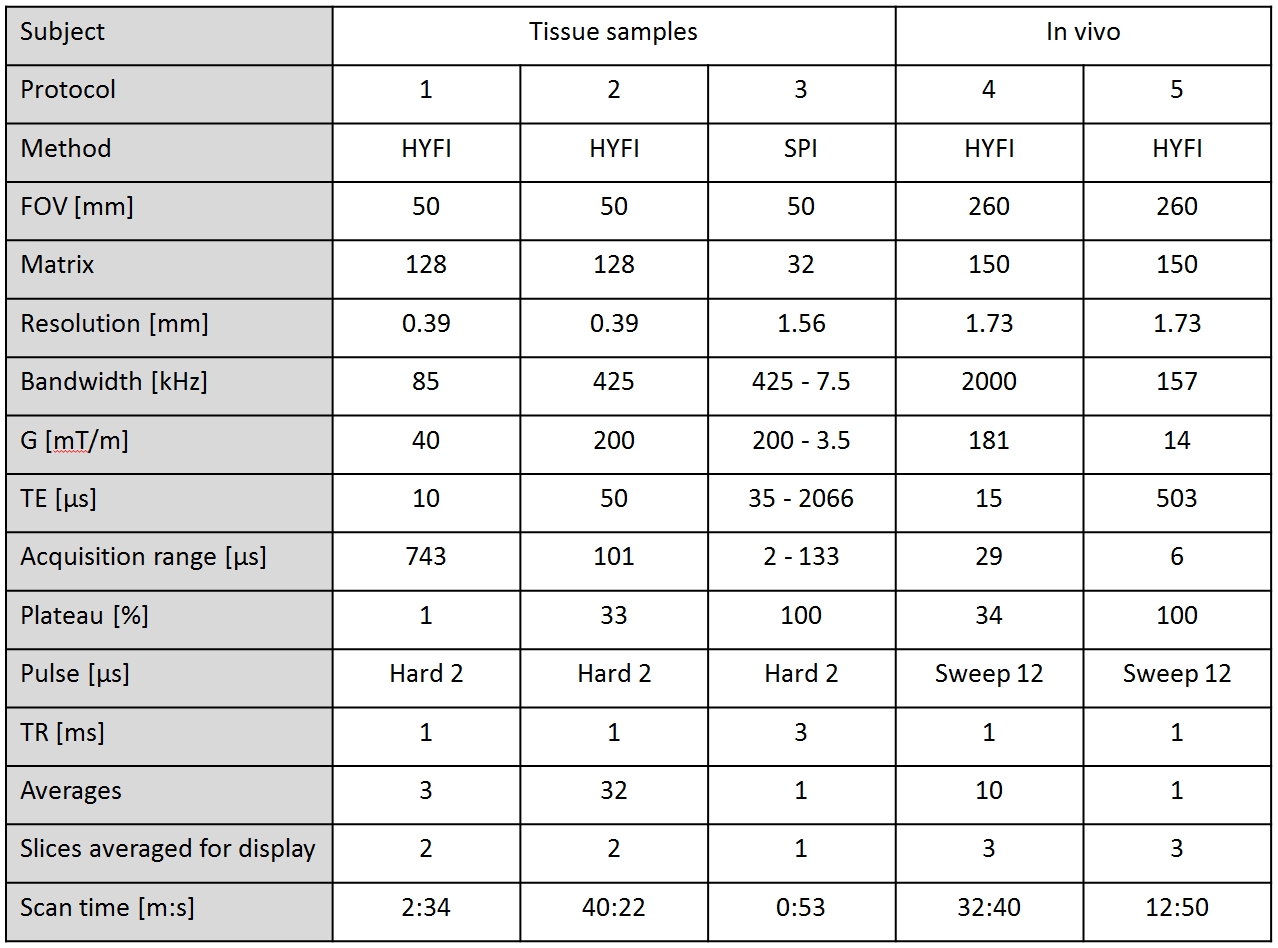
Imaging: Sequences were used that maximally exploit gradient strength by performing both excitation and acquisition under the gradient employed for radial centre-out encoding16. In particular, imaging with hybrid filling (HYFI)17,18 and single-point imaging (SPI)19,20 were performed. Both techniques reduce the influence of T2* decay on image blurring by providing a plateau of (near-)equal T2* weighting in central k-space at delay TE. See Table 1 for the protocols employed.
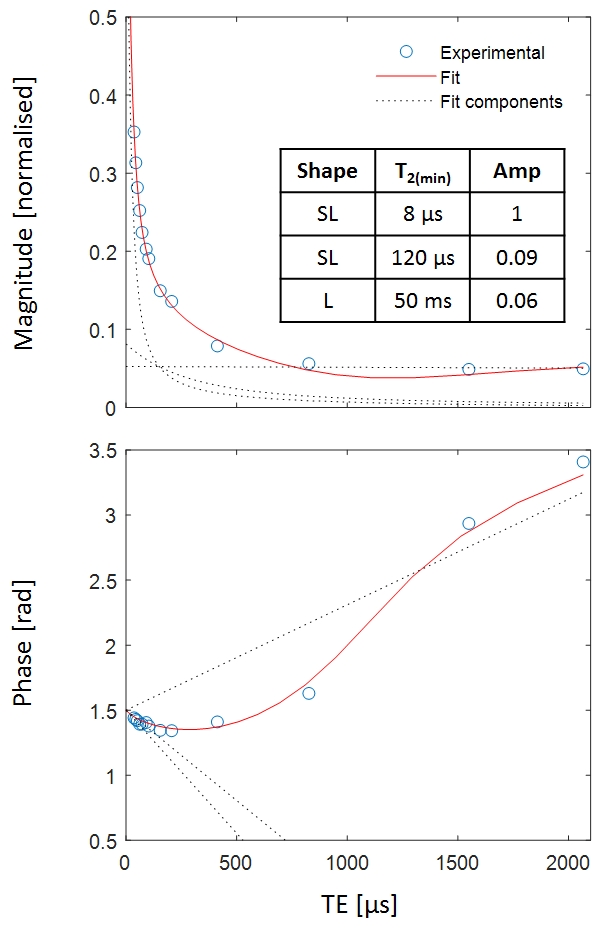
Fitting: To prove the existence of uT2 components in the data, a series of SPI images with different TE was acquired. The observed signal evolution was fitted with a complex-valued model21,22 including components with Super-Lorentzian (SL)6 and Lorentzian lineshapes (Figure 2).
Samples and subjects: Porcine brain tissue (thickness 5 mm, diameter 30 mm) at room temperature with and without D2O exchange6. One healthy human subject.
Results
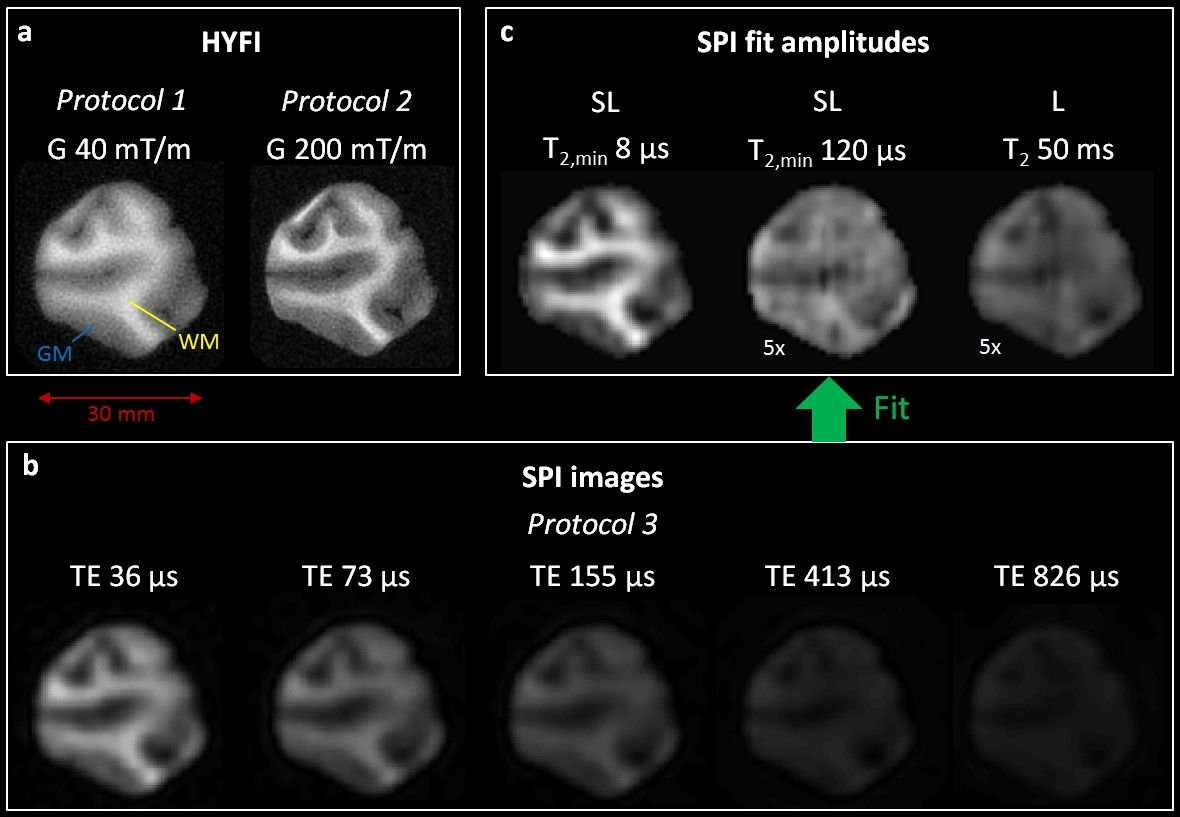
Figure 1 shows results obtained in the D2O-exchanged tissue sample. The HYFI image with strongly reduced acquisition range exhibits improved resolution and contrast, indicating dominating uT2 signal. This is confirmed by the rapid signal decay in the SPI series at increasing TE. In the fitted amplitude maps the shortest and strongest component is most characteristic for white matter (WM), indicating a large contribution from myelin.
Figure 2 shows signal evolution and fit results in WM pixels of the SPI series of Figure 1. It demonstrates that a SL component with minimum T2 of 8 μs dominates the signal in the sample. Note that a SL covers a continuum of T2 values over several orders of magnitude.
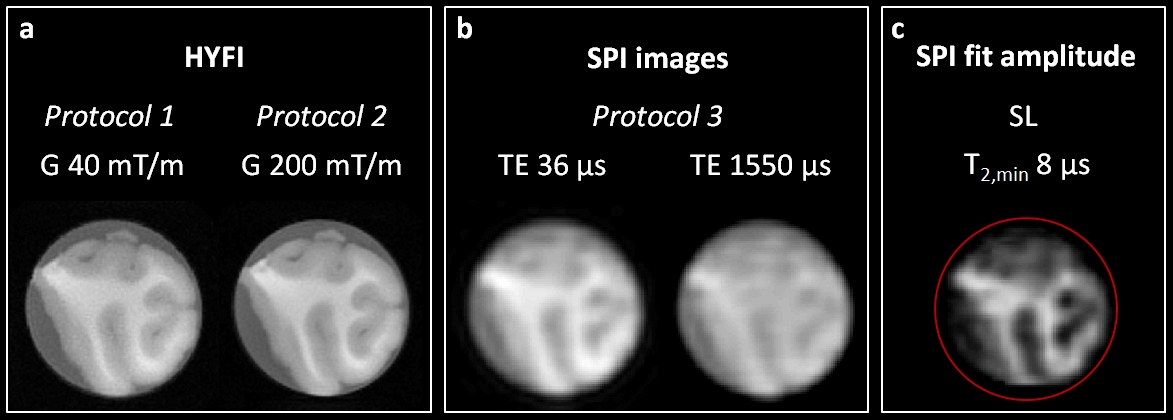
Figure 3 shows the equivalent results to Figure 1 for the non-D2O-exchanged sample. Here, long-T2 signals dominate the images. Nevertheless, a fitted amplitude map can be generated, exhibiting WM-GM contrast that is comparable to the D2O-exchanged sample.
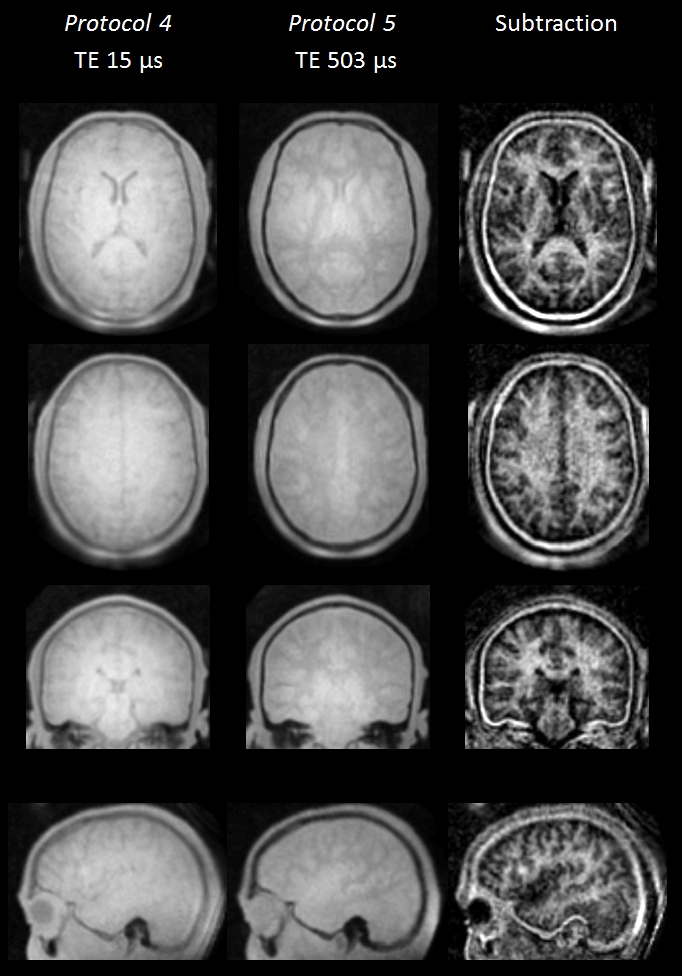
Figure 4 demonstrates in vivo application of the presented technique capable of imaging large portions of the uT2 signal in the brain. In the raw images, WM signal is clearly reduced at longer TE. The subtraction image showing primarily uT2 signals exhibits a clear WM-GM contrast.
Discussion
It was demonstrated that advanced short-T2 methodology and hardware actually enable imaging of the majority of the ultra-short T2 components in the brain. As these signals are dominated by the myelin membrane6, it is expected that the intensities in the presented images have a high specificity for myelin content. Hence, the presented approach may contribute to improved myelin quantification by MRI. In-vivo feasibility was demonstrated but is currently limited by SNR, SAR, and scan time constraints. Improvements are expected from more advanced RF coil design and further sequence optimisation. Moreover, expanding in-vivo scanning to more than two TEs is desirable to enable signal modelling as demonstrated in the in-vitro data.Acknowledgements
References
[1] C. Laule, I.M. Vavasour, S.H. Kolind, D.K.B. Li, T.L. Traboulsee, G.R.W. Moore, A.L. MacKay, Magnetic Resonance Imaging of Myelin, Neurotherapeutics, 4 (2007) 460-484.
[2] A.C. Seifert, C. Li, M.J. Wilhelm, S.L. Wehrli, F.W. Wehrli, Towards quantification of myelin by solid-state MRI of the lipid matrix protons, NeuroImage, 163 (2017) 358-367.
[3] M. Bloom, K.T. Holmes, C.E. Mountford, P.G. Williams, Complete proton magnetic resonance in whole cells, Journal of Magnetic Resonance (1969), 69 (1986) 73-91.
[4] A. Ramani, A. Aliev, G. Barker, P. Tofts, Another approach to protons with constricted mobility in white matter: pilot studies using wideline and high-resolution NMR spectroscopy, Magn Reson Imag, 21 (2003) 1039-1043.
[5] R.A. Horch, J.C. Gore, M.D. Does, Origins of the ultrashort‐T2 1H NMR signals in myelinated nerve: a direct measure of myelin content?, Magn Reson Med, 66 (2011) 24-31.
[6] M.J. Wilhelm, H.H. Ong, S.L. Wehrli, C. Li, P.H. Tsai, D.B. Hackney, F.W. Wehrli, Direct magnetic resonance detection of myelin and prospects for quantitative imaging of myelin density, Proc Natl Acad Sci, 109 (2012) 9605-9610.
[7] K.S. Nayak, J.M. Pauly, G.E. Gold, D.G. Nishimura, Imaging ultra-short T2 species in the brain, In Proceedings of the 8th Annual Meeting of ISMRM, Denver, USA, 2000, p.509
[8] A. Waldman, J. Rees, C. Brock, M. Robson, P. Gatehouse, G. Bydder, MRI of the brain with ultra-short echo-time pulse sequences, Neuroradiology, 45 (2003) 887-892.
[9] J. Du, G. Ma, S. Li, M. Carl, N.M. Szeverenyi, S. VandenBerg, J. Corey-Bloom, G.M. Bydder, Ultrashort echo time (UTE) magnetic resonance imaging of the short T2 components in white matter of the brain using a clinical 3T scanner, NeuroImage, 87 (2014) 32-41.
[10] S.-J. Fan, Y. Ma, Y. Zhu, A. Searleman, N.M. Szeverenyi, G.M. Bydder, J. Du, Yet more evidence that myelin protons can be directly imaged with UTE sequences on a clinical 3T scanner: Bicomponent T2* analysis of native and deuterated ovine brain specimens, Magn Reson Med, (2017).
[11] M. Weiger, J. Overweg, M.B. Rösler, R. Froidevaux, F. Hennel, B.J. Wilm, A. Penn, U. Sturzenegger, W. Schuth, M. Mathlener, M. Borgo, P. Börnert, C. Leussler, R. Luechinger, B.E. Dietrich, J. Reber, D.O. Brunner, T. Schmid, L. Vionnet, K.P. Pruessmann, A high-performance gradient insert for rapid and short-T2 imaging at full duty cycle, Magn Reson Med, 79 (2018) 3256-3266.
[12] M. Weiger, D.O. Brunner, B.E. Dietrich, C.F. Muller, K.P. Pruessmann, ZTE imaging in humans, Magn Reson Med, 70 (2013) 328-332.
[13] D.O. Brunner, L. Furrer, M. Weiger, W. Baumberger, T. Schmid, J. Reber, B.E. Dietrich, B.J. Wilm, R. Froidevaux, K.P. Pruessmann, Symmetrically biased T/R switches for NMR and MRI with microsecond dead time, J Magn Reson, 263 (2016) 147-155.
[14] M.B. Rösler, M. Weiger, T. Schmid, D.O. Brunner, R. Froidevaux, K.P. Pruessmann, Ultrasonic soldering on glass for the construction of MRI coils with minimized background signal in short-T2 images, In Proceedings of the 33rd Annual Scientific Meeting of ESMRMB, Vienna, Austria, 2016, p.87
[15] M.B. Rösler, M. Weiger, D.O. Brunner, T. Schmid, R. Froidevaux, K.P. Pruessmann, An RF birdcage coil designed for an insert gradient coil dedicated to short-T2 MRI, In Proceedings of the 25th Annual Scientific Meeting of ISMRM, Honolulu, Hawaii, USA, 2017, p.2668
[16] M. Weiger, K.P. Pruessmann, MRI with zero echo time, in: eMagRes, John Wiley & Sons, Ltd, Chichester, United Kingdom, 2012, pp. 311-322.
[17] R. Froidevaux, M. Weiger, K.P. Pruessmann, HYFI: Hybrid filling for improved scan efficiency in zero echo time imaging with large dead-time gaps, In Proceedings of the 34th Annual Meeting of ESMRMB, Barcelona, Spain, 2017, p.303
[18] R.N. Froidevaux, M.B. Rösler, D.O. Brunner, M. Weiger, K.P. Pruessmann, HYFI: Hybrid filling of the dead-time gap for faster zero echo time imaging, In Proceedings of the 27th Annual Meeting of ISMRM, Montreal, Canada, 2019
[19] S. Emid, J. Creyghton, High resolution NMR imaging in solids, Physica B+ C, 128 (1985) 81-83.
[20] B.J. Balcom, R.P. MacGregor, S.D. Beyea, D.P. Green, R.L. Armstrong, T.W. Bremner, Single-point ramped imaging with T1 enhancement (SPRITE), J Magn Reson Ser A, 123 (1996) 131-134.
[21] Y. Nam, J. Lee, D. Hwang, D.-H. Kim, Improved estimation of myelin water fraction using complex model fitting, NeuroImage, 116 (2015) 214-221.
[22] T. Boucneau, P. Cao, S. Tang, M. Han, D. Xu, R.G. Henry, P.E.Z. Larson, In vivo characterization of brain ultrashort-T2 components, Magn Reson Med, 80 (2018) 726-735.
Figures