1117
Simple scheme for correcting bias in axonal water fraction due to differences in compartmental transverse relaxation times1Department of Neurology, Medical University of South Carolina, Charleston, SC, United States, 2Department of Neuroscience, Medical University of South Carolina, Charleston, SC, United States, 3Center for Biomedical Imaging, Medical University of South Carolina, Charleston, SC, United States
Synopsis
Neglecting differences in compartmental transverse relaxation times when modeling diffusion MRI data may affect the accuracy of estimates for microstructural parameters. Here we propose a straightforward method for correcting the bias in the axonal water fraction (AWF), as calculated from the fiber ball white matter (FBWM) model, due to T2 differences between the intra-axonal and extra-axonal compartments. This correction scheme simply requires that one additional high b-value shell be acquired at a different echo time than for the standard dataset needed for FBWM. AWF values were found to be 16% lower, on average, after the T2 correction.
Introduction
Although studies have shown significant differences in the T2 relaxation times for the intra- and extra-axonal compartments in white matter1-6, these differences are often neglected in microstructural models based on diffusion MRI (dMRI) data7-11. This potentially affects the accuracy of estimated modeling parameters, particularly for compartmental water fractions. More specifically, the intra-axonal T2 is believed to be longer than the extra-axonal T23-5, which may lead to overestimates for the axonal water fraction (AWF) if the T2 difference is neglected6. Here we show how to correct this T2 bias in the AWF for a dMRI method known as fiber ball white matter (FBWM) modeling10. FBWM requires data for three b-value shells at a single echo time. To correct for T2 bias in the AWF, an additional high b-value shell is acquired at a second echo time. The implementation of this correction only involves simple analytic formulae and does not increase the numerical complexity of FBWM.Methods
Monopolar dMRI data from one healthy adult (30 yrs) was acquired on a Siemens Prisma scanner for b=1000, 2000, and 6000 s/mm2 with 30, 30, and 64 diffusion-encoding directions, respectively. Other imaging parameters were: TE=90ms, TR=3800ms, voxel size=(3mm)3, number slices=42, FOV=(222mm)2, diffusion time (∆)=44.1ms, gradient pulse duration (δ)=24.9ms, and bandwidth=1438Hz/px. We obtained an additional b=6000 s/mm2 dataset using identical gradient directions and imaging parameters except that TE=140ms, ∆=69.1ms and δ=49.9ms. Each dMRI dataset also included 5 images with b=0 s/mm2. The total acquisition time was 14min and 12s. Data quality was improved by reducing signal noise12, removing Gibbs ringing artifacts13, correcting for Rician noise bias14, and eddy currents15.
We recently proposed a new technique to measure intra-and extra-axonal T2 ($$$T_{2a}$$$,$$$T_{2e}$$$)16 from which the corrected AWF can be calculated using $$f=\frac{f^{*}\cdot e^{-TE/T_{2e}}}{f^{*}\cdot e^{-TE/T_{2e}}+(1-f^{*})\cdot e^{-TE/T_{2a}}},$$ where $$$f^{*}$$$ is the apparent (i.e., T2-weighted) AWF determined with FBWM at a given TE.
Briefly, since the direction-averaged dMRI signal ($$$\overline{S}$$$) at high b-values in white matter is dominated by intra-axonal water17,18, its TE-dependence is simply $$\overline{S}(TE)=C_{a}\cdot e^{-TE/T_{2a}},$$ with $$$C_{a}$$$ being a constant. When data for two echo times ( $$$TE_{1}$$$,$$$TE_{2}$$$) are available, we therefore have $$T_{2a}=\frac{TE_{2}-TE_{1}}{ln\begin{bmatrix}\frac{\overline{S}(TE_{1})}{\overline{S}(TE_{2})} \end{bmatrix}}.$$ Provided one also has the dMRI signal with b = 0 s/mm2 ($$$S_{0}$$$) along with knowledge of $$$D_{a}$$$, $$$T_{2e}$$$ may be similarly calculated from $$T_{2e}=\frac{TE_{2}-TE_{1}}{ln\begin{bmatrix}\frac{{F}(TE_{1})}{{F}(TE_{2})} \end{bmatrix}},$$ where $$F(TE)\equiv S_{0}(TE)-2\overline{S}(TE)\sqrt{\frac{bD_{a}}{\pi}}.$$
The parameters $$$f^{*}$$$ and $$$D_{a}$$$ were calculated using FBWM from data with TE=90ms ($$$TE_{1}$$$). FBWM combines dMRI data for weak and strong diffusion weightings to create a cost function with $$$f^{*}$$$ as the single adjustable parameter. Minimization of this cost function results in estimates of $$$f^{*}$$$ and $$$D_{a}$$$. More details can be found in McKinnon et al10
After calculating the standard FBWM microstructural parameters, we applied our correction scheme to find $$$T_{2a}$$$,$$$T_{2e}$$$, and the corrected AWF, $$$f$$$, within the white matter using the additional data with b=6000 s/mm2 and TE=140ms ($$$TE_{2}$$$). Voxels with a mean diffusivity<1.5 µm2/ms and a mean kurtosis>1.0 were considered white matter19. Diffusion metrics were calculated using standard tensor analyses20. Average $$$f$$$ and $$$f^{*}$$$ were estimated for 10 regions of interest by reference to the Johns Hopkins University white matter atlas20.
Results
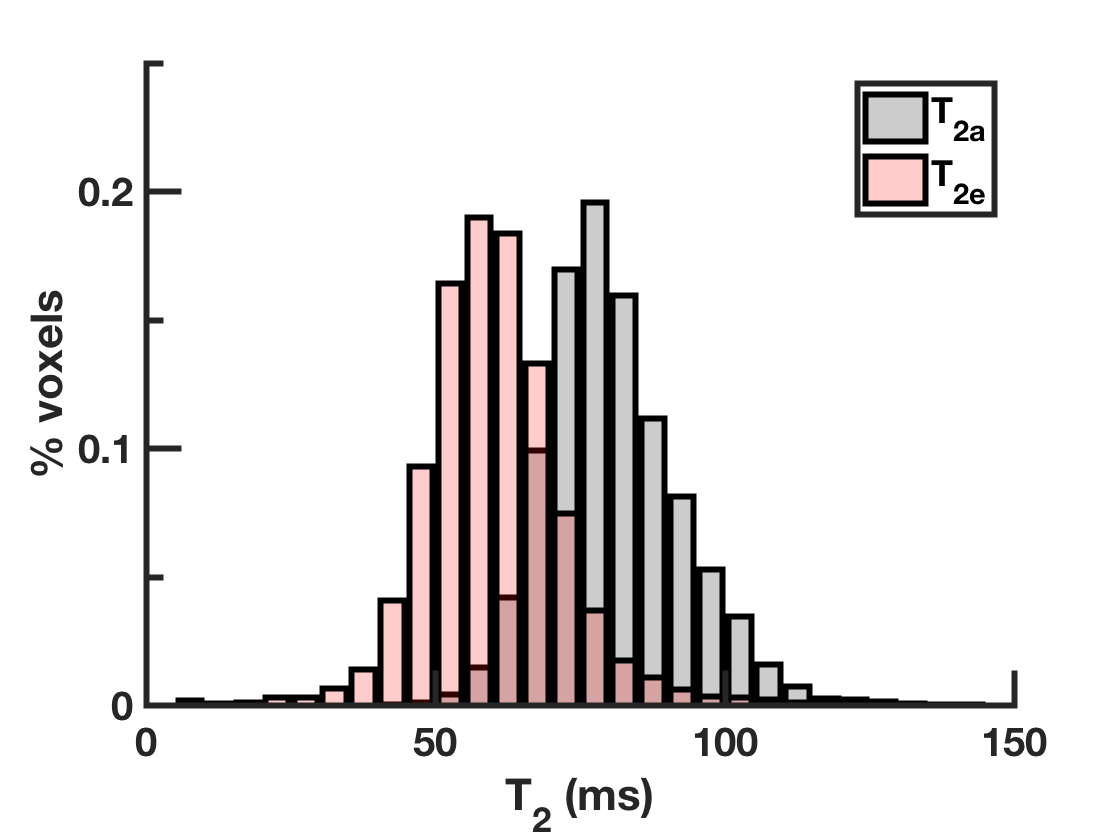
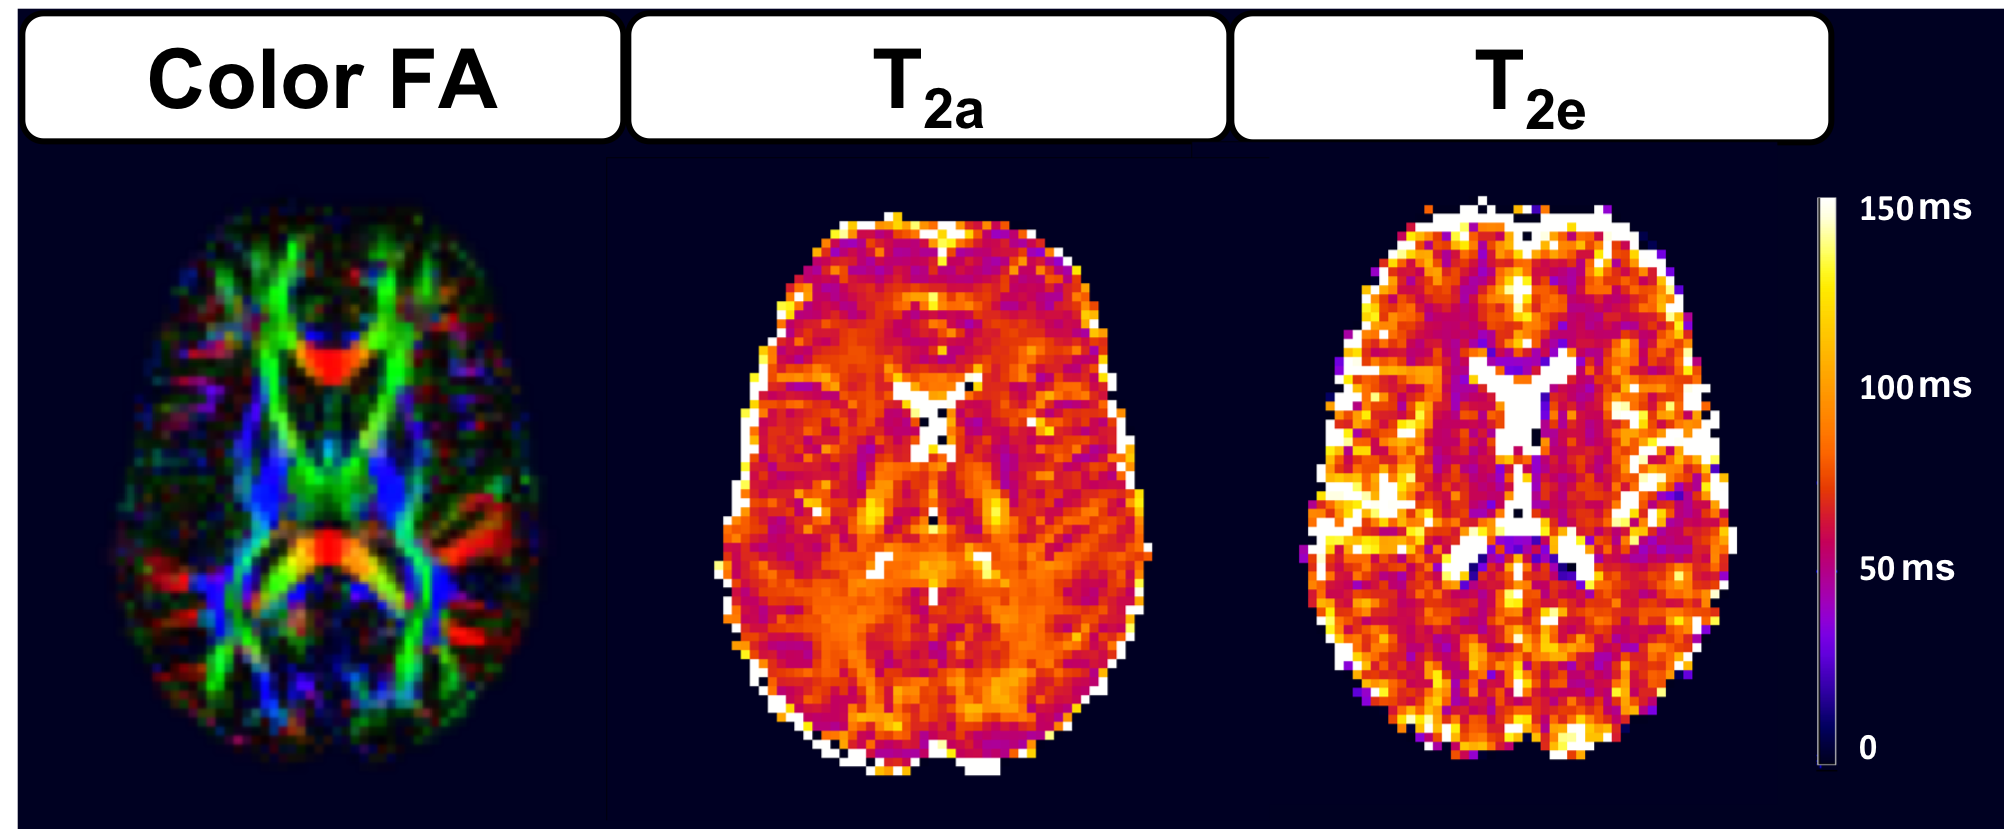
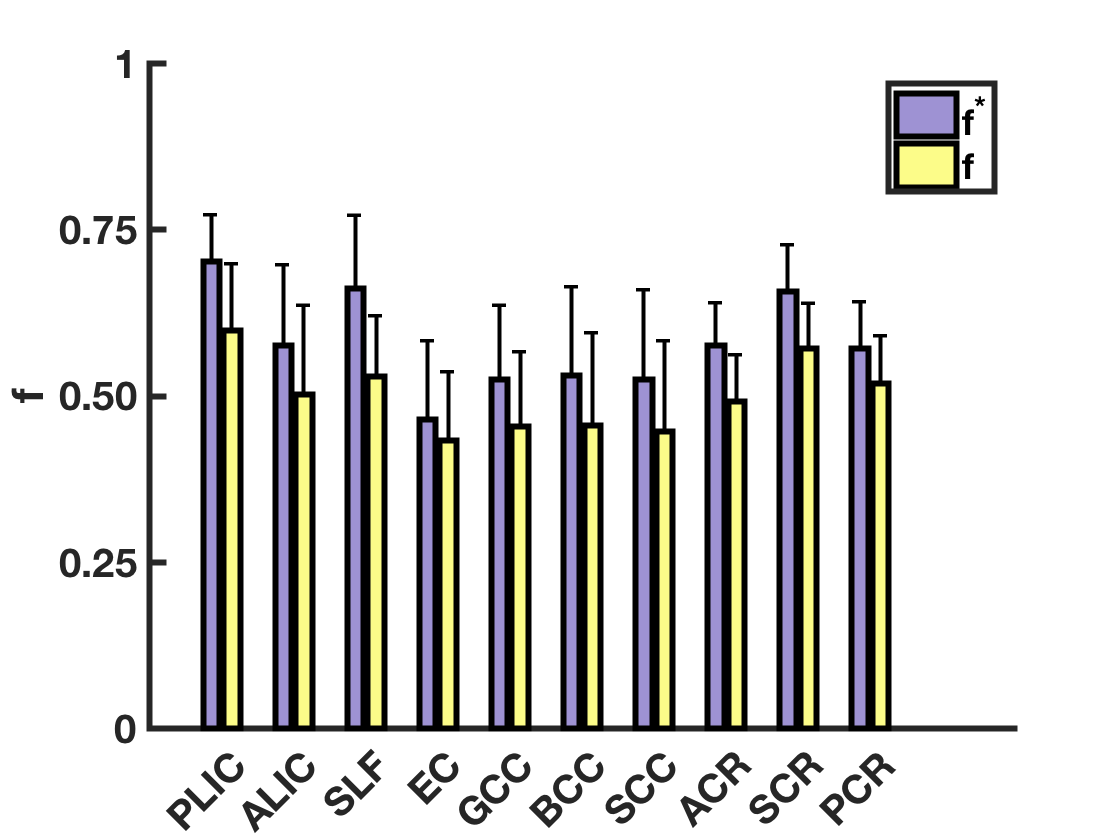
Figure 1 shows the distribution of $$$T_{2a}$$$ and $$$T_{2e}$$$ values within the white matter. The average $$$T_{2a}$$$ and $$$T_{2e}$$$ are 80.8±12ms and 60.8±26ms respectively. Voxelwise parametric $$$T_{2a}$$$ and $$$T_{2e}$$$ maps are given for an anatomical slice in Figure 2. The regional variability in $$$T_{2a}$$$ is noteworthy with lower $$$T_{2a}$$$ values found in the frontal white matter and higher $$$T_{2a}$$$ values in the posterior limb of the internal capsule. Average $$$f^{*}$$$ and $$$f$$$ are reported in Figure 3. Since $$$T_{2a}$$$>$$$T_{2e}$$$ in most voxels, $$$f$$$ is smaller than $$$f^{*}$$$ in all regions considered. On average, AWF values are 16% lower after correcting for the difference in compartmental relaxation times.Discussion
As in prior studies1-6, we find that compartmental T2 relaxation times are not equal in white matter, with $$$T_{2a}$$$ being on average about 20ms longer than $$$T_{2e}$$$. Correcting this difference lowers our AWF estimates obtained with FBWM substantially, demonstrating that the uncorrected AWF has a considerable degree of T2-weighting. This confirms previous work by Veraart and coworkers using the TEdDI method6. A crucial difference between our approach and TEdDI is that correcting for the T2 bias required no additional numerical fitting, making it simple to implement and potentially improves accuracy and precision. In summary, we have described a straightforward calculation scheme to correct T2 bias for the AWF, which requires minimal additional data acquisition. While this approach is particularly well-suited for FBWM, it may also be adapted to other dMRI modeling methods for white matter.Acknowledgements
This work was supported in part by National Institutes of Health research grants T32GM008716 (to N. DeMore) and T32DC014435 (to J. Dubno).References
1. Vasilescu V, Katona E, Simplaceanu V, Demco D. Water compartments in the myelinated nerve. III. Pulsed NMR results. Experientia 1978;34(11):1443-1444.
2. Beaulieu C, Fenrich FR, Allen PS. Multicomponent water proton transverse relaxation and T2-discriminated water diffusion in myelinated and nonmyelinated nerve. Magn Reson Imaging 1998;16(10):1201-1210.
3. Peled S, Cory DG, Raymond SA, Kirschner DA, Jolesz FA. Water diffusion, T(2), and compartmentation in frog sciatic nerve. Magn Reson Med 1999;42(5):911-918.
4. Wachowicz K, Snyder RE. Assignment of the T(2) components of amphibian peripheral nerve to their microanatomical compartments. Magn Reson Med 2002;47(2):239-245.
5. Dortch RD, Apker GA, Valentine WM, Lai B, Does MD. Compartment-specific enhancement of white matter and nerve ex vivo using chromium. Magn Reson Med 2010;64(3):688-697.
6. Veraart J, Novikov DS, Fieremans E. TE dependent Diffusion Imaging (TEdDI) distinguishes between compartmental T2 relaxation times. Neuroimage 2017.
7. Jespersen SN, Kroenke CD, Ostergaard L, Ackerman JJ, Yablonskiy DA. Modeling dendrite density from magnetic resonance diffusion measurements. Neuroimage 2007;34(4):1473-1486.
8. Fieremans E, Jensen JH, Helpern JA. White matter characterization with diffusional kurtosis imaging. Neuroimage 2011;58(1):177-188.
9. Zhang H, Schneider T, Wheeler-Kingshott CA, Alexander DC. NODDI: practical in vivo neurite orientation dispersion and density imaging of the human brain. Neuroimage 2012;61(4):1000-1016.
10. McKinnon ET, Helpern JA, Jensen JH. Modeling white matter microstructure with fiber ball imaging. Neuroimage 2018;176:11-21.
11. Novikov DS, Veraart J, Jelescu IO, Fieremans E. Rotationally-invariant mapping of scalar and orientational metrics of neuronal microstructure with diffusion MRI. Neuroimage 2018;174:518-538.
12. Veraart J, Novikov DS, Christiaens D, Ades-Aron B, Sijbers J, Fieremans E. Denoising of diffusion MRI using random matrix theory. Neuroimage 2016;142:394-406.
13. Kellner E, Dhital B, Kiselev VG, Reisert M. Gibbs-ringing artifact removal based on local subvoxel-shifts. Magn Reson Med 2016;76(5):1574-1581.
14. Gudbjartsson H, Patz S. The Rician distribution of noisy MRI data. Magn Reson Med 1995;34(6):910-914.
15. Andersson JLR, Sotiropoulos SN. An integrated approach to correction for off-resonance effects and subject movement in diffusion MR imaging. Neuroimage 2016;125:1063-1078.
16. McKinnon ET, Jensen JH. Measuring Intra-axonal T2 in White Matter with Direction-averaged Diffusion MRI. Magn Reson Med 2019 (in press).
17. Veraart J, Fieremans E, Novikov DS. On the scaling behavior of water diffusion in human brain white matter. Neuroimage 2018.
18. McKinnon ET, Jensen JH, Glenn GR, Helpern JA. Dependence on b-value of the direction-averaged diffusion-weighted imaging signal in brain. Magn Reson Imaging 2017;36:121-127.
19. Yang AW, Jensen JH, Hu CC, Tabesh A, Falangola MF, Helpern JA. Effect of cerebral spinal fluid suppression for diffusional kurtosis imaging. J Magn Reson Imaging 2013;37(2):365-371.
20. Tabesh A, Jensen JH, Ardekani BA, Helpern JA. Estimation of tensors and tensor-derived measures in diffusional kurtosis imaging. Magn Reson Med 2011;65(3):823-836.
21. Oishi K, Zilles K, Amunts K, Faria A, Jiang H, Li X, Akhter K, Hua K, Woods R, Toga AW, Pike GB, Rosa-Neto P, Evans A, Zhang J, Huang H, Miller MI, van Zijl PC, Mazziotta J, Mori S. Human brain white matter atlas: identification and assignment of common anatomical structures in superficial white matter. Neuroimage 2008;43(3):447-457.
Figures