1116
A Novel MRI technique for quantifying myelin in mice brain white matter1Biomedical Engineering, Tel Aviv University, Tel Aviv, Israel, 2School of Chemistry, Tel Aviv University, Tel Aviv, Israel, 3Sagol School of Neuroscience, Tel Aviv University, Tel Aviv, Israel
Synopsis
In vivo myelin imaging in MS could provide a tracking tool for demyelination and facilitating the development of new therapeutic agents that may promote remyelination. We propose to use a recently reported MRI sequence, MEX, which measures a signal linearly dependent on the myelin protons fraction in the tissue, F. The sequence was used on cuprizone fed (n=7) and control mice (n=4). The cuprizone mice exhibit significant decrease of F by 25% in the Corpus Callosum (WM), and no change in GM. This study provides a proof of usefulness of this method, for demonstrating quantification of brain white matter demyelination.
Introduction
Myelin deficiencies lay at the core of numerous neurodegenerative disorders, one of the most prevalent being multiple sclerosis (MS). In vivo imaging of the myelin in MS could provide a tracking tool for demyelination and facilitating the development of new therapeutic agents that may promote remyelination1.
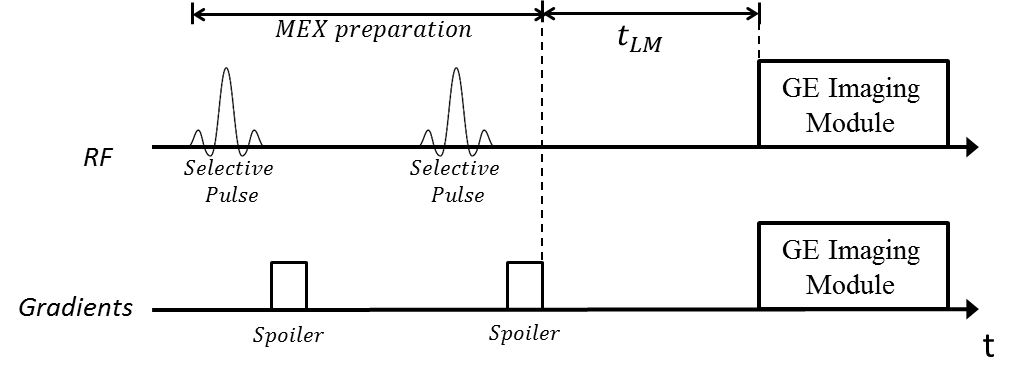
In this work we propose to use a recently reported MRI sequence, MEX, that measures a signal linearly dependent on the myelin protons fraction in the tissue2. The sequence uses a simple analysis procedure that can be applied in a clinical setup. It includes selective suppression of the water magnetization, by RF pulses and spoiling gradients, followed by a variable period (tLM) in which magnetization recovery occurs. The observed signal is dominated by two processes: magnetization transfer between protons associated with lipid-protein molecules (myelin) and protons in the aqueous surrounding; and spin-lattice relaxation (T1). The analysis of the image intensity dependence on tLM, yields the percentile fraction of the myelin in the tissue (F), the exchange time (τexc) and T1.
Methods
Cuprizone Model
Cuprizone mouse model is frequently used to resemble demyelination that occurs in MS3. Seven 6-weeks old mice were fed with 0.3% cuprizone and four mice were fed with standard food. Animals were imaged in-vivo after 6 weeks. Following the scans the animals were sacrificed for histological analysis, after transcardial perfusion.
MRI Protocol
Animals were scanned using the proposed MEX sequence (Fig.1), on a 7T Bruker BioSpec scanner (Bruker Biospin, Germany), using a 4-channel head coil. The preparation MEX block was calibrated to ensure maximal water saturation at tLM=10 μs, using hermite pulses adjusted to 3.3-3.7 watt. Following the recovery period, a standard gradient-echo imaging module was implemented. Ten different values of tLM delays ranging 2.5-2500 ms were used. Two 0.8 mm axial slices were acquired with TE/TR=3.5/3000 ms, FOV=15x15/20x20 mm2 (cuprizone/control) and 128x128 matrix.
Data Analysis
The acquired images were normalized by the longest tLM scan, and fitted to Eq.1 using non-linear least squares in MATLAB (MathWorks, MA).
$$ \frac{S(t_{LM})}{S(t_{LM}=2500)} =\frac{F(1-exp(\frac{t_{LM}}{\tau_{exc}}))+(1-F)(1-exp(\frac{t_{LM}}{T_1}))}{F(1-exp(\frac{2500}{\tau_{exc}}))+(1-F)(1-exp(\frac{2500}{T_1}))}\hspace{4em}(1)$$
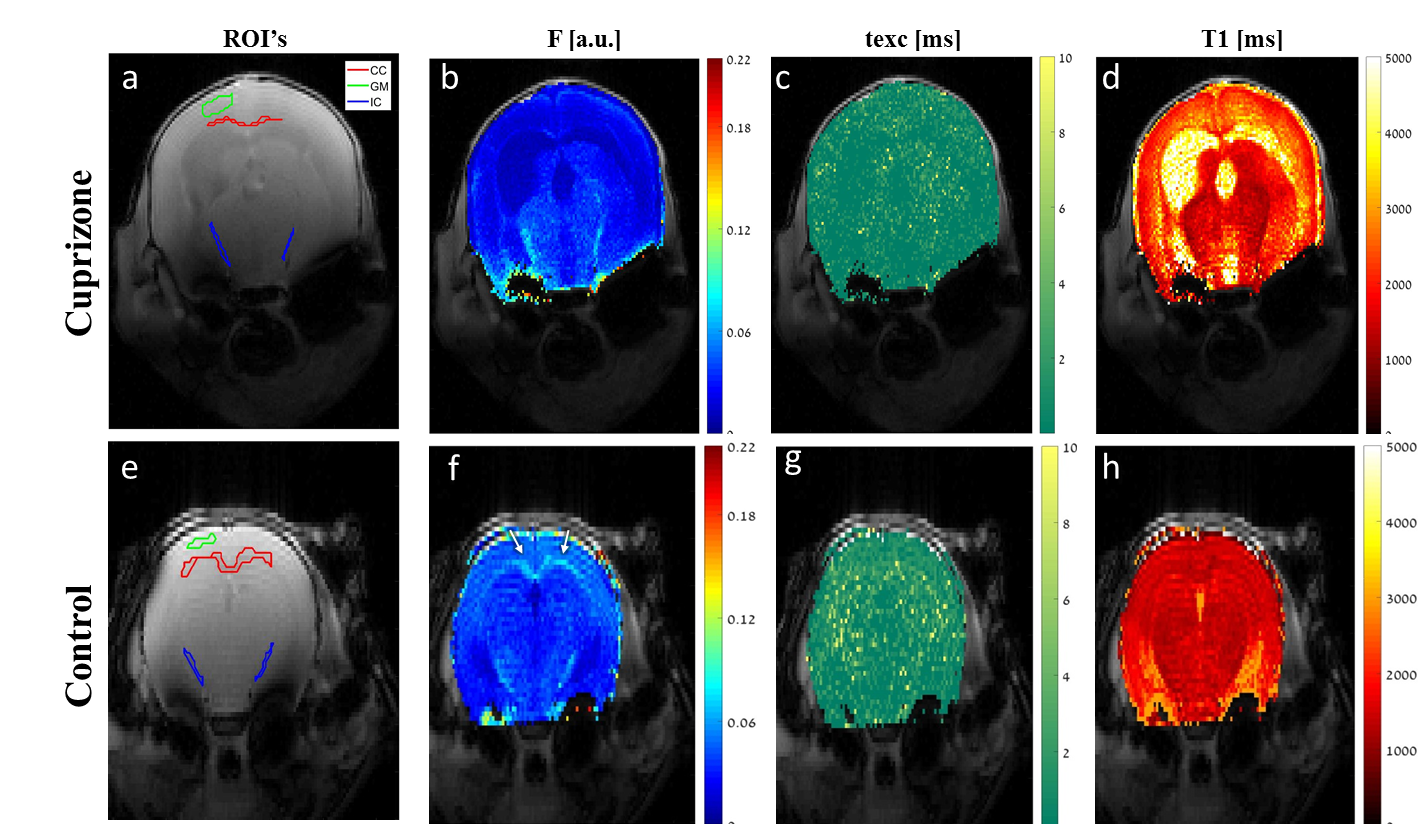
The values of F, τexc and T1 were extracted only for voxels exhibiting a good fit (R2>0.98). The following regions of interest (ROI's) were segmented based on a reference image (FLASH): white matter in the Corpus Callosum (CC) and Internal Capsule (IC) and gray matter in the cortex (GM), (as exemplified in fig.2a,e). Additionally, the signals of the pixels within the ROI's were summed and fitted to Eq.1, obtaining a better fit (R2>0.999).
Results
Fig.2 shows examples of two animals, cuprizone fed and control (top and bottom, respectively). It is clearly seen that the area of the CC in the cuprizone mouse has lower values of F than the control animal (white arrows in fig.2f), meaning a lower relative percentage of the myelin in this region. Also visible is an increase in T1 values for the cuprizone fed animals, as to be expected in a less myelinated tissue.
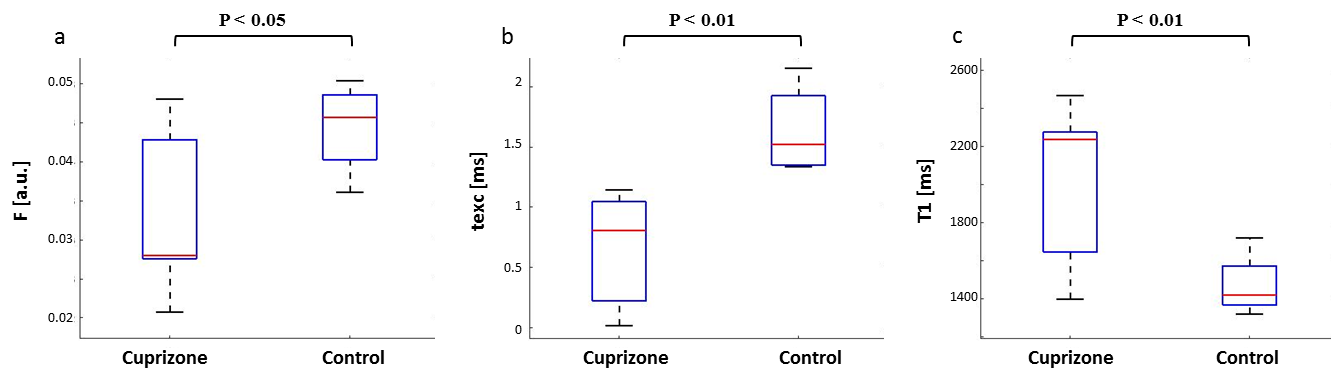
The maps obtained for all three fitted parameters show significant differences in the CC between the cuprizone fed mice and the control groups see fig.3. F is reduced by 25% (P<0.05), τexc is lower by 59% (P<0.01) and T1 is higher by 37% (P<0.01). The expected effect of the cuprizone model on myelin in the CC support these results of the F values4. In the IC and GM (marked in fig.2a,e) we cannot detect any significant decrease in the F values (results not shown), supporting the influence of cuprizone administration mainly in the CC3,5.
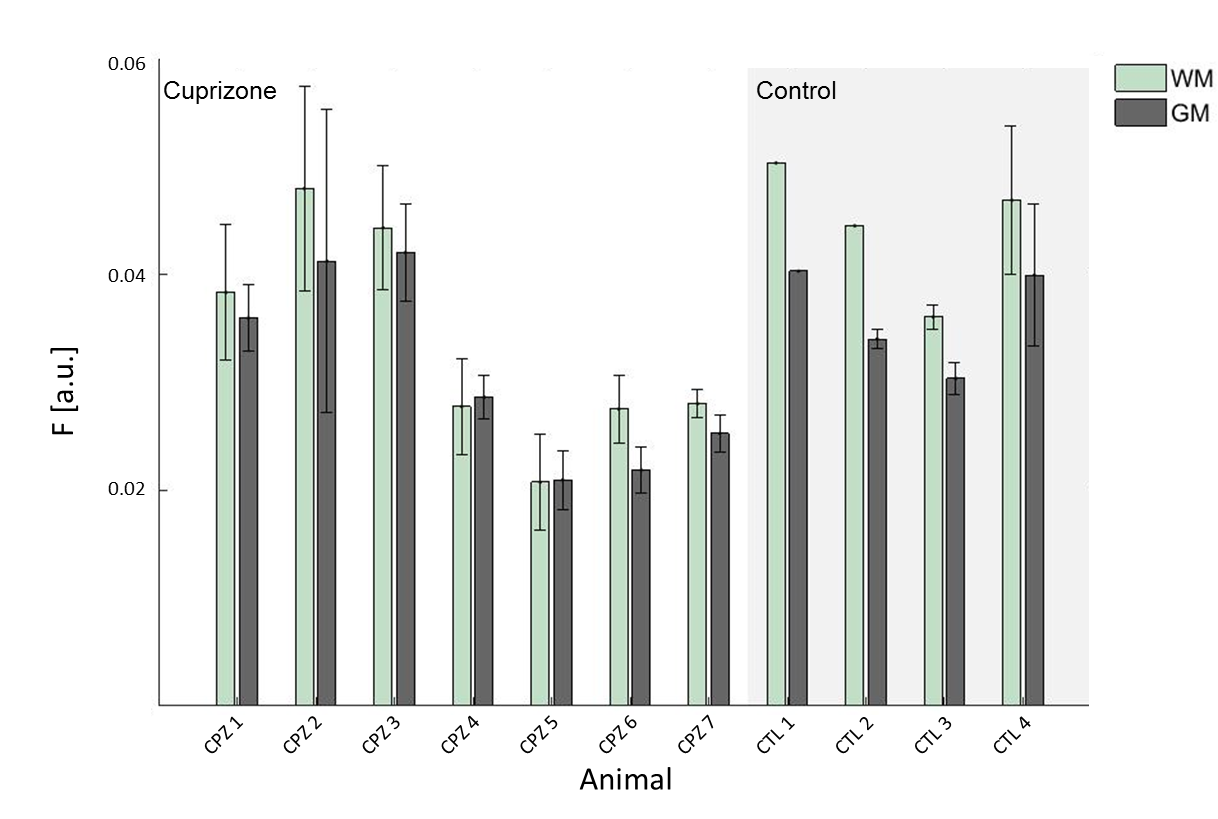
Fig.4. demonstrates the F values extracted out of the CC and GM for each animal. It is evident that ratio between the values of F in WM and GM, are smaller in the cuprizone group than in the control group, 1.09% and 1.25% on average, respectively.
Discussion
MEX sequence enables the quantification of myelin percentage. The values of F show decrease of myelin content in the CC in cuprizone fed mice, and no changes in the derived parameters in other white matter regions of the brain (IC) or in the gray matter. The contrast between the WM in the Corpus Callosum and the GM, as depicted by the F maps, practically disappears after treatment with cuprizone. As to be expected the results are not completely uniform for all cuprizone animals, whereas the control group shows consistent values, validating the strength of this sequence.Conclusions
An MRI sequence, based on magnetization exchange is proposed. The results provide quantitative measure of demyelination in brain white matter, as demonstrated by the cuprizone model.Acknowledgements
This work was funded by the United States - Israel Binational Science Foundation (BSF) to G.N. and the Israel Science Foundation (ISF) to U.N.
All experiments were performed in the Alfredo Federico Strauss center for computational neuro-imaging, Tel Aviv University.
References
1. Stikov N, Campbell JSW, Stroh T, et al. In vivo histology of the myelin g-ratio with magnetic resonance imaging. Neuroimage. 2015;118:397-405.
2. Eliav U, Navon G. The role of magnetization transfer in the observed contrast in T1 weighted imaging under clinical setups. NMR Biomed. 2017;30(12).
3. Torkildsen Ø, Brunborg LA, Myhr K-M, Bø L. The cuprizone model for demyelination. Acta Neurol Scand. 2008;117(s188):72-76.
4. Hibbits N, Yoshino J, Le TQ, Armstrong RC. Astrogliosis during acute and chronic cuprizone demyelination and implications for remyelination. ASN Neuro. 2012;4(6).
5. Matsushima GK, Morell P. The neurotoxicant, cuprizone, as a model to study demyelination and remyelination in the central nervous system. Brain Pathol. 2006;11(1):107-116.
Figures