1112
Longitudinal multimodal MRI monitoring of a novel combination therapy using radiosurgery and checkpoint inhibitor immunotherapy in glioblastoma multiforme1Radiology, Stony Brook University, Stony brook, NY, United States, 2Radiation Oncology, Stony Brook University, Stony brook, NY, United States
Synopsis
Multimodal MRI was used to longitudinally monitor the effects of a novel combination therapy of radiosurgery and programmed death-ligand 1 (PD-1) checkpoint inhibitor in a mouse model of GBM. We found that combination therapy of radiosurgery and immune checkpoint inhibition was more effective in reducing tumor volume and yielded better survival compared to non-treated, radiation-alone or immunotherapy-alone group. At 30-day post-treatment onset, tumor-ROI T2, apparent-diffusion coefficient, fractional anisotropy, and kurtosis of the combination treatment group were significantly different from those of the non-treated group (p<0.05). Immunohistochemical results further shed light on possible mechanisms of action.
Introduction
Glioblastoma multiforme (GBM) carries a grave prognosis despite aggressive treatment. Local tumor infiltration is the likely culprit of inevitable tumor progression. A recent experimental study reported that the novel combination of immunotherapy and high-dose radiation induces abscopal tumor response that was more effective than either immunotherapy or radiation alone in minimizing tumor infiltration, thereby reduces tumor growth and improves survival 1.
The goal of this study was to use multimodal MRI to longitudinally monitor the effects of this novel combination treatment of radiosurgery and programmed death-ligand 1 (PD-1) checkpoint inhibitor in a mouse model of GBM. We tested the hypothesis that the combination treatment yields smaller tumor growth and longer survival than no-treatment, radiation or immunotherapy treatment alone.
Materials and Methods
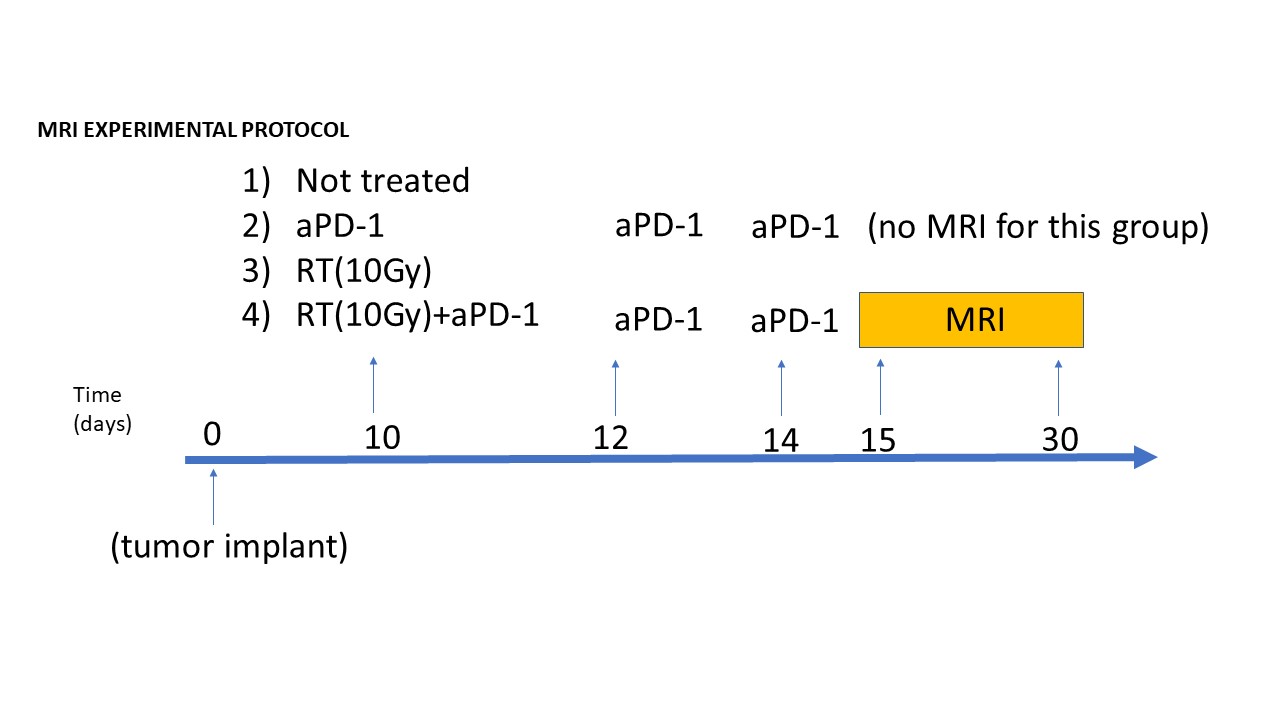
Adult male C57BL/6 mice were transplanted with murine 30,000 glioma cells (GL261) in the frontal lobe (-1mm anteroposterior and +2mm mediolateral from Bregma). There were 4 groups (n=7 mice per group) (Figure 1): i) non-treated (tumor-bearing control), ii) aPD-1 checkpoint inhibitor treatment alone (3 doses of anti-mouse PD-1; 10mg/kg i.p. at days 10, 12 and 14 after tumor implantation), iii) radiation treatment (RT) alone (10Gy given at 10 days after tumor implantation), and iv) combined RT+aPD-1 treatment. No MRI was performed for group ii.
MRI was acquired on a 7T Bruker scanner 15, 30 and 45 days after tumor implantation. T1 and T2 anatomical MRI, diffusion-weighted MRI, and diffusion and T2 kurtosis were acquired 2-4. Tumor volume, T2, apparent diffusion coefficient (ADC), ADC kurtosis and T2 kurtosis were calculated. Survival curves were tabulated. Immunohistochemical analysis was performed at the time of death or at the end of the study (60 days). Statistical comparisons between groups were made using the log-rank Mantel Cox test and t-test.
Results and Discussion
Survival outcomes were significantly better in the combination-treatment group compared to non-treated, immunotherapy alone or radiation alone (Figure 2A). Median survival was >60days for combination treatment, compared to 25 days for non-treated mice, 30 days with aPD-1 blocker monotherapy, and 36 days with 10Gy radiation alone (p<0.001). The combination-treatment group showed complete pathological response in 75% of the mice, with median survival not reached over the study duration of 60 days. H&E histology verified gross pathology of the tumor (Figure 2B). In this particular radiation+aPD-1 mouse, tumor present at 15 days based on MRI was essentially eradicated at the endpoint.
Figure 3A shows presentative T2-weighted MRI for each group at two time points. Tumor (left hemisphere) showed heterogeneous contrast. At 15 days, tumor sizes were similar across groups. At 30 days, tumor sizes were the smallest for the combination-treatment group compared to the other groups. Tumor volumes of the combination treatment was significantly smaller than that of RT alone (*p<0.05) and non-treated controls (#p<0.05) (Figure 3B).
Figure 4 shows tumor-ROI MRI quantitative parameters compared to normal contralateral homologous regions. At 30 days, T2, ADC, FA and FA kurtosis of the combination treatment group were significantly different from those of the non-treated group (p<0.05). At 30 days, ADC of the radiation group was also significantly different from those of the non-treated group (p<0.05). Overall, T2, FA and FA kurtosis of the combination treatment group was closer to normal tissue values, compared to non-treated group. However, it is unclear why ADC was further away from normal values compared to non-treated group.
There was increased infiltration of CD8+ T-lymphocytes within the tumor after aPD-1 inhibitor treatment (Figure 5AB). These CD8+ cells were completely abolished by RT on day 15. However, the CD8+ cells were significantly restored after RT+aPD-1 treatment, reflecting superior tumor control by the combination treatment. Furthermore, the CD8+ stained cells on day 15 showed morphological features of phagocytosis engulfing the GBM tumor cells (Figure 5C). These findings suggest that radiosurgery acts via in-situ immune modulation in the infiltrating GBM, possibly abolishing the initial ‘ineffective’ lymphocytes and promoting the infiltration of ‘trained’ CD8+ cells, effective against the GBM.
Conclusion
We found that combined radiation and immune-checkpoint inhibitor was more effective in reducing tumor burden and yielded better survival compared to non-treated, radiation alone or immunotherapy alone in a mouse model of GBM. Immunohistochemical results shed light on possible mechanisms of action. To our knowledge this is the first MRI investigation of abscopal tumor response using novel combination of radiosurgery and immunotherapy. Furthermore, our recent clinical trial showed that fractionated radiation is more effective in improving progression-free survival in GBM patients compared to a single high-dose radiation 5. Experiments are being performed to evaluate the efficacy of fractionated radiosurgery in combination with immunotherapy.Acknowledgements
No acknowledgement found.References
1. Demaria S, Kawashima N, Yang AM, Devitt ML, Babb JS, Allison JP, et al. Immune-mediated inhibition of metastases after treatment with local radiation and ctla-4 blockade in a mouse model of breast cancer. Clin Cancer Res. 2005;11:728-734
2. Huang L, Liu Y, Lu J, Cerqueira B, Misra V, Duong TQ. Intraarterial transplantation of human umbilical cord blood mononuclear cells in hyperacute stroke improves vascular function. Stem Cell Res Ther. 2017;8:74
3. Huang L, Lu J, Cerqueira B, Liu Y, Jiang Z, Duong TQ. Chronic oral methylene blue treatment in a rat model of focal cerebral ischemia/reperfusion. Brain Res. 2018;1678:322-329
4. Zhou W, Muir ER, Nagi KS, Chalfin S, Rodriguez P, Duong TQ. Retinotopic fmri reveals visual dysfunction and functional reorganization in the visual cortex of mild to moderate glaucoma patients. J Glaucoma. 2017;26:430-437
5. Kim EY, Yechieli R, Kim JK, Mikkelsen T, Kalkanis SN, Rock J, et al. Patterns of failure after radiosurgery to two different target volumes of enhancing lesions with and without flair abnormalities in recurrent glioblastoma multiforme. J Neurooncol. 2014;116:291-297
Figures