1111
Objective lung-density quantification in neonatal bronchopulmonary dysplasia via ultrashort echo-time MRI, with comparison to clinical severity and reader scoring1Center for Pulmonary Imaging Research, Cincinnati Children's Hospital, Cincinnati, OH, United States, 2Pulmonary Medicine, Cincinnati Children's Hospital, Cincinnati, OH, United States, 3BPD Center, Cincinnati Children's Hospital, Cincinnati, OH, United States, 4Radiology, Cincinnati Children's Hospital, Cincinnati, OH, United States, 5Pediatrics, University of Cincinnati, Cincinnati, OH, United States, 6Medical Physics, University of Wisconsin - Madison, Madison, WI, United States, 7Radiology, University of Wisconsin - Madison, Madison, WI, United States, 8Neonatology and Pulmonary Biology, Cincinnati Children's Hospital, Cincinnati, OH, United States
Synopsis
Neonatal lung disease of prematurity (bronchopulmonary dysplasia, BPD) is a serious pulmonary condition. However, there is little understanding of the underlying structural pathologies or relationship to disease trajectories. Pulmonary MRI of neonatal BPD is an emerging research technique, with preliminary correlation to clinical outcomes, but assessment of parenchyma has been limited to manual radiological reads. We present quantitative lung-density measures in 55 patients from ultrashort echo-time (UTE) MRI, with strong correlation to clinical BPD severity and a current BPD reader scoring system. This technique distinguishes between patients with varying lung-density phenotypes, which in the future may help inform treatment strategies.
Introduction
Bronchopulmonary dysplasia (BPD) is a common and serious pulmonary condition associated with premature birth, but the underlying structural pathologies are poorly understood.1 BPD severity diagnosis is imprecisely graded by clinically-assessed need for supplementary respiratory support,2 which can vary by institution, and there exist few clinical prognostic indicators of respiratory outcomes.1 Clinical pulmonary imaging of patients with BPD is typically limited to chest x-ray radiograph, with no tomographic or quantitative information, or x-ray computed tomography, which is more rare in neonates due to concerns over ionizing radiation exposure.
Pulmonary MRI offers a safe, tomographic imaging alternative in this vulnerable population. Indeed, lung disease in neonatal BPD has recently been described by reader-based scoring of pulmonary MRI to identify and classify parenchymal features and predict short-term outcomes.3,4 However, ultrashort echo-time (UTE) MRI can be acquired in the proton-density regime and can objectively quantify parenchymal abnormalities.5 We quantitatively assess lung-density distributions of neonatal BPD using UTE MRI and compare with clinical severity and reader-based scoring.
Methods
Pulmonary 3D radial 1H UTE MR images6,7,8 were acquired during restful breathing in 55 neonates with and without BPD2 (31 severe, 9 moderate, 7 mild, 8 non-BPD controls; mean post-menstrual-age at MRI = 40±3 weeks) using a quadrature body coil on a small-footprint, neonatal-sized, NICU-sited 1.5T scanner,9,10 with no sedation ordered for MRI. Typical UTE parameters were: repetition-time (TR) = 5 ms, echo-time (TE) = 0.2 ms; flip-angle (FA) = 5º; field-of-view (FOV) = 18 cm; radial projection number = 200,000; 3D isotropic resolution ≈ 0.70 mm; and scan-time ≈ 16 min.
Whole-lung segmentations were generated from ungated UTE reconstructions and normalized to chest-muscle intensity; as previously described,5 volumetric-density in lung tissue can be approximated by normalizing lung intensity with muscle intensity (muscle ~1 g/cm3), due to the similar T1-weightings of lung and muscle tissue at the implemented FA and TR values. After scaling to a noise-floor minimum, lung-density distributions were generated for each patient. The percent of total lung volume (TLV) in six density bins (Bin1-Bin6) was calculated, with bin ranges divided into equal 0.2-g/cm3 increments from 0 to 1.2 g/cm3. Hyperinflation (TLV to body-surface-area [BSA] ratio) was also calculated.
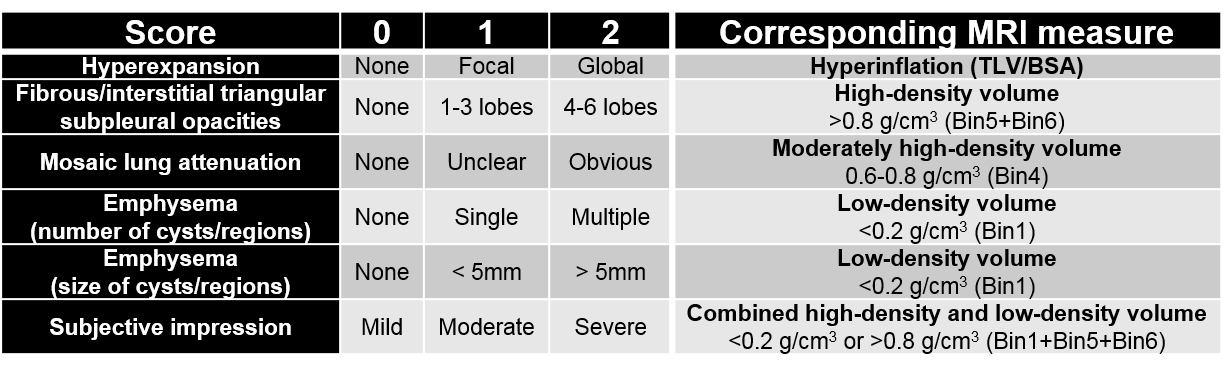
Parenchymal abnormalities on UTE MRI were scored by two radiologists using relevant categories of the modified Ochiai scoring system for BPD imaging4,11 (Table 1). Mean scores were compared to corresponding quantitative MRI measures (Table 1).
Results
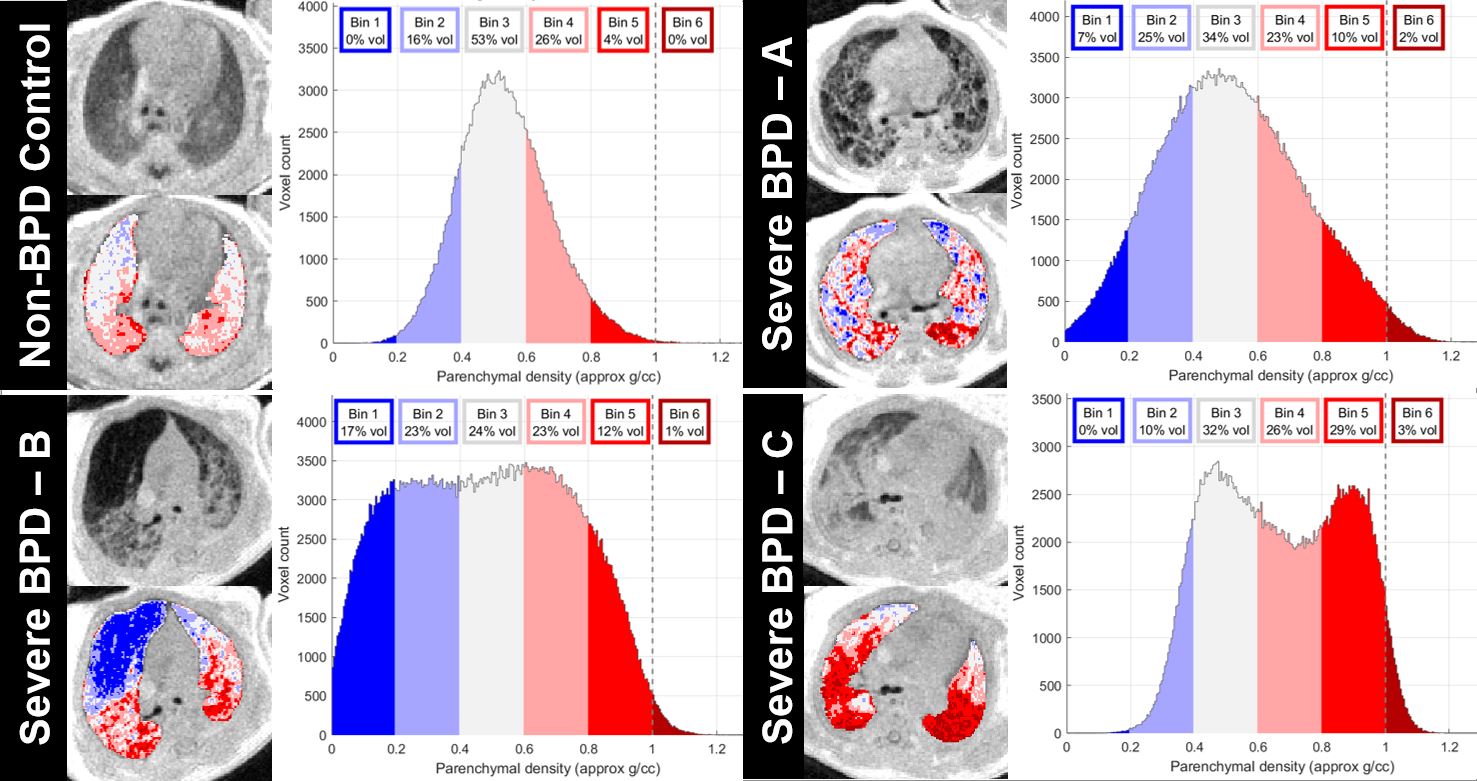
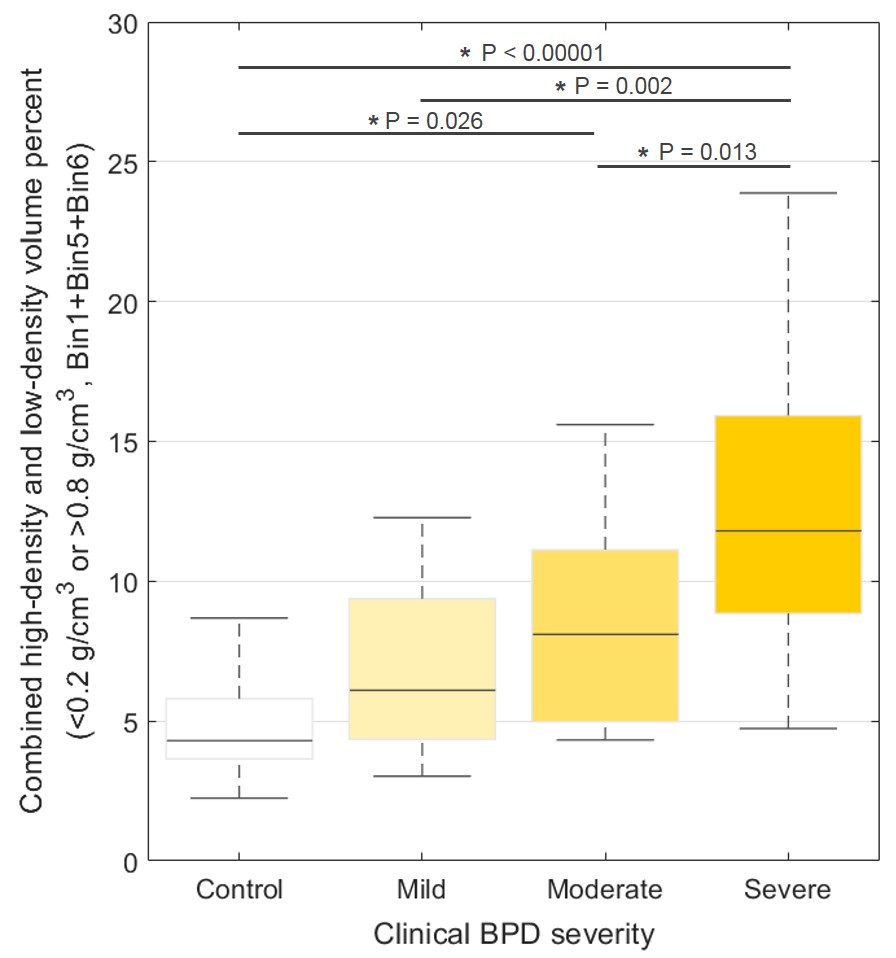
Individual density distributions varied widely among BPD patients, compared to Gaussian distributions in control patients centered at 0.51±0.15 g/cm3 (expected for normal neonatal lung tissue5,12). Prominent low-density and/or high-density regions were obvious in the density-distributions of severe patients (Figure 1). Combined high-density and low-density volume (<0.2 g/cm3 or >0.8 g/cm3, Bin1+Bin5+Bin6) significantly differentiated patients with severe BPD from patients with non-BPD, mild BPD, and moderate BPD (Figure 2).
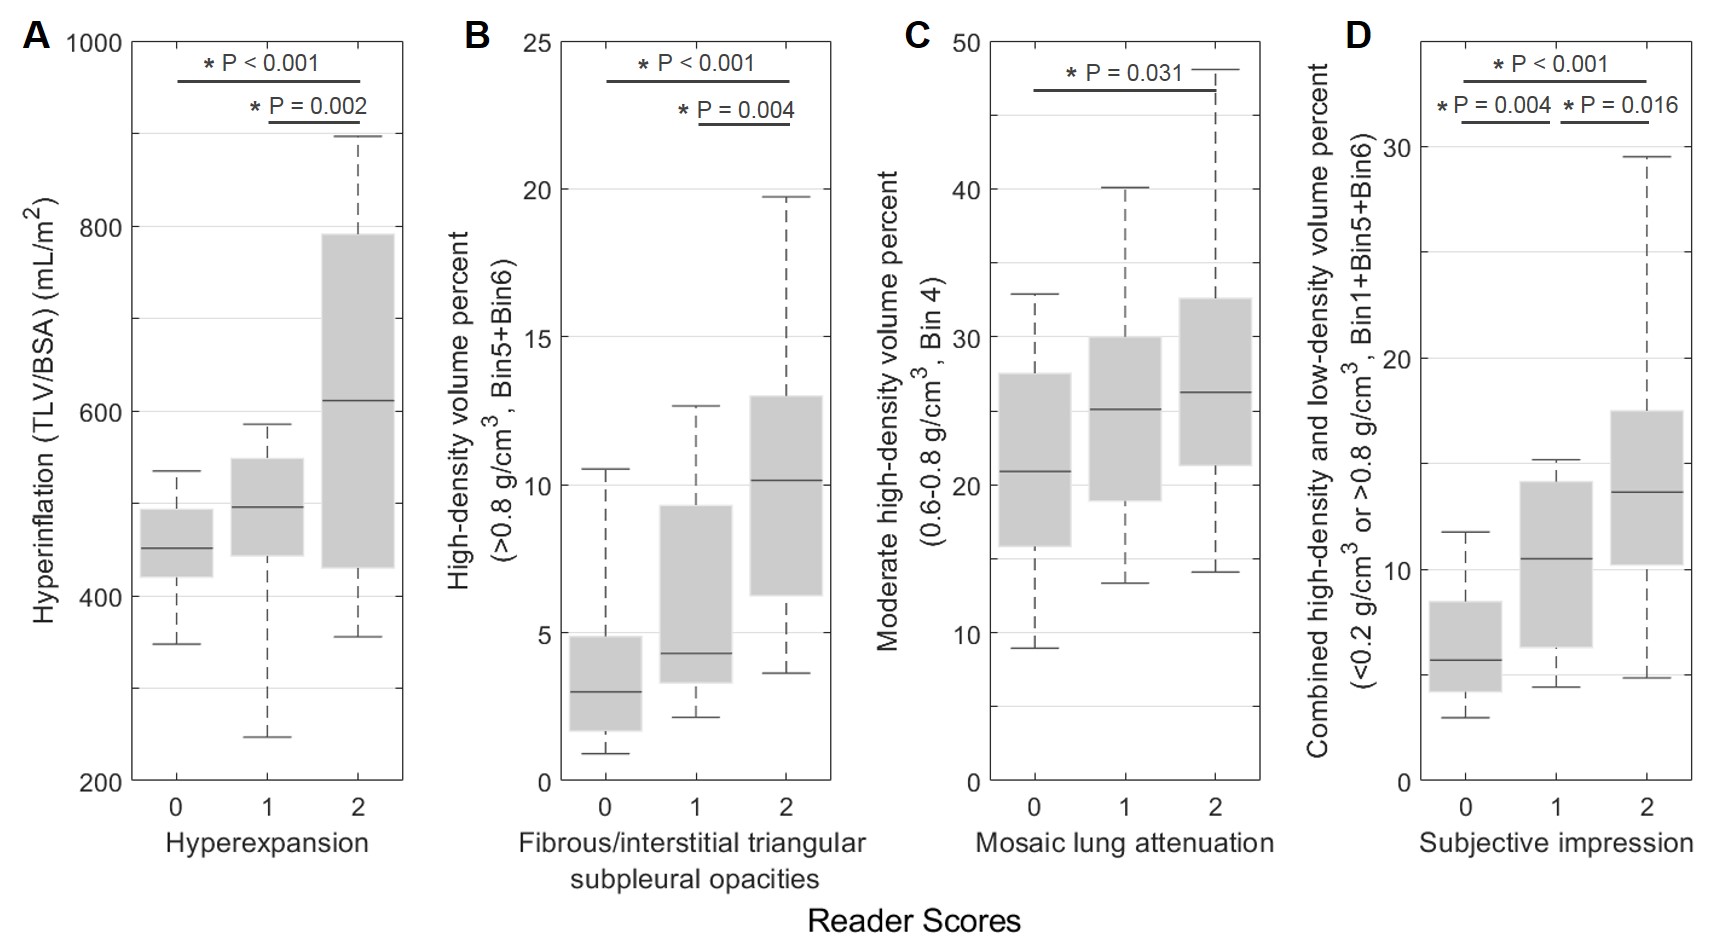
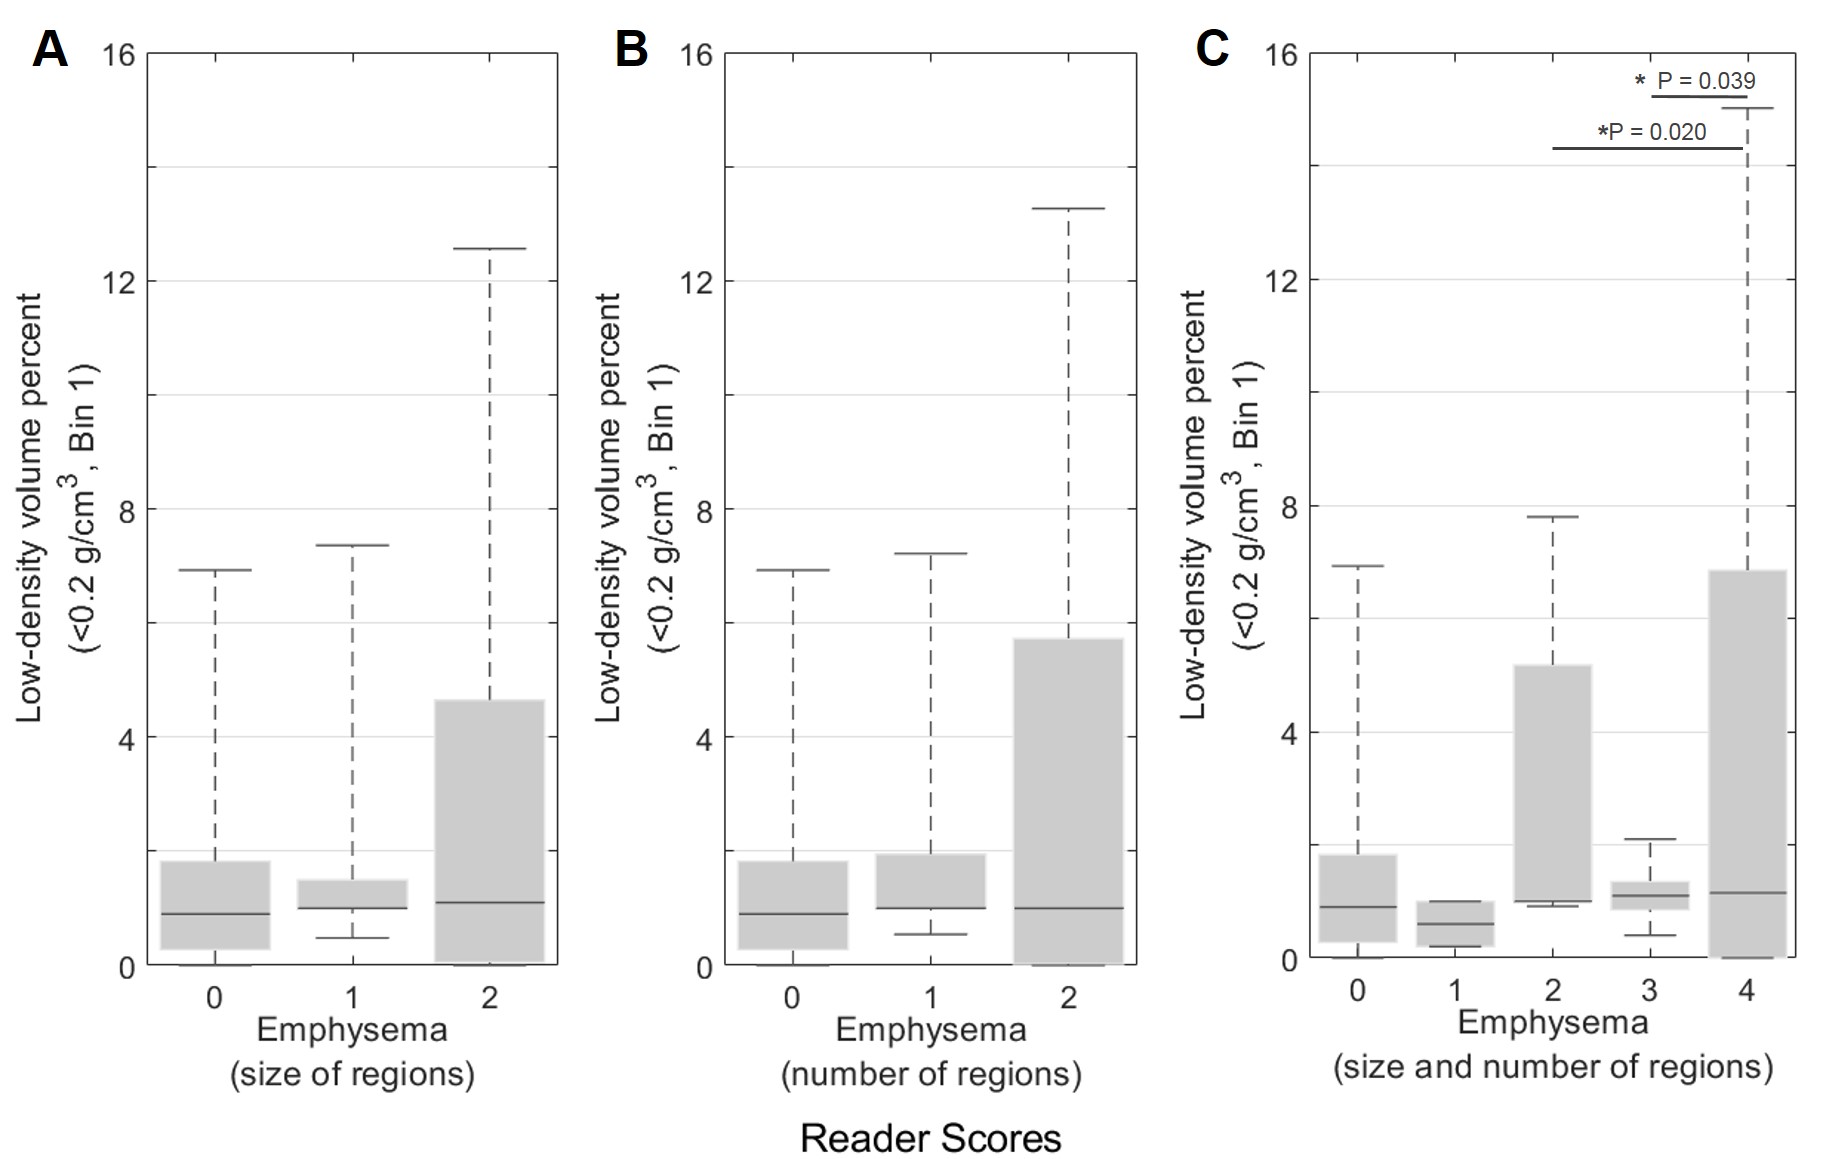
Figure 3 demonstrates strong associations between corresponding density-bins and reader score categories (P-values given in figure). Hyperinflation separated hyperexpansion scores of 0-2 and 1-2. High-density volume (>0.8 g/cm3, Bin5+Bin6) separated fibrous/interstitial opacities scores of 0-2 and 1-2. Moderately high-density volume (0.6-0.8 g/cm3, Bin4) separated mosaic lung attenuation scores of 0-2. Combined high-density and low-density volume (<0.2 g/cm3 or >0.8 g/cm3, Bin1+Bin5+Bin6) separated subjective impression scores of 0-1, 1-2, and 0-2. Figure 4 demonstrates poor associations between low-density volume (<0.2 g/cm3, Bin1) and emphysema scores (P-values given in figure).
Discussion and Conclusions
Trends in lung-density quantification and reader scores were generally in good agreement, with the exception of the comparison between low-density volume and emphysema scores. This may be due to low visual contrast between low-density and normal-density tissue, and to poor classifications of the Ochiai system’s emphysema grading; even subtle emphysematous lung pathologies (for example, two regions that barely exceed >5 mm in size) would yield a maximum emphysema score of 4/4, despite accounting for little of the overall lung volume. Particularly for evaluating emphysema, density quantification is likely a stronger metric than the current scoring system.
The current work is limited by not considering region or orientation of lung-density pathologies. Until rigorous textural analysis algorithms become more automated, manual assessment of spatial patterning may remain an important, complementary contribution from radiological reads.
Pulmonary UTE MRI can objectively quantify parenchymal density abnormalities in neonates with BPD without requiring ionizing radiation or anesthesia/sedation. Lung-density quantification compares well to reader scoring, and importantly can distinguish patients with different clinical severities and lung-density phenotypes. In the future, serial quantitative MRI assessments have the potential to evaluate efficacy of individualized treatments, yielding personalized clinical care in preterm infants who are at increased risk for severe respiratory disease trajectories.
Acknowledgements
The authors thank Cincinnati Children’s Hospital Research Foundation, The Perinatal Institute at Cincinnati Children’s Hospital, The Departments of Radiology and Medical Physics and the School of Medicine and Public Health at University of Wisconsin-Madison, and NIH T32 HL007752 for research funding and support.References
1. Stoll BJ, Hansen NI, Bell EF, Shankaran S, Laptook AR, Walsh MC, Hale EC, Newman NS, Schibler K, Carlo WA, Kennedy KA, Poindexter BB, Finer NN, Ehrenkranz RA, Duara S, Sánchez PJ, O'Shea TM, Goldberg RN, Van Meurs KP, Faix RG, Phelps DL, Frantz ID 3rd, Watterberg KL, Saha S, Das A, Higgins RD; Eunice Kennedy Shriver National Institute of Child Health and Human Development Neonatal Research Network. Neonatal outcomes of extremely preterm infants from the NICHD Neonatal Research Network. Pediatrics 2010 Sept;126(3):443–56.
2. Jobe AH, Bancalari E. Bronchopulmonary dysplasia. Am J Respir Crit Care Med 2001 Jun;163(7):1723-9.
3. Higano NS, Spielberg DR, Fleck RJ, Schapiro AH, Walkup LL, Hahn AD, Tkach JA, Kingma PS, Merhar SL, Fain SB, Woods JC. Neonatal Pulmonary MRI of Bronchopulmonary Dysplasia Predicts Short-term Clinical Outcomes. Am J Respir Crit Care Med. 2018 May 23. doi: 10.1164/rccm.201711-2287OC. [Epub ahead of print]
4. Walkup LL, Tkach JA, Higano NS, Thomen RP, Fain SB, Merhar SL, Fleck RJ, Amin RS, Woods JC. Quantitative magnetic resonance imaging of bronchopulmonary dysplasia in the neonatal intensive care unit environment. Am J Resp Crit Care Med 2015 Nov 15;192(10):1215–22.
5. Higano NS, Fleck RJ, Spielberg DR, Walkup LL, Hahn AD, Thomen RP, Merhar SL, Kingma PS, Tkach JA, Fain SB, Woods JC. Quantification of neonatal lung parenchymal density via ultrashort echo time MRI with comparison to CT. J Magn Reson Imaging 2017 Oct;46(4):992-1000.
6. Hahn AD, Higano NS, Walkup LL, Thomen RP, Cao X, Merhar SL, Tkach JA, Woods JC, Fain SB. Pulmonary MRI of neonates in the intensive care unit using 3D ultrashort echo time and a small footprint MRI system. J Magn Reson Imaging. 2017;45(2):463-71.
7. Johnson KM, Fain SB, Schiebler ML, Nagle S. Optimized 3D ultrashort echo time pulmonary MRI. Magn Reson Med 2013 Nov;70(5):1241-50.
8. Higano NS, Hahn AD, Tkach JA, Cao X, Walkup LL, Thomen RP, Merhar SL, Kingma PS, Fain SB, Woods JC. Retrospective respiratory self-gating and removal of bulk motion in pulmonary UTE MRI of neonates and adults. Magn Reson Med 2017;77(3):1284-95.
9. Tkach JA, Hillman NH, Jobe AH, Loew W, Pratt RG, Daniels BR, Kallapur SG, Kline-Fath BM, Merhar SL, Giaquinto RO, Winter PM, Li Y, Ikegami M, Whitsett JA, Dumoulin CL. An MRI system for imaging neonates in the NICU: initial feasibility study. Pediatr Radiol 2012;42(11):1347-56.
10. Tkach JA, Merhar SL, Kline-Fath BM, Pratt RG, Loew WM, Daniels BR, Giaquinto RO, Rattan MS, Jones BV, Taylor MD, Tiefermann JM, Tully LM, Murphy EC, Wolf-Severs RN, LaRuffa AA, Dumoulin CL. MRI in the neonatal ICU: initial experience using a small-footprint 1.5-T system. AJR Am J Roentgenol 2014;202(1):W95-W105.
11. Ochiai M, Hikino S, Yabuuchi H, Nakayama H, Sato K, Ohga S, Hara T. A new scoring system for computed tomography of the chest for assessing the clinical status of bronchopulmonary dysplasia. J Pediatr 2008 Jan;152(1):90-5, 95.e1-3.
12. Stein J, Walkup LL, Brody AS, Fleck RA, Woods JC. Quantitative CT characterization of pediatric lung development using routine clinical imaging. Pediatr Radiol 2016 Dec;46(13):1804-1812.
Figures