1105
Independent Component Analysis of Complex Magnetic Resonance Fingerprinting Data1Radiology, Case Western Reserve University, Cleveland, OH, United States
Synopsis
Magnetic Resonance Fingerprinting (MRF) sequences have variable flip angles and TRs that generate unique signal evolutions based on selected tissue properties. To obtain quantitative maps with accurate values in the dictionary matching step it is important to minimize various noise sources or simulate them into the dictionary. We propose to explore systematic artifacts or features that are not in the dictionary with independent component analysis of complex MRF time series. In vivo brain results with 3D MRF revealed global sequence related features (bias from B0 and B1 associated with phase of MRF data) and subject specific reconstruction artifacts.
Introduction
Multiple tissue properties and system parameters can be mapped with Magnetic Resonance Fingerprinting1 (MRF). MRF data are collected with changing flip angles and TRs for a given set of time points to make signals from different tissues as unique as possible. Prior to dictionary matching, MRF data consists of noisy time series affected by underlying tissue properties (simulated in the dictionary), aliasing artifacts due to undersampling of k-space, subject specific noise (motion, respiration, etc.) and system imperfections. As long as different noise sources are incoherent in space and time, they are expected to not affect the dictionary matching step where unique signal evolutions would be mapped to their true counterparts in the dictionary. However, it is well known that there are potential sources of error that are not taken into account in either prescan calibrations or in the dictionary simulation. To test the extent of global scale imperfections we propose to run complex independent component analysis (ICA) on MRF time course data. ICA on MRF magnitude data2 was introduced for dictionary-free segmentation of tissues. Here, the focus is on exploring artifacts that are present in the magnitude and/or phase of MRF data.Methods
3D FISP MRF3,4 brain data were acquired from 5 volunteers (with IRB approval and prior written consent) with the following acquisition parameters: 300x300x144 mm3 FOV; 1.2x1.2x3 mm3 image resolution for two volunteers and isotropic 1.2 mm resolution for three volunteers. MRF data were reconstructed with kt-SVD low rank reconstruction5 for aliased-free images. B0 and B1 field map scans were also acquired for comparison. Complex ICA was ran separately for each volunteer with fastica toolbox (http://research.ics.aalto.fi/ica/fastica/) after adjusting complex MRF data into an expanded matrix formalism6 which enables the use of real-valued solvers. Specifically, if (A+iB) is assumed to be the complex MRF time series matrix with size n x m (time x voxels), it is rewritten by separating and then concatenating the real and imaginary parts into a real 2n x 2m size [A -B;B A] matrix. Complex ICA with k components outputs times series (size 2n x k) and spatial maps (size k x 2m) for which real and imaginary parts are concatenated in the first and second dimension, respectively. An initial step of Principal Component Analysis (PCA) was applied prior to ICA to determine the dimensionality.Results
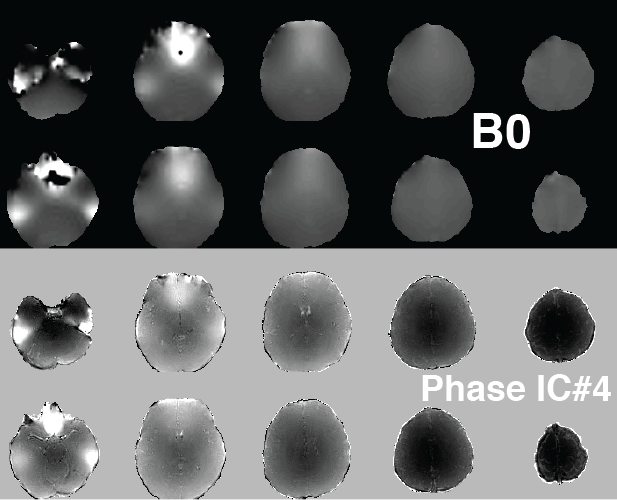
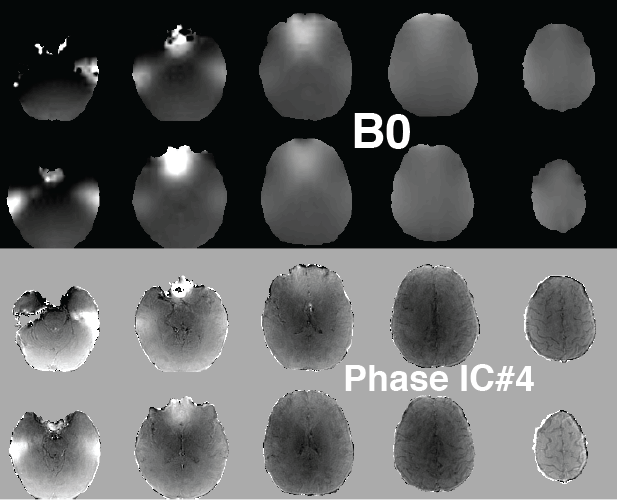
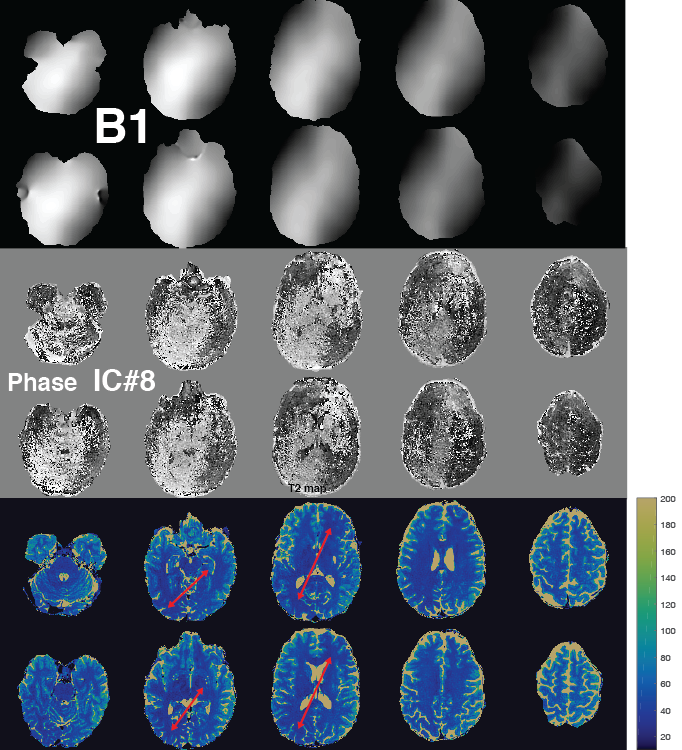
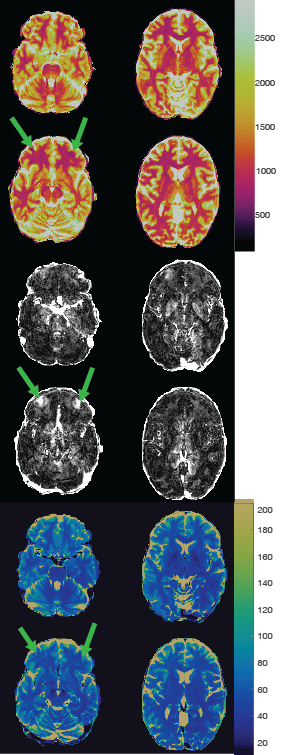
Different types of artifacts or features from ICA of complex MRF time course data are illustrated in Figures 1-4. Figure 1 and 2 show the phase of two components from two subjects’ ICAs and the spatial similarity to the corresponding field maps. Even though this is a FISP based scan and thus expected to be insensitive to field inhomogeneity, residual off-resonance effects are detected with ICA. In Figure 3, phase of IC #8 of another subject has a spatial profile that matches the RF field map. Also, looking closely one can see that the T2 relaxation times are slightly underestimated for this subject in certain regions. Figure 4 is an example of signal leakage through multiple slices picked up by the magnitude map of an IC. Corresponding T1 and T2 maps display localized artifacts in the very same regions.Discussion
Some of the artifacts that are found by complex ICA are pulse sequence specific. For example, all subjects’ ICA included at least one off-resonance associated component suggesting that off-resonance may need to be taken into account in some circumstances. In other cases, there might be other types of consistent artifacts or biases that might need to be addressed. On the other hand, artifacts illustrated in Figure 3 and 4 can be categorized as subject specific and have more severe consequences for dictionary matching. The RF field inhomogeneity in Figure 3 is evident in one of the components and manifests itself as spatial inhomogeneity in T2 maps which might be mitigated with B1 correction7. Signal leakage in Figure 4 is localized to a very small region and is likely to go unnoticed without a dedicated artifact search.Conclusion
Complex ICA of MRF time course data can reveal systematic and unknown sources of bias or noise which might be sequence or subject specific. The proposed approach does not require a dictionary and can aid in finding and addressing artifacts from complex MRF data. It is hoped that knowledge of these effects could lead to new corrections and thus more accurate MRF data.Acknowledgements
The authors would like to acknowledge funding from Siemens Healthcare and NIH grants 1R01EB016728-01A1 and 5R01EB017219-02.References
1. Ma D, Gulani V, Seiberlich N, et al. Magnetic resonance fingerprinting. Nature 2013;495: 187–192.
2. Boyacioglu R, Ma D, et al. Dictionary free anatomical segmentation of Magnetic Resonance Fingerprinting brain data with Independent Component Analysis. ISMRM Proceedings 2018; p4254.
3. Ma D, Pierre E, McGivney D, et al. Applications of Low Rank Modeling to Fast 3D Magnetic Resonance Fingerprinting. ISMRM Proceedings 2017; p129.
4. Ma D, Jiang Y, Chen Y, et al. Fast 3D magnetic resonance fingerprinting for a whole-brain coverage. Magn Reson Med 2018, 79(4):2190-2197
5. Pierre E, Griswold M, Connelly A. Fast Analytical Solution for Extreme Unaliasing of MR Fingerprinting Image Series. ISMRM Proceedings 2017; p1353.
6. Day D, Heroux MA. Solving Complex-valued Linear Systems via Equivalent Real Formulations. Siam J Sci Comput, 2001, 23(2), pp. 480–498.
7. Ma D, Coppo S, et al. Slice profile and B1 corrections in 2D magnetic resonance fingerprinting. Magn Reson Med 2017, 78(5):1781-1789.
Figures