1103
Flow-Encoded Magnetic Resonance Fingerprinting: Simultaneous Measurement of Flow, T1, & T2 with Whole Brain Coverage1Translational Medicine, Hospital for Sick Children, Toronto, ON, Canada, 2Pediatrics, Hospital for Sick Children, Toronto, ON, Canada, 3Neuroscience and Mental Health, Hospital for Sick Children, Toronto, ON, Canada, 4Medical Biophysics, University of Toronto, Toronto, ON, Canada
Synopsis
Incorporating bipolar, flow sensitizing gradients into a magnetic resonance fingerprinting (MRF) pulse sequence permits quantification of vessel flow along with static tissue T1 and T2 relaxation times. This abstract demonstrates quantification of T1, T2 and multi-directional flow with a single, volumetric, flow-encoded MRF acquisition with whole brain coverage. Comparison of T1, T2, and flow measurements with inversion recovery, spin-echo, and phase contrast techniques revealed good agreement between flow-encoded MRF and gold-standard methods. The capacity to obtain volumetric relaxometry and flow measurements with a single acquisition can support efficient, comprehensive assessments of cerebral blood flow and tissue integrity.
Introduction
Magnetic Resonance Fingerprinting (MRF) techniques permit quantification of multiple MRI parameters (T1, T2, M0) with a single acquisition. Recently, Flassbeck et al demonstrated the capacity to measure flow within vessels, along with T1 and T2 in stationary tissue by incorporating bipolar, flow sensitizing gradients into an MRF pulse sequence [1,2]. They referred to their technique as Flow MRF.
Here we demonstrate measurement of T1, T2, and multi-directional flow with a single volumetric, flow-encoded MRF acquisition. Furthermore, instead of randomly varying the amplitude of the bipolar gradients and using a pre-defined dictionary for velocity estimation [1,2], flow encoding was performed with a simple four-point scheme, permitting direct, phase-difference velocity quantification.
Methods
Pulse Sequence: An interleaved, four-point flow encoding scheme was incorporated into an inversion-prepared, variable flip angle, 3D (slab-selective), stack-of-spirals FISP acquisition [3]. The TR/TE was held constant at 14/4.23 ms. For each partition encode (kz), 1000 time points were acquired. All time points were acquired for a single kz before proceeding to the next one (after a 5 second waiting period for magnetization recovery).
Within each TR, a variable density spiral trajectory, requiring 48 interleaves for full sampling, was used to acquire kx-ky data. Every TR, the trajectory angle was rotated by the golden angle (111.25°) and flow sensitization was cycled between a reference acquisition (with no bipolar gradient) and bipolar gradients along the x-, y-, and z-axes. Modulation patterns for the trajectory angle and flow encoding gradients are illustrated in Figure 1.
Reconstruction: 3D volumes were reconstructed in MATLAB using the GPU-NUFFT toolbox. Separate reconstructions were used for flow and relaxometry measurements (see Figure 1). The flow reconstruction generated 4 images (one for each flow encode condition – V0, Vx, Vy, Vz), by combining all data collected under each condition. Time-averaged flow was then calculated from the phase difference between Vx, Vy, Vz images and the V0 image.
As suggested in [5], to reduce undersampling artifacts and improve SNR, the relaxometry reconstruction used a sliding window strategy, combining data from consecutive sets of 15 repetitions to generate 986 image frames. T1 and T2 were then estimated by voxel-wise matching with a dictionary generated by Bloch equation simulations followed by sliding window summation.
MRI Acquisitions: Scanning was performed on a 3T MAGNETOM Prisma system (Siemens Healthcare, Erlangen, Germany). Flow-encoded MRF data were acquired in relaxometry and flow phantoms and in the brain of 2 adult volunteers. The maximum encoded velocity (venc) was 100 cm/s. The in-plane FOV and resolution were set to 30x30 cm2 and 1.2x1.2 mm2. Through-plane FOV and resolution (and therefore scan duration) varied depending on the object (relaxometry phantom: 108 mm/3 mm, duration=9.7 min; flow phantom: 150 mm/5 mm, duration=11.6 min; human brain: 144 mm/2.4 mm, duration=19.2 min).
For validation, phantom T1, T2 and flow measurements were also obtained using conventional inversion recovery, spin echo, and phase contrast acquisitions.
Results
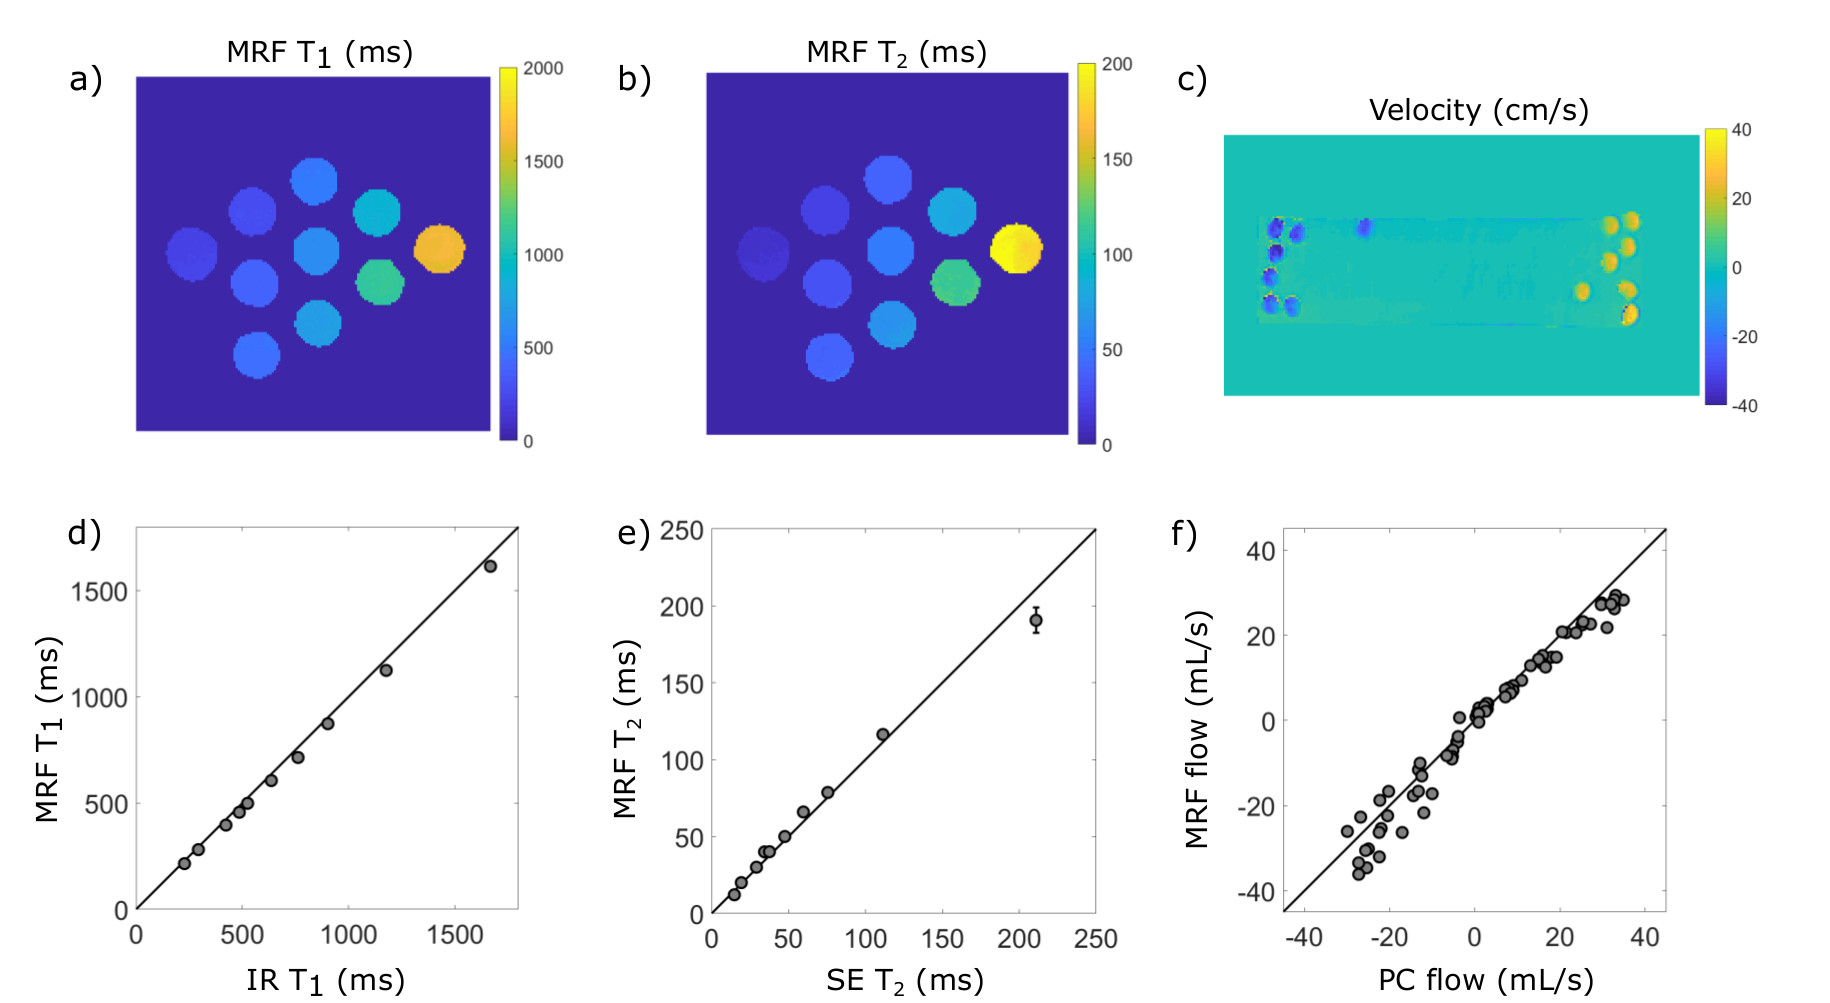
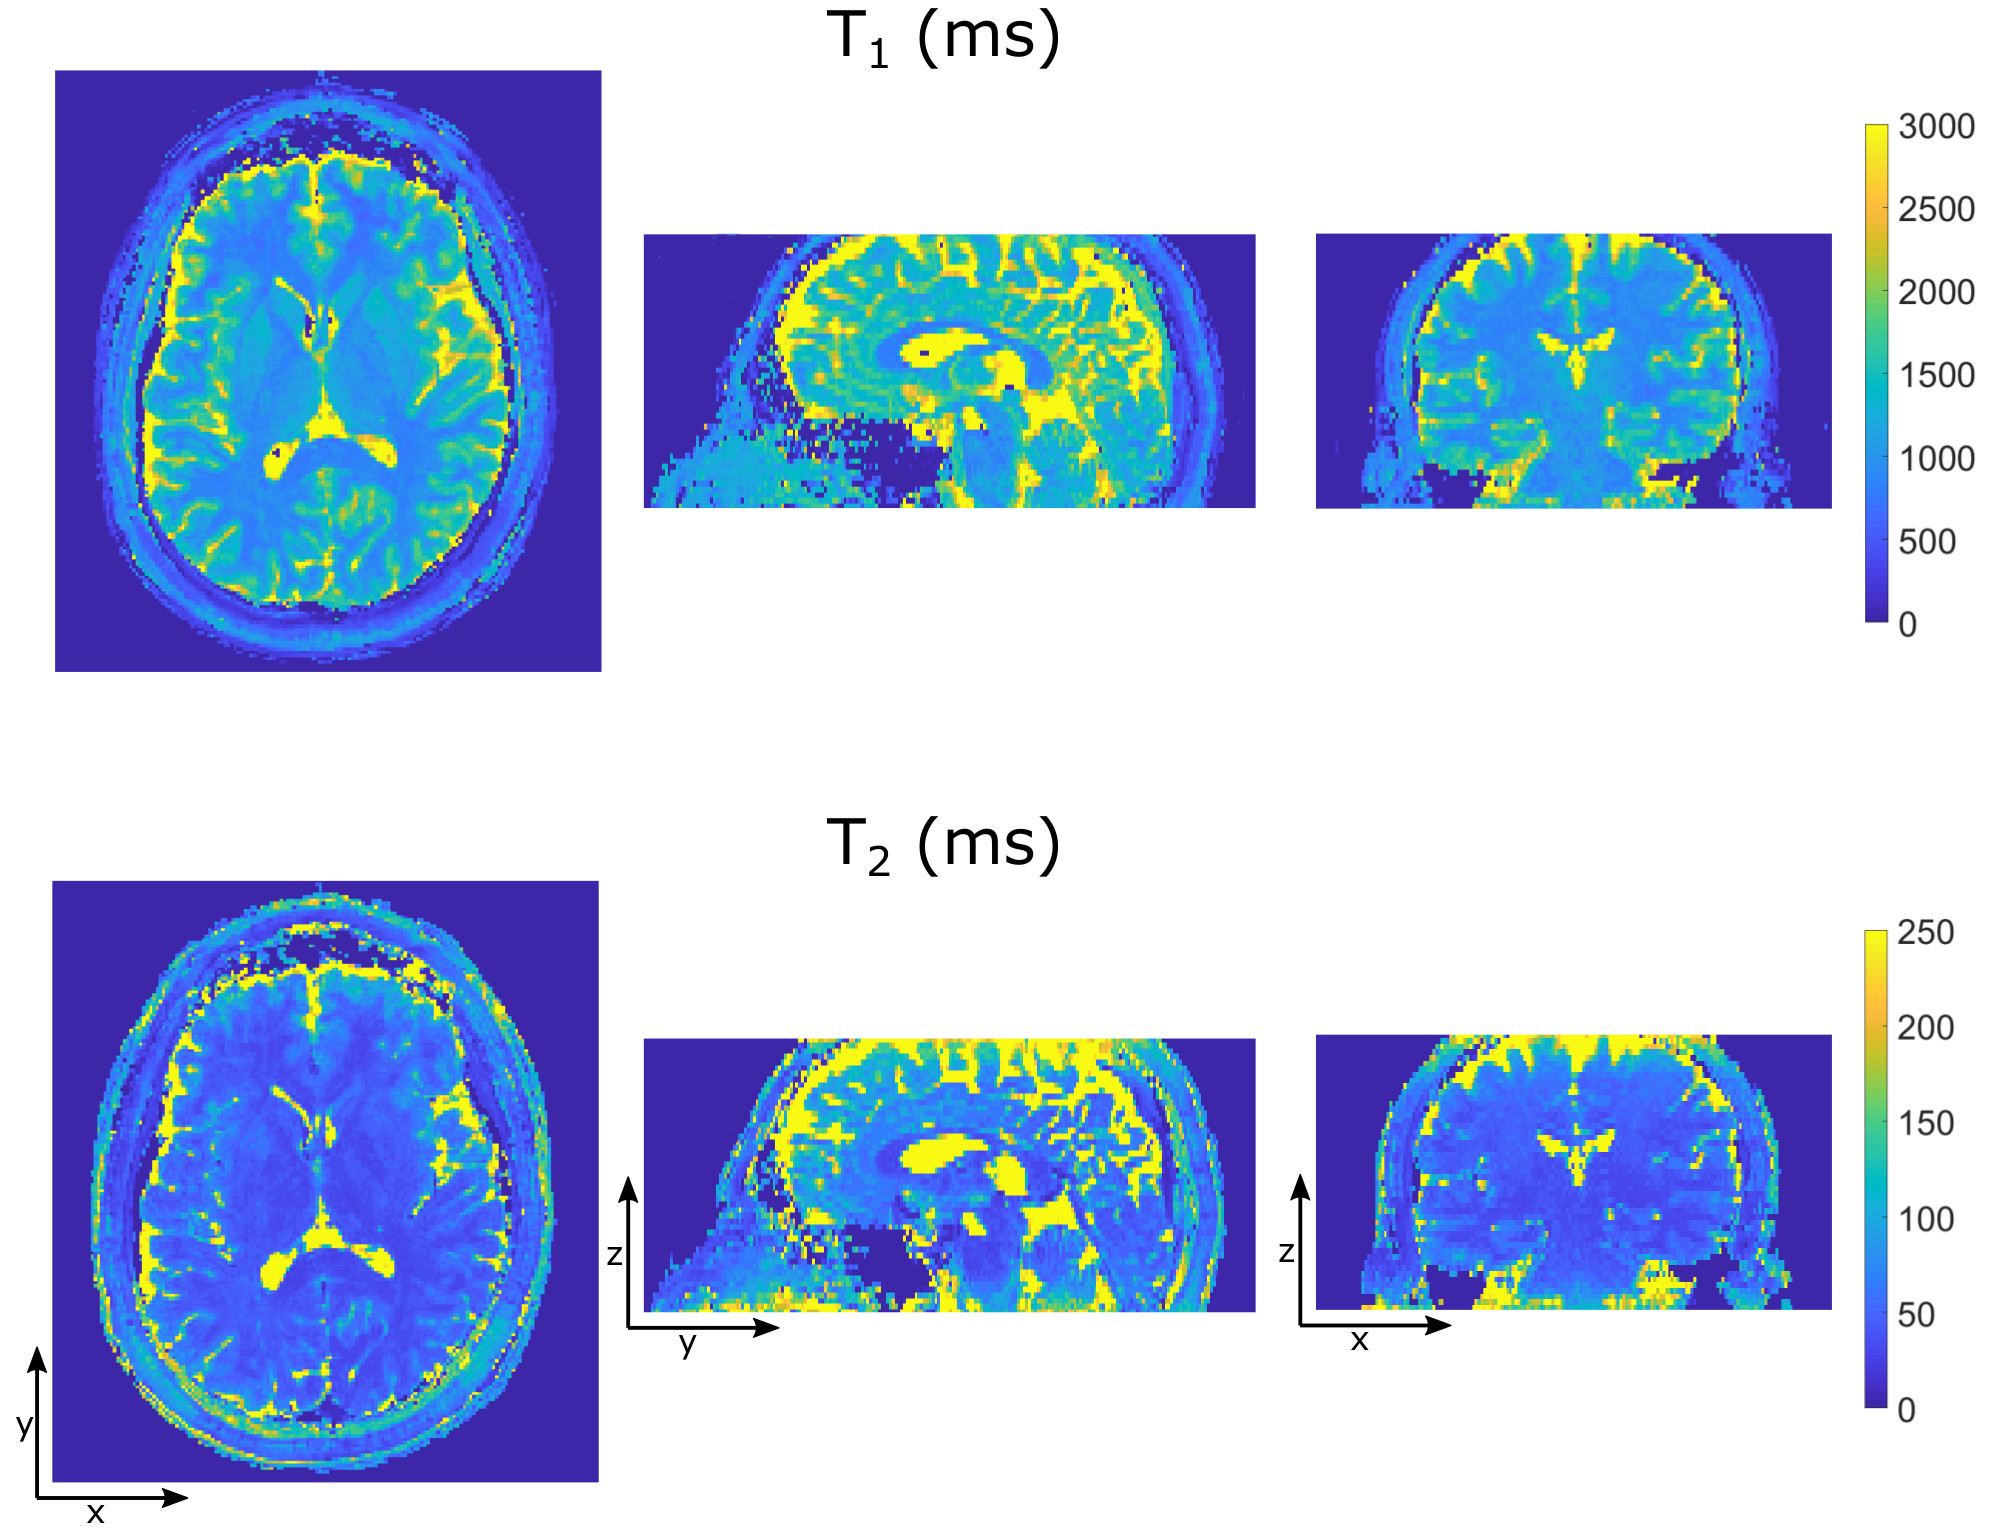
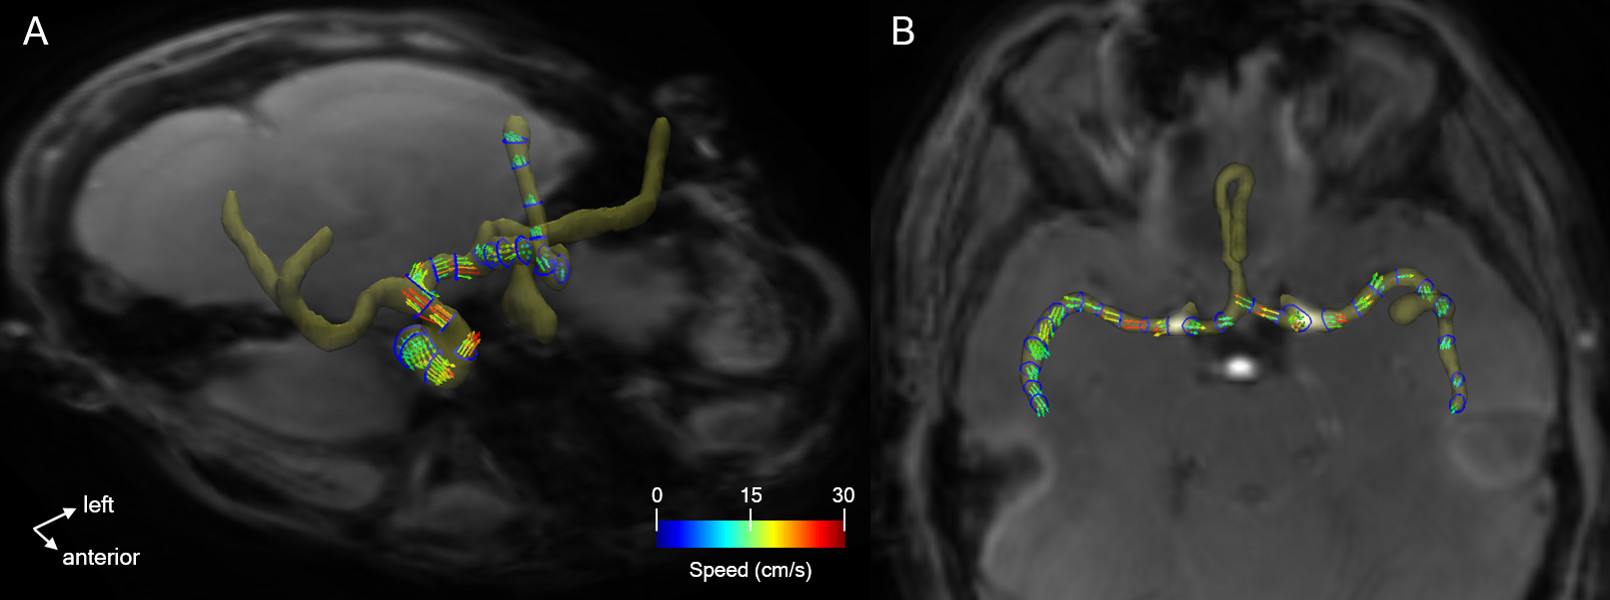
A comparison of T1, T2, and flow measurements with gold-standard methods is shown in Figure 2. In general, agreement was good, with concordance correlation coefficients of 0.99 for T1 and T2 and 0.98 for flow. T1 and T2 maps, and a time-averaged flow visualization from an in-vivo human brain acquisition are provided in Figures 3 and 4.
Discussion
The results presented demonstrate the feasibility of concurrent, volumetric measurement of T1, T2 and flow with a flow-encoded MRF sequence. The slight bias towards T1 underestimation (see Figure 2b) may be resolved by modelling the adiabatic inversion process (rather than treating it as instantaneous) in the dictionary simulation. Underestimation of the longest T2 value (Figure 2d) is likely a result of diffusion effects from z-axis spoiler gradients [6]. In general, image quality and accuracy may be improved by correcting for gradient imperfections and off-resonance blurring in the MRF reconstructions.
While a 19-minute scan duration for whole brain coverage is long, several opportunities exist for scan time reduction. As demonstrated in [3,7], a three-fold reduction can be achieved with kz-undersampling. Advanced reconstruction techniques which exploit inherent redundancies within MRF data (e.g. compressed sensing and low-rank approaches) can support even further undersampling [8].
Correct T1 and T2 estimation from MRF data requires knowledge of spin history and the relaxometry reconstruction must therefore preserve the temporal acquisition order. However, more flexibility is permitted in the phase-based flow reconstruction, especially with the use of a golden angle trajectory increment. As such, in addition to exploring options for acceleration, future work will involve retrospective binning by cardiac phase in the flow reconstruction, to support cardiac-resolved flow measurements.
By
extending the functionality of MRF to include flow measurement, this technique will facilitate efficient and comprehensive assessments of cerebral
blood flow and tissue integrity.
Acknowledgements
Funds for this research were provided by a HSBC Bank Canada Catalyst Research Grant from The Hospital for Sick Children.References
[1] Flassbeck, S., et al. Quantification of Flow by Magnetic Resonance Fingerprinting. In Proceedings of the 25th Annual Meeting of ISMRM, Honolulu, HI, 2017. Abstract #0128.
[2] Flassbeck, S., et al. Flow-MRF: a novel way of quantifying blood velocities in combination with tissue relaxation parameters. In Proceedings of 30th Annual Meeting of the Society for Magnetic Resonance Angiography, Glasgow, Scotland, 2018. p. 47.
[3] Ma, D. et al., Fast 3D Magnetic Resonance Fingerprinting for a Whole Brain Coverage. Magnetic Resonance in Medicine, 2018, 79:2190-2197.
[4] Jiang, Y., et al. MR fingerprinting using fast imaging with steady state precession (FISP) with spiral readout. Magnetic Resonance in Medicine, 2014, 74:1621-1631.
[5] Cao, X., et al. Robust sliding‐window reconstruction for accelerating the acquisition of MR fingerprinting. Magnetic Resonance in Medicine, 2017, 78:1579-1588.
[6] Kobayashi, Y., and Yasuhiko, T. Diffusion-weighting caused by spoiler gradients in the fast imaging with steady-state precession sequence may lead to inaccurate T2 measurements in MR fingerprinting. Magnetic Resonance in Medical Sciences, epub ahead of print, doi:10.2463/mrms.tn.2018-0027.
[7] Liao, C. et al. 3D MR fingerprinting with accelerated stack-of-spirals and hybrid sliding-window and GRAPPA reconstruction. Neuroimage, 2017, 162:13-22.
[8] Mazor, G. et al. Low-rank magnetic resonance fingerprinting. Medical Physics, 2018, 45:4066-4084.
Figures
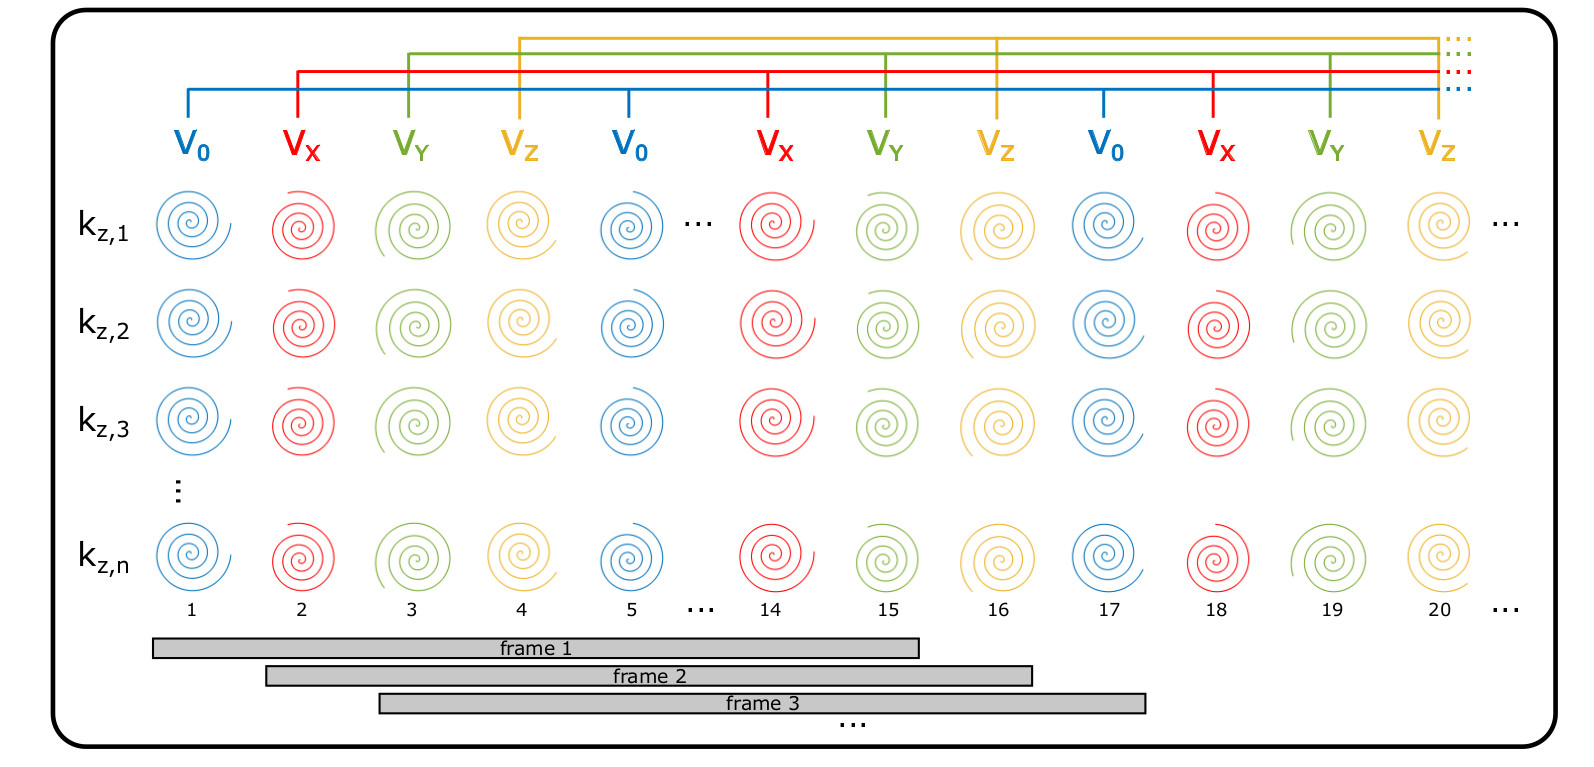
Figure 1: Flow-encoded MRF acquisition & reconstruction. The sequence consists of 1000 repetitions per kz, where the spiral kx-ky trajectory rotates by golden angle (111.25°) increments and the excitation flip angle varies according to the repeated sinusoid pattern described in [4]. The color of each spiral indicates flow encoding. The flow reconstruction (shown on top) creates 4 complex-valued 3D images (V0, Vx, Vy, Vz) by combining all data acquired under a single flow encode condition. The relaxometry reconstruction (bottom) uses a sliding window strategy, combining data from consecutive sets of 15 repetitions to generate 986 image frames.