1100
Dixon-cMRF: cardiac tissue characterization using three-point Dixon MR fingerprinting1School of Biomedical Engineering and Imaging Sciences, King's College London, London, United Kingdom, 2Philips Healthcare, Guilford, United Kingdom
Synopsis
Cardiac Magnetic Resonance Fingerprinting (cMRF) has been recently proposed to reduce scan time by estimating simultaneously T1, T2 and M0 in a single breath-hold acquisition. Additionally, cardiac fat images may carry additional diagnostic information and promising results have been shown for epicardial fat volume quantification, characterisation of cardiac masses and detection of fibro-fatty infiltrations. Here we extend cMRF with a three-point Dixon encoding (Dixon-cMRF) for enhanced myocardium tissue characterisation by providing T1, T2, M0 for both water and fat, from which an additional fat fraction map can be computed. The feasibility of Dixon-cMRF was evaluated in 5 healthy subjects.
Introduction
T1 and T2 mapping enable robust myocardial tissue characterisation and are promising biomarkers for a variety of cardiovascular diseases. Cardiac MR fingerprinting (cMRF) 1 has been recently proposed to reduce scan time by acquiring simultaneously myocardial T1 , T2 and M0 in a single breath-hold acquisition. Additionally, studies have suggested that fat images carry additional diagnostic information for cardiovascular disease and have shown promising results for the assessment of pericardial fat volume, fibro-fatty infiltration and cardiac masses using cardiac fat MR imaging 2,3. Here we propose to extend cMRF with a three-point Dixon encoding (Dixon-cMRF) to obtain: 1) water/fat time-point images and B0 estimation, and 2) simultaneous T1, T2, M0 (for water and fat) and fat fraction maps of the heart in a single breath-hold scan.Methods
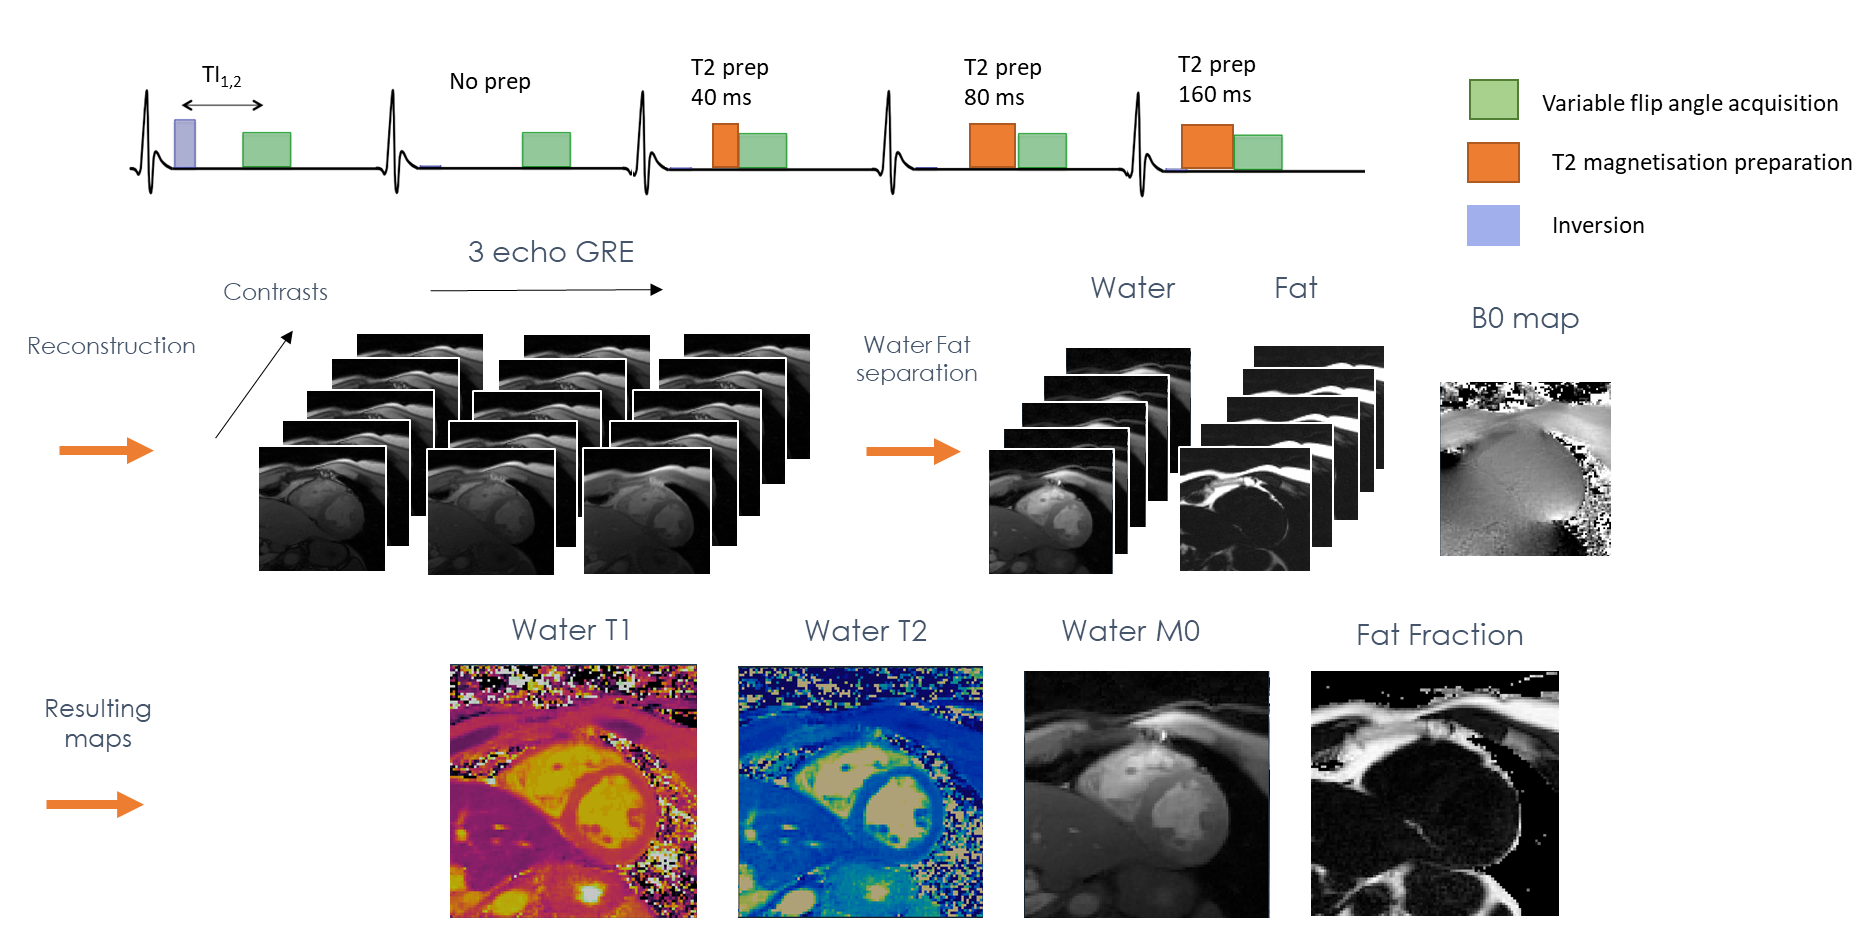
The proposed Dixon-cMRF is a 2D ECG-triggered cMRF acquisition with an optimised4 three-echo Dixon GRE readout. Acquisition is performed with a golden radial trajectory with one radial spoke per time-point; varying magnetization preparation modules and varying flip angles (Fig.1). A subject-specific dictionary is computed using slice profile corrected extended phase graph simulations taking into account the corresponding ECG signal.
In MRF, the dictionary D can be compressed in the temporal direction to allow faster reconstruction of compressed time-point images and faster matching5,6. The compression is defined as $$$\widetilde{X} =U_R^H X$$$ , where X is a set of time-point images, $$$\widetilde{X}$$$ are the corresponding compressed singular images obtained by applying the Hermitian conjugate of the temporal singular vectors U of D truncated at an appropriate rank R. Here we show that the water fat separation problem can be also solved in the compressed domain.
The compressed images $$$\widetilde{S_k}$$$ for each echo k were reconstructed separately using HD-PROST7 which proposes a novel multi-contrast patch-based low rank regularized reconstruction for MRF. Considering the water (W) and fat (F) images, $$$\widetilde{S_k}$$$ can be written as8
\[\widetilde{S_k} =U_R^H S_k=U_R^H (W+Fe^{i2\pi\Delta f t_k } ) e^{i2\pi\Delta f_{B_0}(t_k-t_1) }\]
\[=(\widetilde{W} + \widetilde{F} e^{i2\pi\Delta f t_k } ) e^{i2\pi\Delta f_{B_0}(t_k-t_1) }\]
Where $$$\Delta f$$$ is the precession frequency difference between fat and water, $$$\Delta f_{B_0}$$$ the one induced by B0 field inhomogeneities and $$$t_k$$$ is TE of echo k.
This signal formulation leads to the classical Dixon problem in the compressed domain which was solved for by using a 3-point Dixon separation method9. A B0 estimate is obtained from the high signal to noise ratio (SNR) first singular images and used to obtain $$$\widetilde{W}$$$ and $$$\widetilde{F}$$$ the water and fat compressed time series. T1, T2 and M0 maps are obtained through dot product matching for both water and fat. Additionally, a fat fraction map10 can be obtained from the fat and water M0 maps.
Dixon-cMRF was acquired in 5 healthy subjects on a 1.5T scanner (Ingenia, Philips Healthcare) and compared to 1st echo cMRF, and conventional MOLLI11, SASHA12 and T2GRASE13 mapping techniques with the same spatial resolution. Dixon-cMRF imaging parameters include: TR/TE1/TE2/TE3= 7.5/2/3.6/5.2 ms, 2x2mm2 resolution, FOV=256x256mm2, 8mm slice thickness, 187.5ms diastolic acquisition window, ~15s scan time.
Results
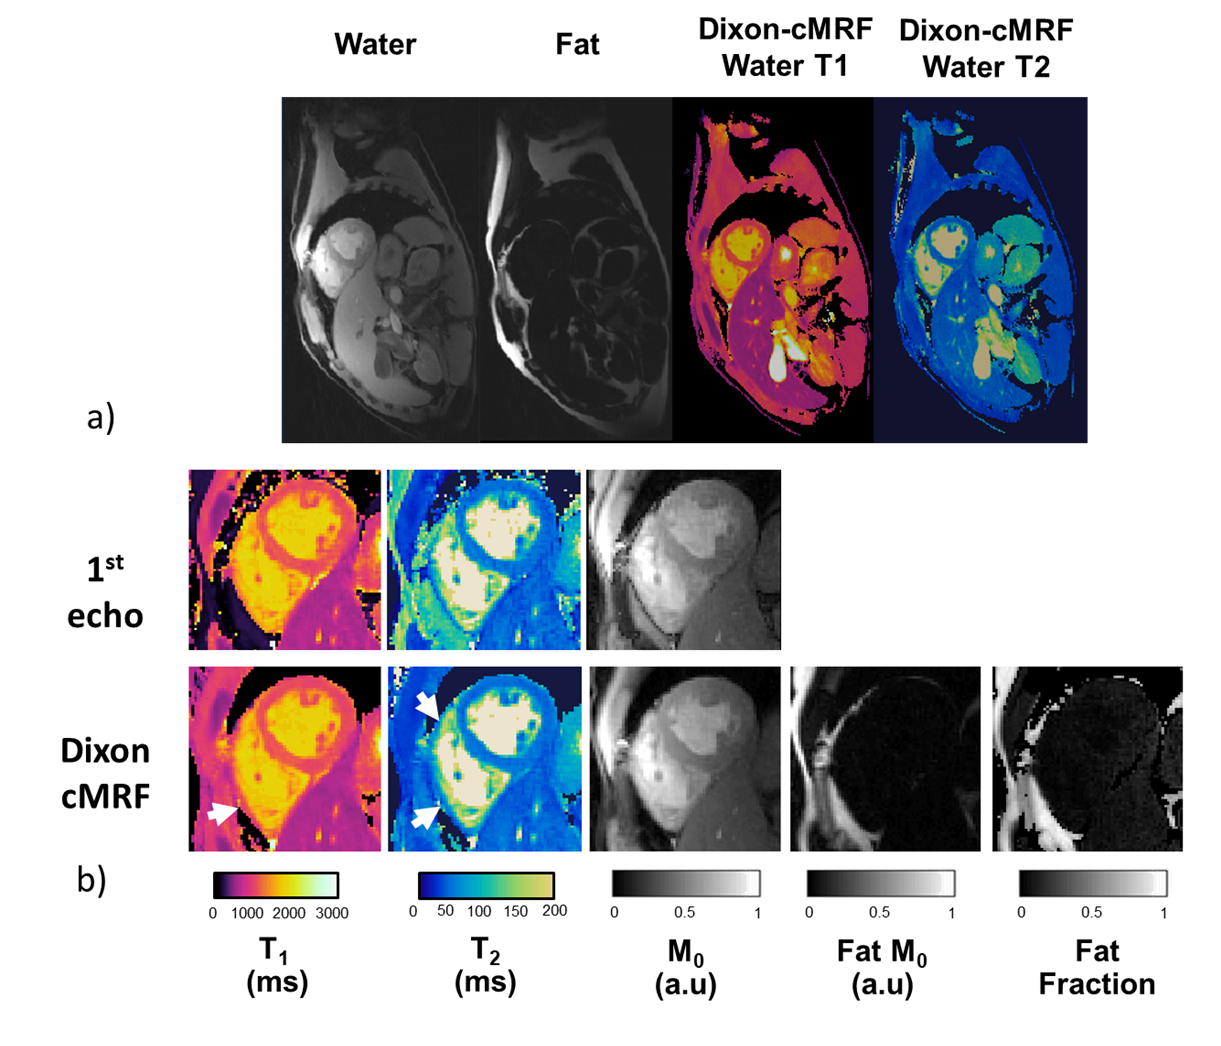
Whole FOV Dixon-cMRF results showing no water-fat swaps is presented in Fig.2 for a representative subject. A zoom in on the heart compares Dixon-cMRF maps to the maps obtained from the 1st echo data. Dixon-cMRF shows a better delineation of the myocardial wall in the presence of water and fat partial volume, which can affect T1 and T2 maps. The additional fat fraction map obtained from the water and fat M0 maps is also shown in Fig.2.
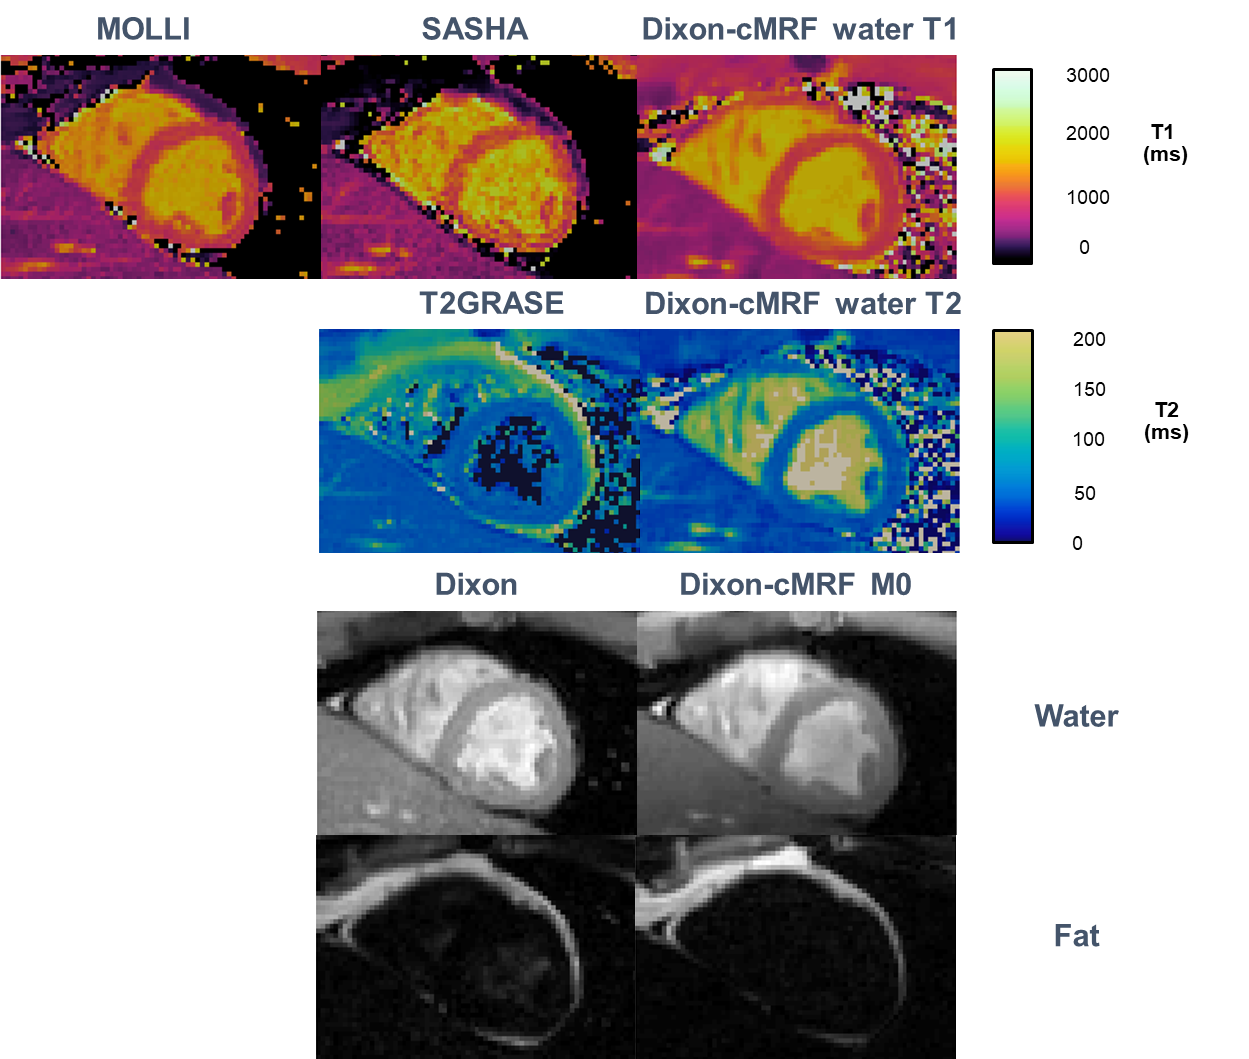
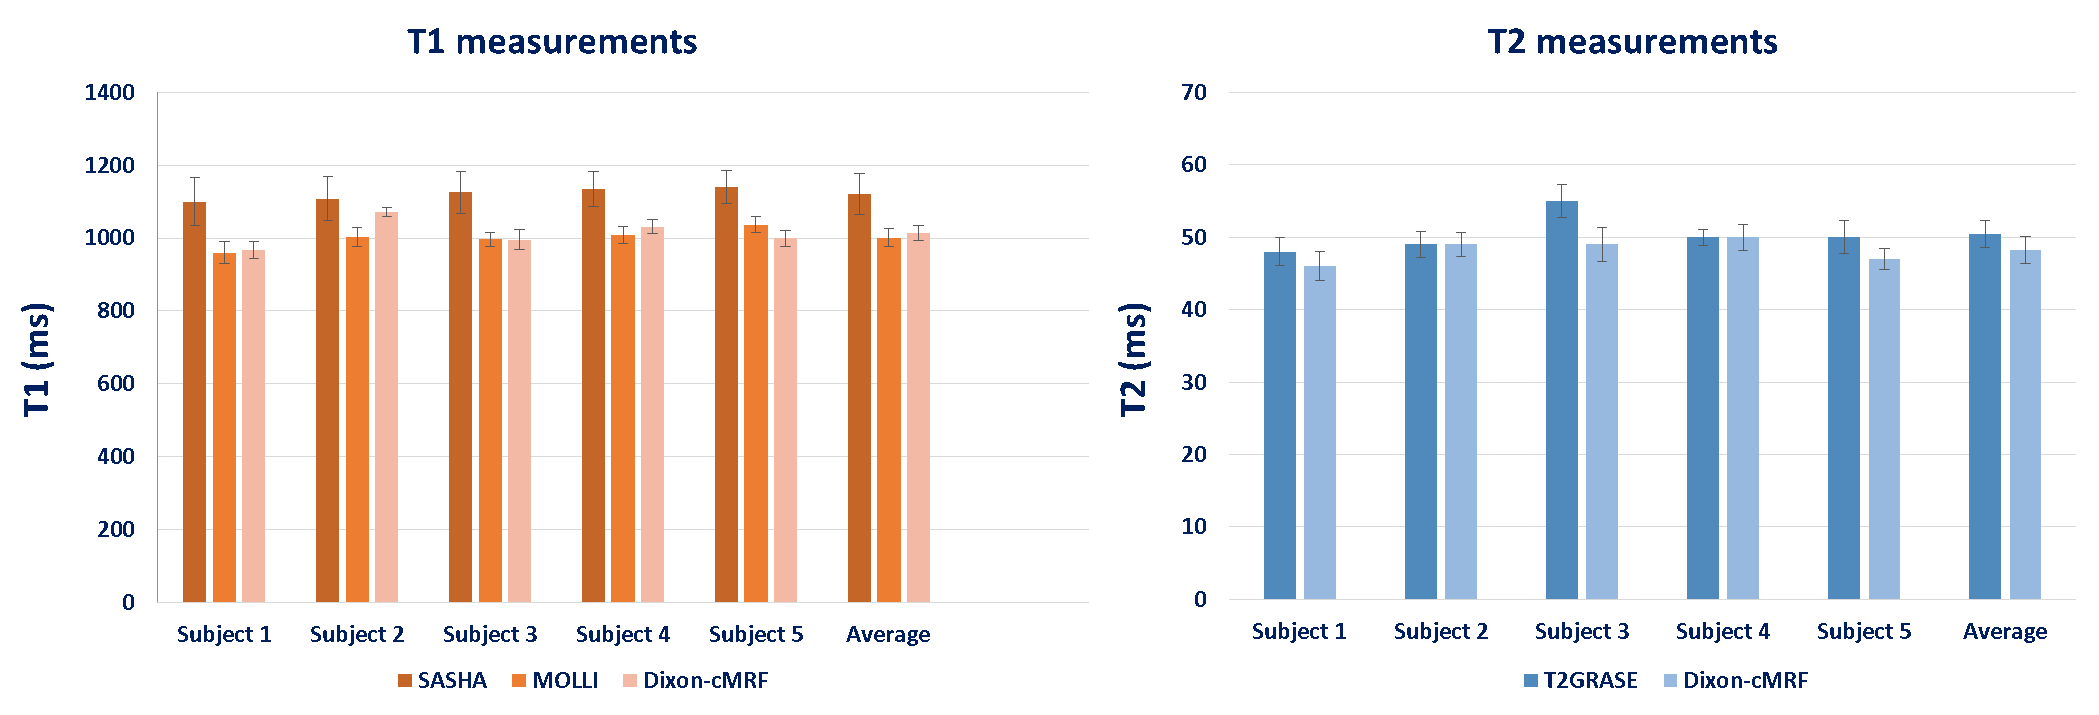
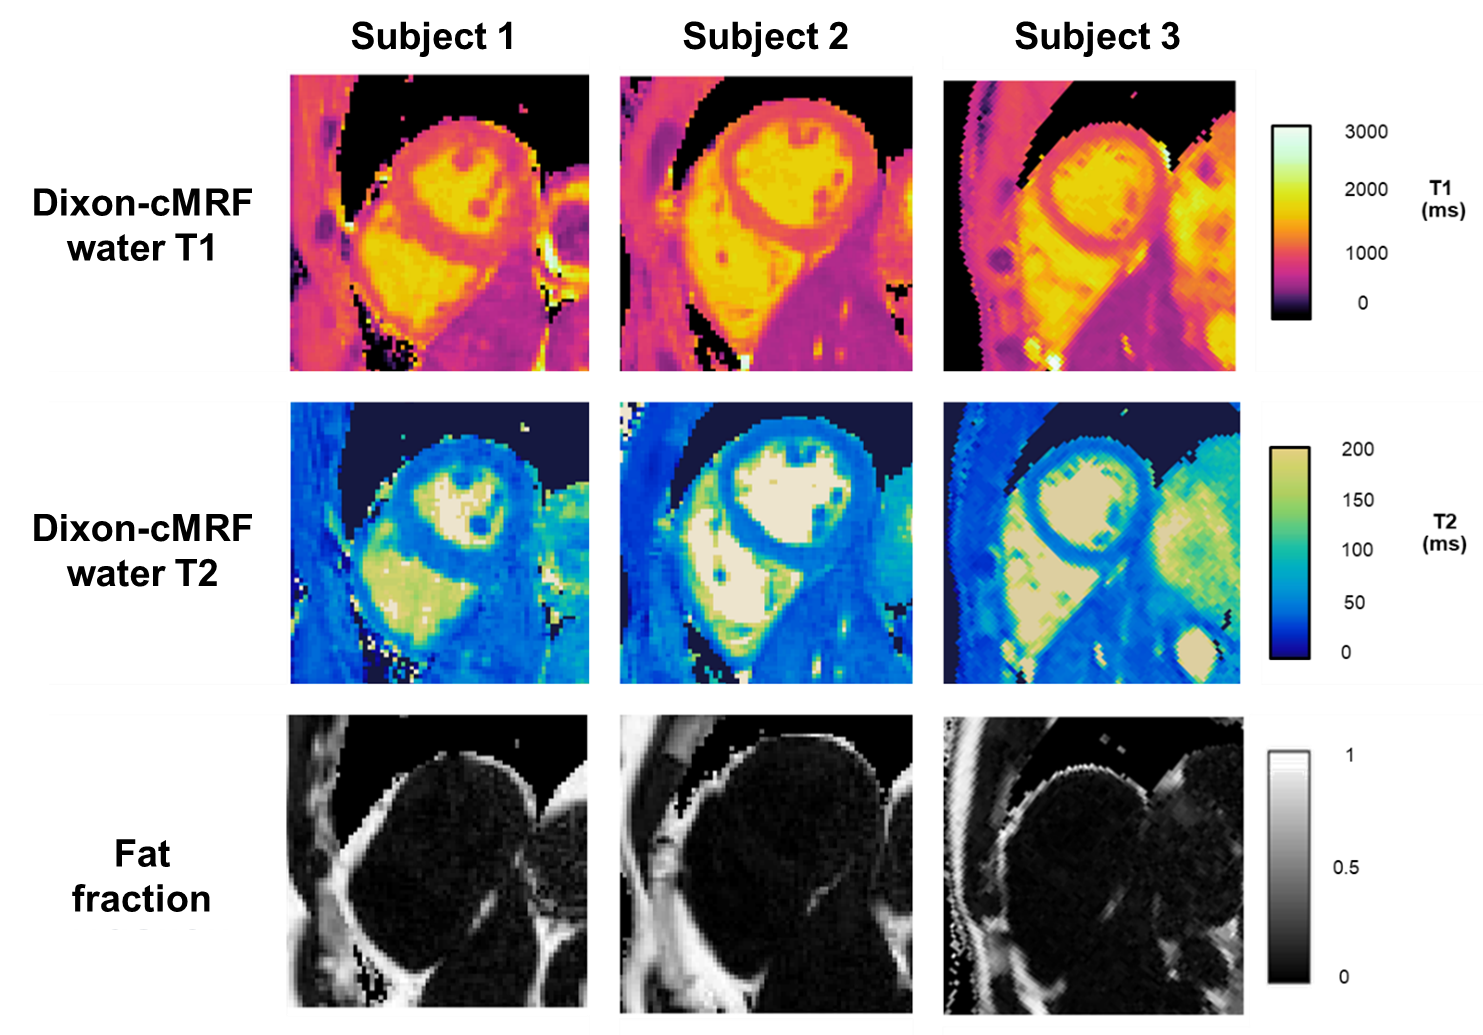
T1,T2 and M0 maps obtained from Dixon-cMRF are compared to the conventional techniques MOLLI, SASHA, T2GRASE and Dixon in Fig. 3. T1 and T2 values were measured in the septum for all subjects and reported in Fig. 4. Average T1 measurement and standard deviation for SASHA, MOLLI and Dixon-cMRF are 1121±111 ms, 1001±47 ms and 1013±41 ms respectively. T2 values for T2GRASE and Dixon-cMRF are 50.4±3.7 ms and 48.2±3.7 ms. Consistent high-quality maps were obtained for all subjects as shown in Fig.5.
Conclusion
A novel Dixon-cMRF acquisition has been proposed which provides water T1, T2, M0 and fat fraction maps in a single ~15s scan. Initial proof of concept and evaluations in healthy subjects showed the feasibility of the proposed method. Good qualitative and quantitative correspondence with conventional methods for T1 and T2 mapping was achieved for all subjects. Future work will aim to validate Dixon-cMRF in patients with cardiovascular disease.Acknowledgements
This work was supported by EPSRC (EP/L015226/1, EP/P001009, EP/P007619, EP/P032311/1) and Wellcome EPSRC Centre for Medical Engineering (NS/A000049/1)References
1. Hamilton JI, Jiang Y, Chen Y, et al. MR fingerprinting for rapid quantification of myocardial T1 , T2 , and proton spin density. Magn. Reson. Med. 2017;77:1446–1458 doi: 10.1002/mrm.26216.
2. Kellman P, Hernando D, Shah S, et al. Multiecho dixon fat and water separation method for detecting fibrofatty infiltration in the myocardium. Magn. Reson. Med. 2009;61:215–221 doi: 10.1002/mrm.21657.
3. Nafakhi H, Al-Mosawi A, Al-Nafakh H, Tawfeeq N. Association of pericardial fat volume with coronary atherosclerotic disease assessed by CT angiography. Br. J. Radiol. 2014;87:20130713 doi: 10.1259/bjr.20130713.
4. Pineda AR, Reeder SB, Wen Z, Pelc NJ. Cramér-Rao bounds for three-point decomposition of water and fat. Magn. Reson. Med. 2005;54:625–635 doi: 10.1002/mrm.20623.
5. McGivney DF, Pierre E, Ma D, et al. SVD Compression for Magnetic Resonance Fingerprinting in the Time Domain. IEEE Trans. Med. Imaging 2014;33:2311–2322 doi: 10.1109/TMI.2014.2337321.
6. Assländer J, Cloos MA, Knoll F, Sodickson DK, Hennig J, Lattanzi R. Low rank alternating direction method of multipliers reconstruction for MR fingerprinting. Magn. Reson. Med. 2018;79:83–96 doi: 10.1002/mrm.26639.
7. Bustin A, Cruz G, Jaubert O, Karina L, Botnar RM, Prieto C. High-Dimensionality Undersampled Patch-Based Reconstruction (HD-PROST) for Accelerated Multi-Contrast Magnetic Resonance Imaging. Proc. 27th Annu. Meet. ISMRM Montr. Canada. 2019.
8. Yeung HN, Kormos DW. Separation of true fat and water images by correcting magnetic field inhomogeneity in situ. Radiology 1986;159:783–786 doi: 10.1148/radiology.159.3.3704157.
9. Berglund J, Johansson L, Ahlström H, Kullberg J. Three-point dixon method enables whole-body water and fat imaging of obese subjects. Magn. Reson. Med. 2010;63:1659–1668 doi: 10.1002/mrm.22385.
10. Liu C-Y, McKenzie CA, Yu H, Brittain JH, Reeder SB. Fat quantification with IDEAL gradient echo imaging: Correction of bias fromT1 and noise. Magn. Reson. Med. 2007;58:354–364 doi: 10.1002/mrm.21301.
11. Messroghli DR, Radjenovic A, Kozerke S, Higgins DM, Sivananthan MU, Ridgway JP. Modified Look-Locker inversion recovery (MOLLI) for high-resolutionT1 mapping of the heart. Magn. Reson. Med. 2004;52:141–146 doi: 10.1002/mrm.20110.
12. Chow K, Flewitt JA, Green JD, Pagano JJ, Friedrich MG, Thompson RB. Saturation recovery single-shot acquisition (SASHA) for myocardial T1 mapping. Magn. Reson. Med. 2014;71:2082–2095 doi: 10.1002/mrm.24878.
13. Sprinkart AM, Luetkens JA, Träber F, et al. Gradient Spin Echo ( GraSE ) imaging for fast myocardial T2 mapping. 2015:1–9 doi: 10.1186/s12968-015-0127-z.
Figures