1096
Predicting 10-Year Risk of Type 2 Diabetes Onset Using Lifestyle, Genomics, and Whole Body DIXON MR Imaging1Human Longevity, Inc, San Diego, CA, United States
Synopsis
Diabetes Mellitus is an important factor in the onset and progression of many related serious conditions. It is also very actionable and preventable thus the need for improved risk assessment to identify high-risk individuals early.
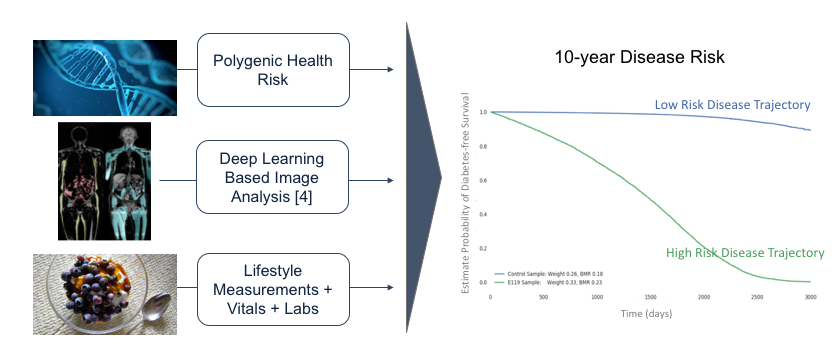
In this study we use lifestyle, genomic, MRI features and Cox Proportional Hazard models1 to improve DM risk assessment. To our knowledge, this is the first demonstration of integrating these features for assessing type 2 DM risk. Our final cross-validated concordance index is 84%, 4% of which is due to MRI features. On average our models can predict up to ten years into the future.
Background
Diabetes Mellitus (DM) is a debilitating condition that affects millions worldwide. It has also been shown to be an important factor in the onset and progression of cardiovascular disease (CVD), certain types of cancer, depression and a variety of microvascular complications. Its prevalence in the US has been rising steadily from 0.9% in the late 50’s to 7.4% in 20152 and has become one of the most expensive diseases to treat with costs projected to double in the next 25 years3. It is also one of the most actionable and preventable conditions thus the urgent need for improved risk assessment to identify individuals at high risk early.
In this study, we use lifestyle (LS), genomic (GEN), MRI data and Cox Proportional Hazard (CPH) regression models1 to improve type 2 DM risk assessment over 10-years. To our knowledge, this is the first demonstration of integrating MRI, genomics, and lifestyle factors for assessing type 2 DM onset risk. We obtained a cross-validated concordance index (CI) score for the integrated model of around 84%, 4% of which was due to MRI features alone. We expect this number to increase 10-fold as we progressively compute the remaining quantitative measures from whole body Dixon MRI annotations with a fully automated approach as described by Graff et al4.
Methods
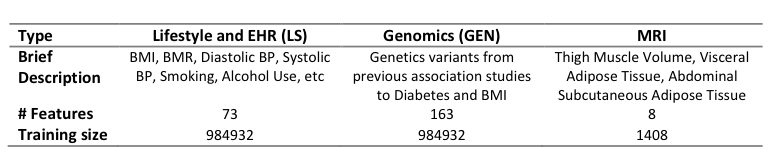
We extracted 984,932 incidence records from 502,616 UK Biobank patient assessments5 and 4,606,009 hospital episode icd10 diagnoses (HES). Each incidence record combines assessments and time to either type 2 DM onset or censoring. Incidence records were mostly censored as only 72518 corresponded to type 2 DM events (ICD10 codes E11-14). A total of 73 lifestyle and clinical features included BMI, BMR, smoking, alcohol, among others. These features were subjected to further cleaning, imputation, and encoding procedures.
Genomic variants were collected from known BMI and diabetes risk associated SNPs6,7. The SNPs were then scored and filtered for imputation quality, and whether strand and chip information were unambiguously present.
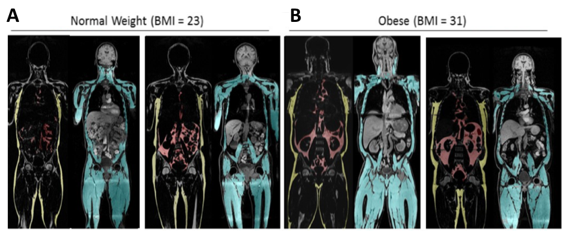
MRI features were extracted from volumetric measurements of visceral adipose (VAT) and abdominal subcutaneous (SAT) tissues, see Fig 1 for more details. We obtained MRI annotations for only 1000 individuals which resulted in 1408 incidence records out of which 95.2% were censored.
A summary of the features mentioned above is presented in Table 1.
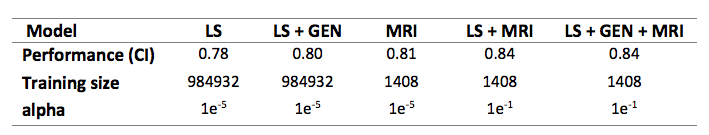
We used LS and LS+GEN incidence records as input to train LS and LS+GEN CPH models, respectively. These models were trained on 90% and validated in the remaining 10% of the data. We additionally performed three-fold cross-validation on the training subset to find the best hyper-parameter, alpha, and used this model to score the validation set.
Our final integrated CPH model was trained using a 3-fold double cross-validation procedure – due to the small size of the available training data. The input for this model was composed of eight MRI features as described above, plus a risk score computed by either the LS or LS+GEN CPH model previously trained on the large cohort of non-related individuals.
Results
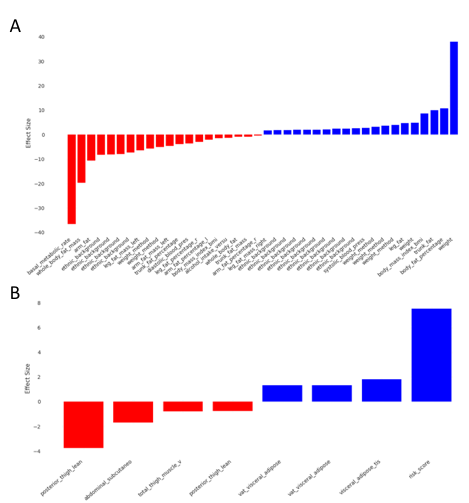
Results for all of our models are shown in Table 2. Average model performance (CI = Concordance Index) for both LS+MRI and LS+GEN+MRI model is about 5% better than LS+GEN model and 4% better than the model trained with only MRI features, which is the second best model. These improvements showcase the importance of MRI features. Presumably, the reason GEN features did not help improve performance over the base LS+MRI model is due to the ‘curse of dimensionality’ from adding the extra 489 genomic features without increasing the training set size. Other models using smaller feature sets perform worse as expected. On average, our models can make predictions ten years into the future which corresponds to the average range of UK biobank longitudinal data. The most important features – in terms of effect size – for the best models are shown in Fig 2. Finally, we show predictions for individuals (Fig. 3). The results are as expected, i.e., individuals showing high BMI and low BMR are at higher risk of diabetes.Conclusions
Here, we describe a first of kind multimodal approach which predicts type 2 DM onset and 10-year risk. We demonstrate improved performance by leveraging MRI, genetics, and lifestyle factors. Future work includes accounting for competing risks and confounding factors, for example, diabetic individuals who develop cachexia. Moreover, we plan to improve the current performance by leveraging close 20,000 additional individuals with whole-body MRI data using our fully automated approach4, this effort is ongoing. We expect this model to help individuals and clinicians to understand long-term risk and to assist prevention of DM progression and associated complications including premature heart disease and stroke, blindness, limb amputations, and kidney failure.Acknowledgements
No acknowledgement found.References
1. Cox DR. Regression Models and Life-Tables. J R Stat Soc Ser B [Internet]. 1972;34(2):187–220. Available from: http://www.jstor.org/stable/2985181
2. CDC. Long-Term Trends in Diabetes [Internet]. 2017. Available from: https://www.cdc.gov/diabetes/statistics/slides/long_term_trends.pdf
3. Huang ES, Basu A, O’Grady M, Capretta JC. Projecting the Future Diabetes Population Size and Related Costs for the U.S. Diabetes Care [Internet]. 2009 Dec 1;32(12):2225 LP-2229. Available from: http://care.diabetesjournals.org/content/32/12/2225.abstract
4. Graff A, Tkach D, Wu J et al. Fully Automated 3D Body Composition Using Fully Convolutional Neural Networks and DIXON Imaging. In: ISMRM. 2019. p. Submitted.
5. Sudlow C, Gallacher J, Allen N, Beral V, Burton P, Danesh J, et al. UK Biobank: An Open Access Resource for Identifying the Causes of a Wide Range of Complex Diseases of Middle and Old Age. PLOS Med [Internet]. 2015 Mar 31;12(3):e1001779. Available from: https://doi.org/10.1371/journal.pmed.1001779
6. Consortium DiaGRAM (DIAGRAM), Consortium AGENT 2 D (AGEN-T, Consortium SAT 2 D (SAT2D), Consortium MAT 2 D (MAT2D), Consortium T 2 DGE by N sequencing in multi-ES (T2D-G, Mahajan A, et al. Genome-wide trans-ancestry meta-analysis provides insight into the genetic architecture of type 2 diabetes susceptibility. Nat Genet [Internet]. 2014 Feb 9;46:234. Available from: https://doi.org/10.1038/ng.2897
7. Locke AE, Kahali B, Berndt SI, Justice AE, Pers TH, Day FR, et al. Genetic studies of body mass index yield new insights for obesity biology. Nature [Internet]. 2015 Feb 11;518:197. Available from: https://doi.org/10.1038/nature14177
Figures