1085
Changes in myocardial stiffness and damping ratio due to cardiac amyloidosis: Evaluation with magnetic resonance elastography and a novel neural network inversionArvin Arani1, Shivaram P. Arunachalam1, Ian C. Chang1, Phillip J. Rossman1, Kevin Glaser1, Joshua D. Trzasko1, Kiaran P. McGee1, Armando Manduca1, Martha Grogan1, Angela Dispenzieri1, Richard L. Ehman1, Philip A. Araoz1, and Matthew C. Murphy1
1Radiology, Mayo Clinic, Rochester, MN, United States
Synopsis
Myocardial viscoelasticity plays an important role in cardiac function. The objective of this study is to evaluate if magnetic resonance elastography (MRE) can detect differences in myocardial stiffness (µ) and damping ratio (ζ) in cardiac amyloidosis patients. Twenty-six patients with cardiac amyloidosis and 96 healthy volunteers were enrolled. The mean left ventricular µ was significantly higher (p < 0.01) and ζ was significantly lower (p<0.01) in cardiac amyloidosis patients (median µ: 19.5 kPa, median ζ: 0.15) compared to normal controls (median µ: 15.7 kPa, median ζ: 0.18). These results motivate future investigation of cardiac MRE in different patient cohorts.
Purpose:
Dysregulation of myocardial viscoelasticity plays an important role in cardiac function leading to congestive heart failure (1), and can contribute to left ventricular (LV) remodeling, in myocardial infarctions (2). Shear wave elastography is an emerging imaging approach for measuring myocardial stiffness in vivo (3-12). Recently, cardiac magnetic resonance elastography (MRE) reported that patients with cardiac amyloidosis have significantly elevated myocardial stiffness (11) compared to healthy age-matched controls. However, due to inversion algorithm limitations in thin structures, the damping ratio (a viscoelastic parameter describing the ability of tissue to attenuate vibrations) has never been reported for myocardial tissues. Recent advances in developing neural network inversions for MRE have now made it possible to obtain robust damping ratio estimates in vivo (13). The objective of this study is to evaluate if a neural network inversion can detect differences in myocardial stiffness and damping ratio between patients with cardiac amyloidosis and healthy controls.Methods:
Twenty-six patients with cardiac amyloidosis and 93 healthy volunteers were enrolled after receiving institutional review board and written informed consent approval. All subjects underwent cardiac MRI/MRE. Patients with tissue diagnosis of amyloidosis and left ventricular maximal wall thickness of greater than 12 mm by echocardiography were classified as having cardiac amyloidosis. Cardiac MRE was used to quantitatively measure myocardial stiffness (µ = density * wave speed squared) and damping ratio (ζ = 0.5*loss modulus/storage modulus) across the left ventricle in early systole for each subject. The density of the myocardium is assumed to be 1000 kg/m3. The experimental set up is shown in Figure 1. MRE imaging was conducted at a vibration frequency of 140 Hz using the same procedure as previously described (14). Exams with an octahedral shear strain signal-to-noise ratio (OSS-SNR) (15,16) above 1.18 were considered in the analysis. The previously described neural network inversion methodology (13) was modified to train an inversion to provide stiffness and damping ratio estimates at the specified image resolution and frequency while also accounting for missing data to improve estimates near edges. Statistical analysis was done using a commercial software package (OriginPro 2015, OriginLab Corporation, Northampton, MA) that implemented a Mann-Whitney U test of significance (17). A p-value of less than 0.05 was considered statistically significant.Results:
The mean OSS-SNR of 7 patients fell below our threshold and these exams were excluded from the study. The LV µ of the 19 remaining cardiac amyloid patients (median: 19.5 kPa, min: 16.2 kPa, max: 26.0 kPa) was significantly higher (p < 0.01) than the LV µ of the myocardium of the 93 normal healthy volunteers (median: 15.7 kPa, min: 13.2, max: 23.6) (Figure 2). The LV ζ of the cardiac amyloid patients (median: 0.15, min: 0.10, max: 0.22) was significantly lower (p < 0.01) than for the normal healthy volunteers (median: 0.18, min: 0.11, max: 0.3) (Figure 3). Typical µ and ζ maps from the midsection of the left ventricle in a healthy volunteer and an age- and sex-matched amyloidosis patient are shown in Figure 4. A scatter plot of ζ against µ demonstrates the different clustering patterns of patients and healthy controls in this 2D feature space (Figure 5).Discussion and Conclusions:
This study demonstrates that cardiac MRE, with the use of neural network inversions, can be used to quantify two distinct LV viscoelastic parameters; µ and ζ, both of which are affected by disease. These results suggest that myocardial stiffness and damping ratio undergo opposite effects in their response to disease. Damping ratio significantly decreased in patients with cardiac amyloidosis, while myocardial stiffness significantly increased. These results motivate future investigations of cardiac MRE with neural network inversions to assess other patient cohorts, to monitor treatment response, and to improve the early diagnosis of cardiac diseases.Acknowledgements
This work was supported by National Institutes of Health (NIH) grants 5R01HL115144 and EB001981 and the Mayo Clinic Center for Individualized Medicine, Imaging Biomarker Discovery Program.References
1. Zile MR, Baicu CF, Gaasch WH. Diastolic heart failure--abnormalities in active relaxation and passive stiffness of the left ventricle. The New England Journal of Medicine 2004;350(19):1953-1959. 2. Holmes JW, Borg TK, Covell JW. Structure and mechanics of healing myocardial infarcts. Annual Review of Biomedical Engineering 2005;7:223-253. 3. Kolipaka A, Aggarwal SR, McGee KP, Anavekar N, Manduca A, Ehman RL, Araoz PA. Magnetic resonance elastography as a method to estimate myocardial contractility. Journal of Magnetic Resonance Imaging 2012;36(1):120-127. 4. Kolipaka A, Mcgee KP, Araoz PA, Glaser KJ, Manduca A, Romano AJ, Ehman RL. MR Elastography as a Method for the Assessment of Myocardial Stiffness: Comparison with an Established Pressure-Volume Model in a Left Ventricular Model of the Heart. Magnetic Resonance in Medicine 2009;62(1):135-140. 5. Elgeti T, Beling M, Hamm B, Braun J, Sack I. Cardiac magnetic resonance elastography: toward the diagnosis of abnormal myocardial relaxation. Investigative radiology 2010;45(12):782-787. 6. Elgeti T, Knebel F, Hattasch R, Hamm B, Braun J, Sack I. Shear-wave amplitudes measured with cardiac MR elastography for diagnosis of diastolic dysfunction. Radiology 2014;271(3):681-687. 7. Elgeti T, Laule M, Kaufels N, Schnorr J, Hamm B, Samani A, Braun J, Sack I. Cardiac MR elastography: comparison with left ventricular pressure measurement. Journal of Cardiovascular Magnetic Resonance 2009;11:44. 8. Couade M, Pernot M, Messas E, Bel A, Ba M, Hagege A, Fink M, Tanter M. In vivo quantitative mapping of myocardial stiffening and transmural anisotropy during the cardiac cycle. IEEE Transactions on Medical Imaging 2011;30(2):295-305. 9. Song P, Zhao H, Urban M, Manduca A, Pislaru S, Kinnick R, Pislaru C, Greenleaf J, Chen S. Improved shear wave motion detection using pulse-inversion harmonic imaging with a phased array transducer. IEEE Transactions on Medical Imaging 2013;32(12):2299-2310. 10. Hollender PJ, Wolf PD, Goswami R, Trahey GE. Intracardiac echocardiography measurement of dynamic myocardial stiffness with shear wave velocimetry. Ultrasound in medicine & biology 2012;38(7):1271-1283. 11. Arani A, Arunachalam SP, Chang ICY, Baffour F, Rossman PJ, Glaser KJ, Trzasko JD, McGee KP, Manduca A, Grogan M, Dispenzieri A, Ehman RL, Araoz PA. Cardiac MR elastography for quantitative assessment of elevated myocardial stiffness in cardiac amyloidosis. Journal of magnetic resonance imaging : JMRI 2017;46(5):1361-1367. 12. Wassenaar PA, Eleswarpu CN, Schroeder SA, Mo X, Raterman BD, White RD, Kolipaka A. Measuring age-dependent myocardial stiffness across the cardiac cycle using MR elastography: A reproducibility study. Magnetic Resonance in Medicine 2016;75(4):1586-1593. 13. Murphy MC, Manduca A, Trzasko JD, Glaser KJ, Huston J, Ehman RL. Artificial neural networks for stiffness estimation in magnetic resonance elastography. Magnetic Resonance in Medicine 2018;80(1):351-360. 14. Arani A, Glaser KL, Arunachalam SP, Rossman PJ, Lake DS, Trzasko JD, Manduca A, McGee KP, Ehman RL, Araoz PA. In vivo, high-frequency three-dimensional cardiac MR elastography: Feasibility in normal volunteers. Magnetic Resonance in Medicine 2016. 15. McGarry MD, Van Houten EE, Perrinez PR, Pattison AJ, Weaver JB, Paulsen KD. An octahedral shear strain-based measure of SNR for 3D MR elastography. Physics in Medicine and Biology 2011;56(13):N153-164. 16. Arani A, Glaser KL, Arunachalam SP, Rossman PJ, Lake DS, Trzasko JD, Manduca A, McGee KP, Ehman RL, Araoz PA. In vivo, high-frequency three-dimensional cardiac MR elastography: Feasibility in normal volunteers. Magnetic Resonance in Medicine 2017;77(1):351-360. 17. Siegel S. Nonparametric statistics for the behavioral sciences. New York, McGraw-Hill, 1956.Figures
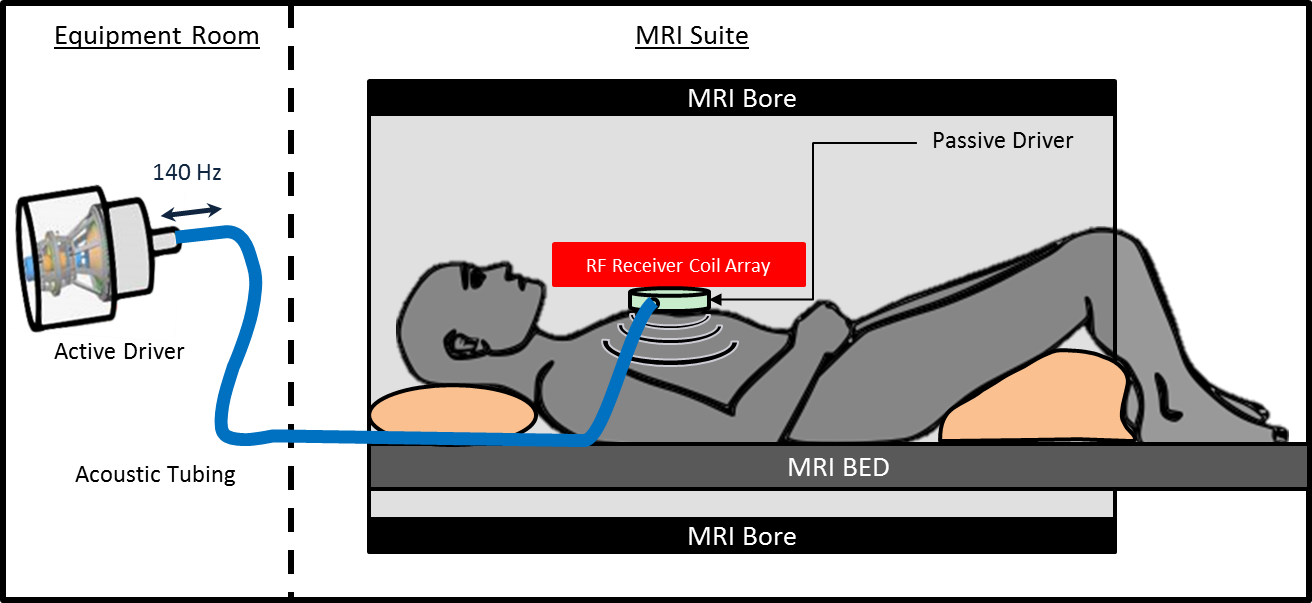
Figure 1: Cardiac MRE experimental setup. An active
driver delivers 140-Hz vibrations through acoustic tubing to a passive cardiac
driver that is strapped to the subject’s chest. Shear waves are transmitted
into the myocardium and the wave displacement field is imaged with the MRI
scanner.
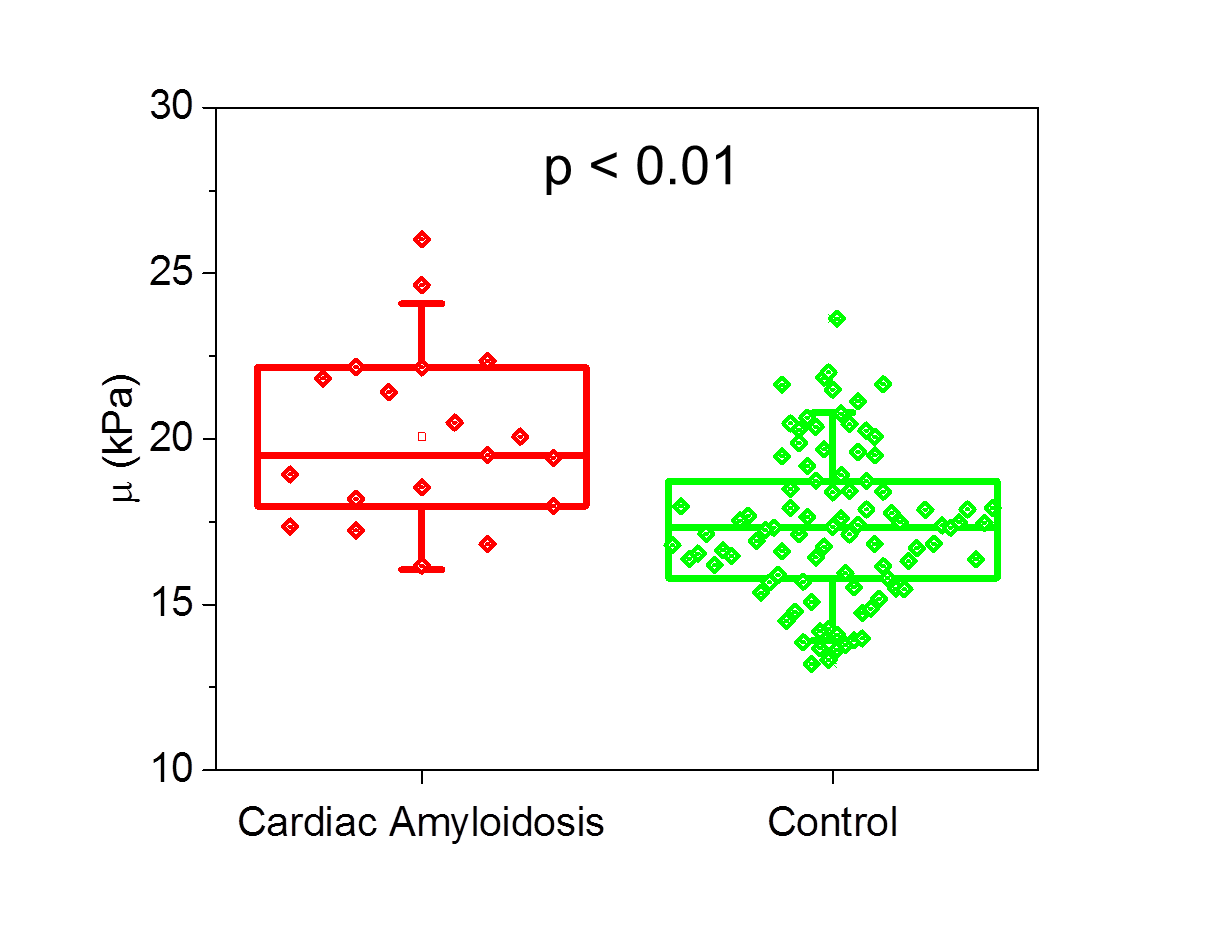
Figure
2: Myocardial stiffness (µ) is significantly higher in patients with cardiac
amyloidosis than healthy controls (p < 0.01). The mean stiffness of the left ventricle of 19
patients with cardiac amyloidosis and 93 healthy controls is shown above. The bottom and top of the box represent the 1st
and 3rd quartiles, the line within the box represents the median value, the empty
square in the box represents the mean, and the whiskers represent 1.5 SD from
the mean.
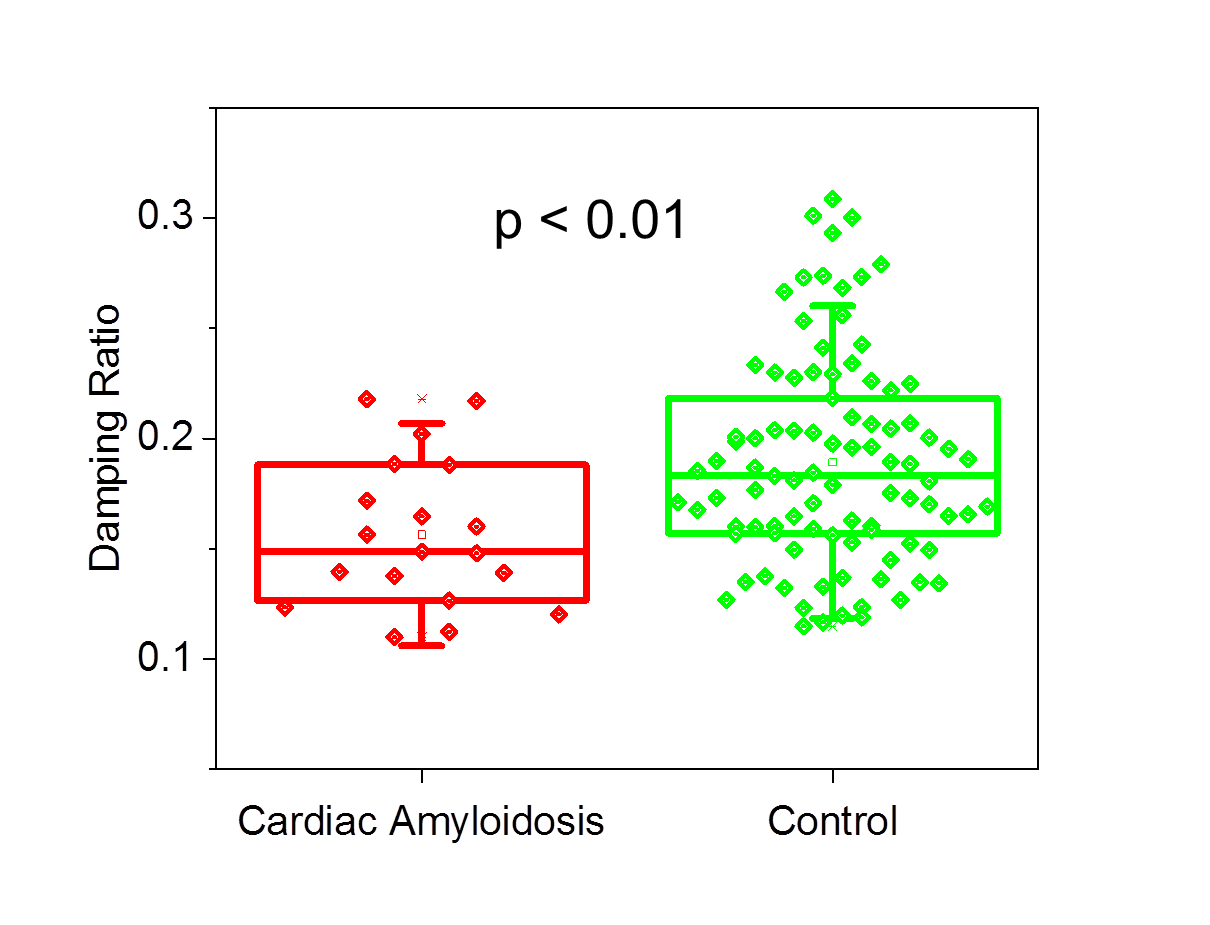
Figure
3: Box-and-whisker plot of the mean damping ratio in patients diagnosed with
amyloidosis and normal healthy controls. Patients in the amyloidosis group had
significantly lower damping ratios across the left ventricular volume than
healthy controls (p < 0.01). The
bottom and top of the box represent the 1st and 3rd quartiles, the line within
the box represents the median value, the empty square in the box represents the
mean, and the whiskers represent 1.5 SD from the mean.
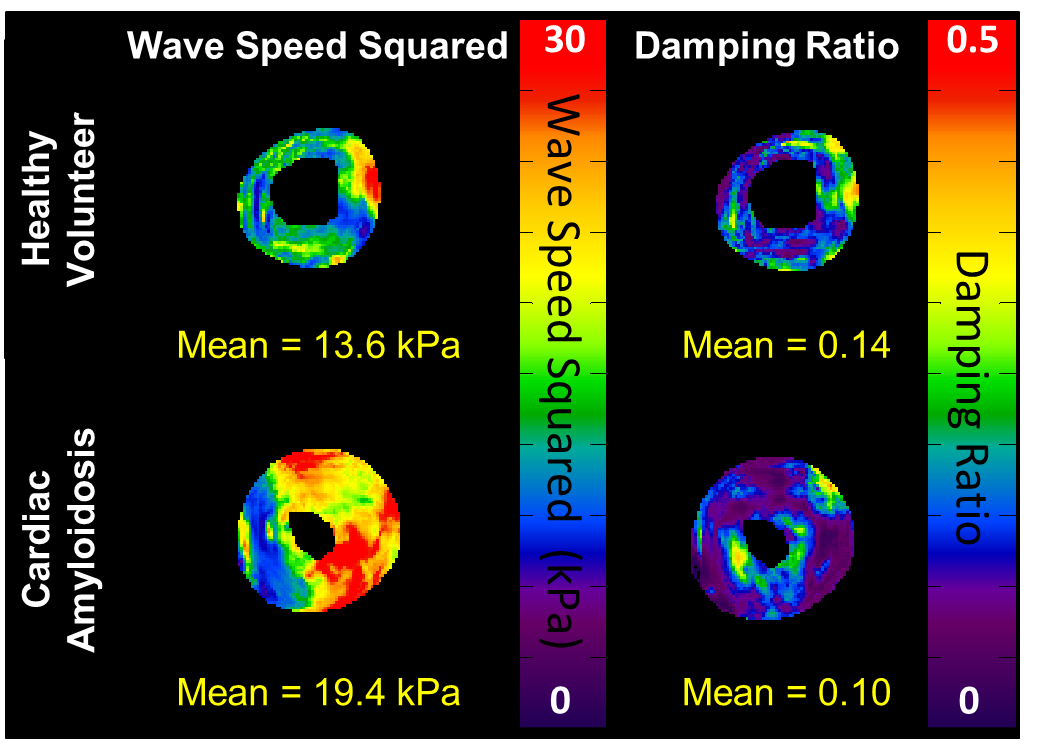
Figure
4: MRE stiffness and damping ratio maps in a 57-year-old male healthy volunteer
(top row) and a 54-year-old male patient with cardiac amyloidosis. The myocardial stiffness in the amyloidosis
patient is elevated, while the mean damping ratio is reduced across the left
ventricular volume.
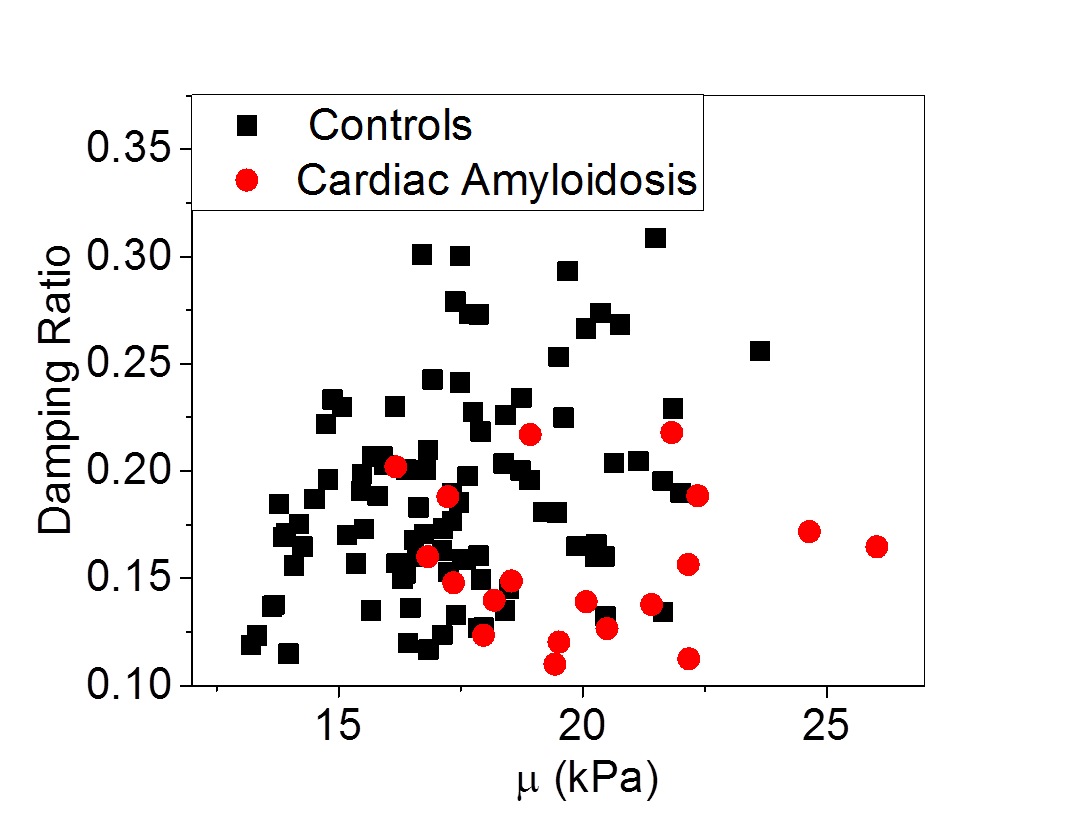
Figure 5: Plot of myocardial stiffness (µ) vs. damping
ratio for each subject. The damping
ratio and myocardial stiffness give complementary information, with the
potential to help differentiate patients with cardiac disease from healthy individuals.