1078
Feasibility of quantitative susceptibility mapping in the human placenta1Division of Diagnostic Imaging and Radiology, Children's National Medical Center, Washington, DC, United States, 2Division of Fetal and Transitional Medicine, Children's National Medical Center, Washington, DC, United States, 3Department of Pediatrics, George Washington University, Washington, DC, United States, 4Department of Radiology, George Washington University, Washington, DC, United States, 5Department of Obstetrics and Gynecology, George Washington University, Washington, DC, United States, 6Division of Neonatology, Children's National Medical Center, Washington, DC, United States
Synopsis
Quantitative susceptibility mapping (QSM) is an emerging tool for measuring magnetic susceptibility of tissue, which is used to identify hypoxia, hemorrhage, and calcifications. In this study we demonstrated the feasibility of performing QSM in the in-vivo human placenta. The measurement differences in R2* and susceptibility between 1.5 T and 3 T were consistent with our expectations and previous studies, and susceptibility was significantly reduced in response to maternal hyperoxia due to reduced deoxyhemoglobin. These results suggest that placental QSM may have the potential to assess placental function such as oxygenation.
INTRODUCTION
Quantitative susceptibility mapping (QSM) is an emerging imaging method for measuring magnetic susceptibility of tissue, and may have the potential to identify early evidence of hypoxia, hemorrhage, and calcifications in the placenta in vivo. In this study we demonstrate the feasibility of placental QSM by comparing measurements at 1.5 T and 3 T MRI and using maternal hyperoxia with 100% oxygen. We also present changes of susceptibility and R2* across gestational age (GA).METHODS
Forty-three healthy pregnant women were recruited for fetal MRI under a protocol approved by our institutional review board. We studied 18 and 25 pregnant women at 1.5 T and 3 T respectively, of which seven and one pregnant women were scanned twice on different days at 1.5 T and 3 T respectively. Image acquisition for QSM was performed using a 3D multi-echo RF-spoiled GRE sequence with flow compensation1. Common imaging parameters for 1.5 T and 3 T are FOV = 36-38 cm, matrix size of 320x128, 22-30 slices with slice thickness of 3 mm, and flip-angle = 20°. Other parameters include TR = 93 ms, 13 TEs ranging from 5 to 78 ms, and BW = ±31.25 kHz for 1.5 T, and TR = 55 ms, 12 TEs ranging from 4 to 50 ms, and BW = ±50 kHz for 3 T. Prospective respiratory triggering was performed using respiratory bellows, and an acquisition window of 30% was placed at end-expiration. For the outside of acquisition window, dummy acquisitions were performed to minimize perturbation of the transition and steady state of magnetization. Total scan time with SENSE (R=2) was 6-7 min for 1.5 T and 3-4 min for 3 T. To verify susceptibility changes with increased oxygenation, maternal hyperoxia was induced using 100% oxygen (15 L/min) in 15 subjects studied at 3 T. In these subjects QSM was performed twice, before and during oxygen administration. All scans were performed on GE MR450 1.5 T and MR750 3 T scanners using 8-ch and 32-ch cardiac coils, respectively. QSM reconstruction was performed using the approach of morphology-enabled dipole inversion (MEDI)2. R2* was also measured using the magnitude of GRE data, in order to confirm the validity of our data acquisition.RESULTS/ DISCUSSION
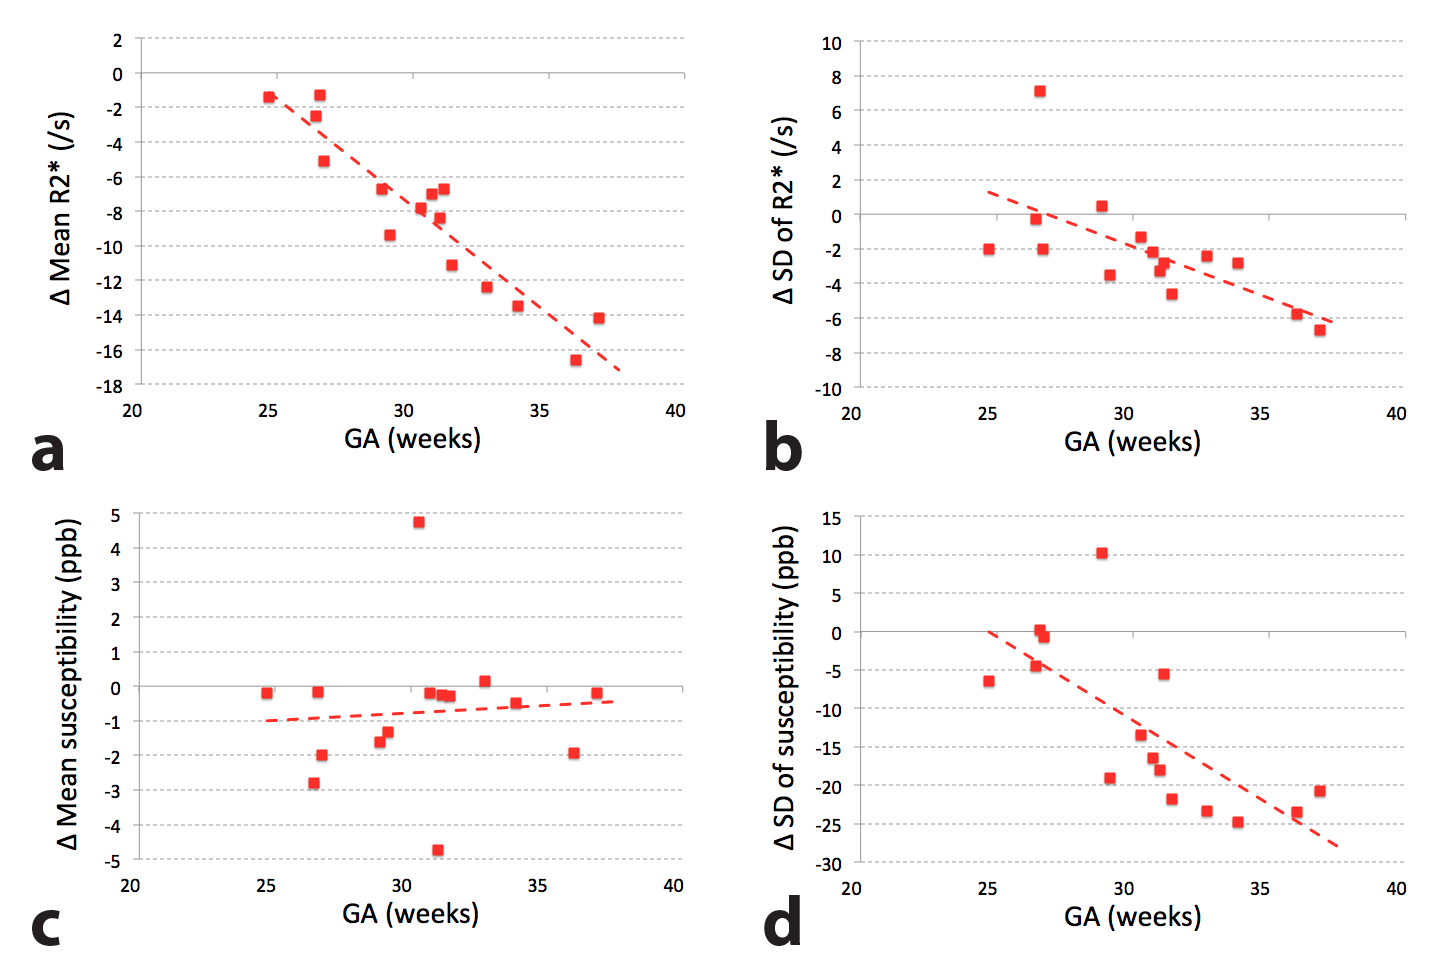
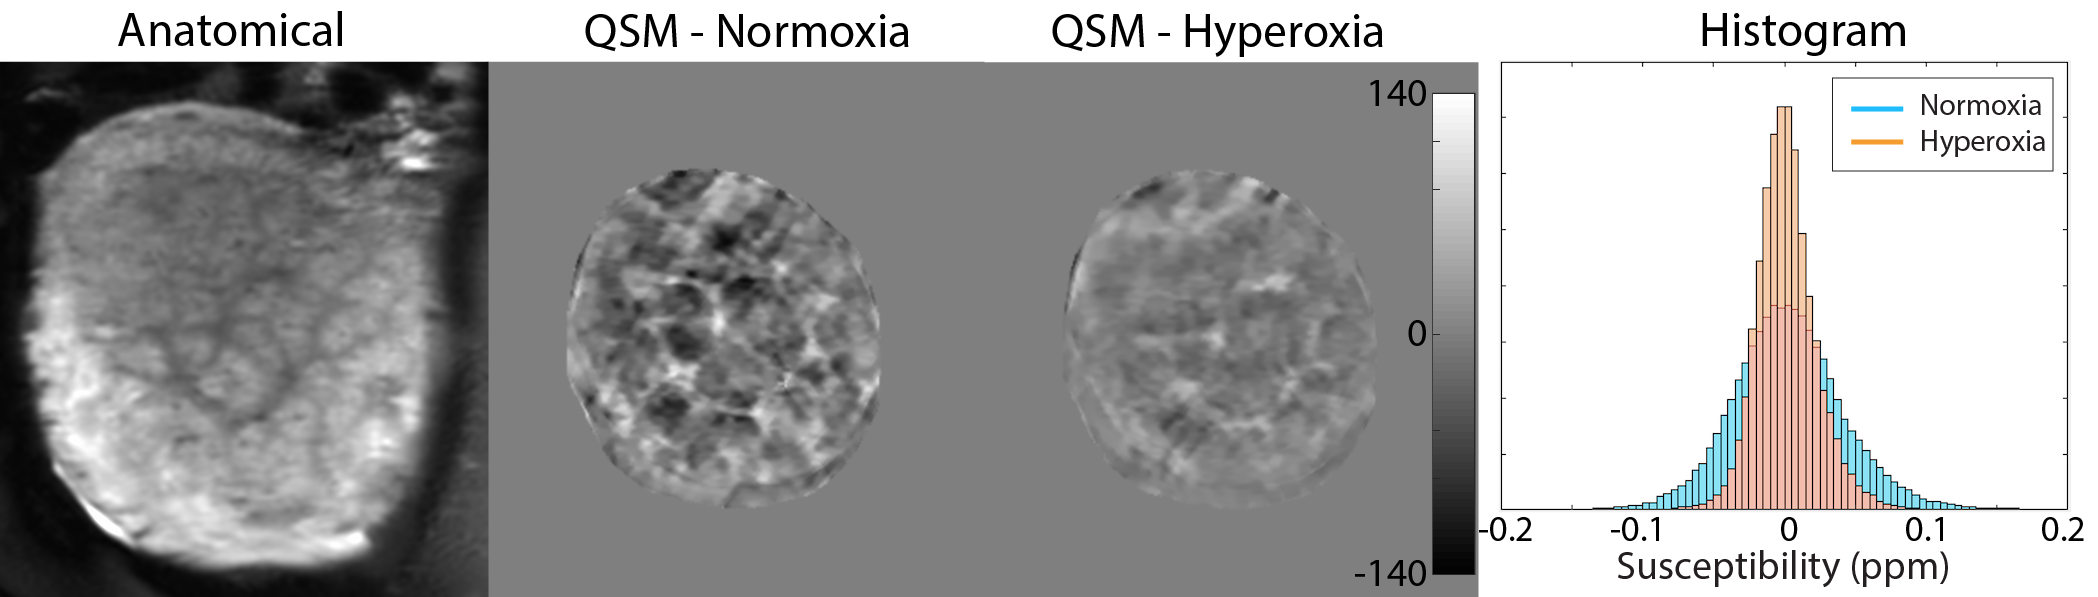
Three and four scans were discarded for 1.5 T and 3 T respectively due to severe motion or streaking artifacts. The remaining 22 scans were included in the analysis for each field strength. Figure 1 shows mean and standard deviation (SD) of R2* and susceptibilities within each subject as a function of GA. While R2* was higher at 3 T than 1.5 T (p<0.01 for both mean/SD), there was no significant difference in susceptibility between the two field strengths. This was an expected finding because R2* increases with increased off-resonance at higher field strengths but susceptibility (in unit of ppm or ppb) is a consistent measurement regardless of field strength. Also, while increased mean R2* with advancing GA in our data (p<0.01 for both 1.5 T/3 T) is consistent with a previous study3, we found that there was no correlation between mean susceptibility and GA. However, spatial variation of both R2* and susceptibility increased with advancing GA (p<0.01 for all), presumably due to increased hypoxia and calcifications of the placenta later in gestation. As shown in Figure 2, there was a strong correlation between SD of susceptibilities and mean R2* (p<0.01 for both 1.5 T/3 T) given that both highly positive and highly negative susceptibilities contribute to high R2*. Figure 3 shows the changes in R2* and susceptibility with maternal hyperoxia (i.e. hyperoxia – normoxia). Baseline susceptibility was significantly reduced with maternal hyperoxia (p=0.01), likely due to reduced deoxyhemoglobin4. Although change in mean susceptibility showed no correlation with GA, changes in mean/SD of R2* and SD of susceptibilities all showed significant correlation with advancing GA (p<0.01 for all). In Figure 4, reduced spatial variation of susceptibilities with maternal hyperoxia was well visualized whereas slight reduction in mean susceptibility was not visually obvious.CONCLUSION
We demonstrated the feasibility of performing QSM of the human placenta across the third trimester of pregnancy. The measurement differences in R2* and susceptibility between 1.5 T and 3 T were in keeping with previous studies. Susceptibility was significantly reduced in response to maternal hyperoxia due to the effect of reduced paramagnetic deoxyhemoglobin. These results suggest that placental QSM may be a useful tool to assess in-vivo placental oxygenation.Acknowledgements
R01 HL116585-01References
1. Zun Z, Limperopoulos C. Free-breathing 3D quantitative susceptibility and T2* mapping of the human pla-centa: Initial experience in healthy pregnancies. In Proceedings of the 26th Annual Meeting of ISMRM, Paris, France, 2018. Abstract 4696.
2. Liu J, Liu T, de Rochefort L, et al. Morphology enabled dipole inversion for quantitative susceptibility mapping using structural consistency between the magnitude image and the susceptibility map. Neuroimage 2012;59:2560–2568.
3. Sinding M, Peters DA, Frøkjaer JB, et al. Placental magnetic resonance imaging T2* measurements in normal pregnancies and in those complicated by fetal growth restriction. Ultrasound Obstet Gynecol. 2016;47:748-754.
4. Hsieh MC, Kuo LW, Huang YA, et al. Investigating hyperoxic effects in the rat brain using quantitative susceptibility mapping based on MRI phase. Magn Reson Med. 2017;77:592-602.
Figures