1075
A Longitudinal Multisite Study of Endogenous BOLD MRI In Human Pregnancies1Advanced Imaging Research Center, Oregon Health & Science University, Portland, OR, United States, 2Utah Center for Advanced Imaging Research, University of Utah, Salt Lake City, UT, United States, 3Division of Reproductive and Developmental Sciences, ONPRC, Portland, OR, United States, 4Department of Obstetrics & Gynecology, OHSU, Portland, OR, United States, 5Department of Obstetrics & Gynecology, University of Utah, Salt Lake City, UT, United States, 6Department of Radiology, University of Utah, Salt Lake City, UT, United States, 7Advanced Imaging Research Center, OHSU, Portland, OR, United States
Synopsis
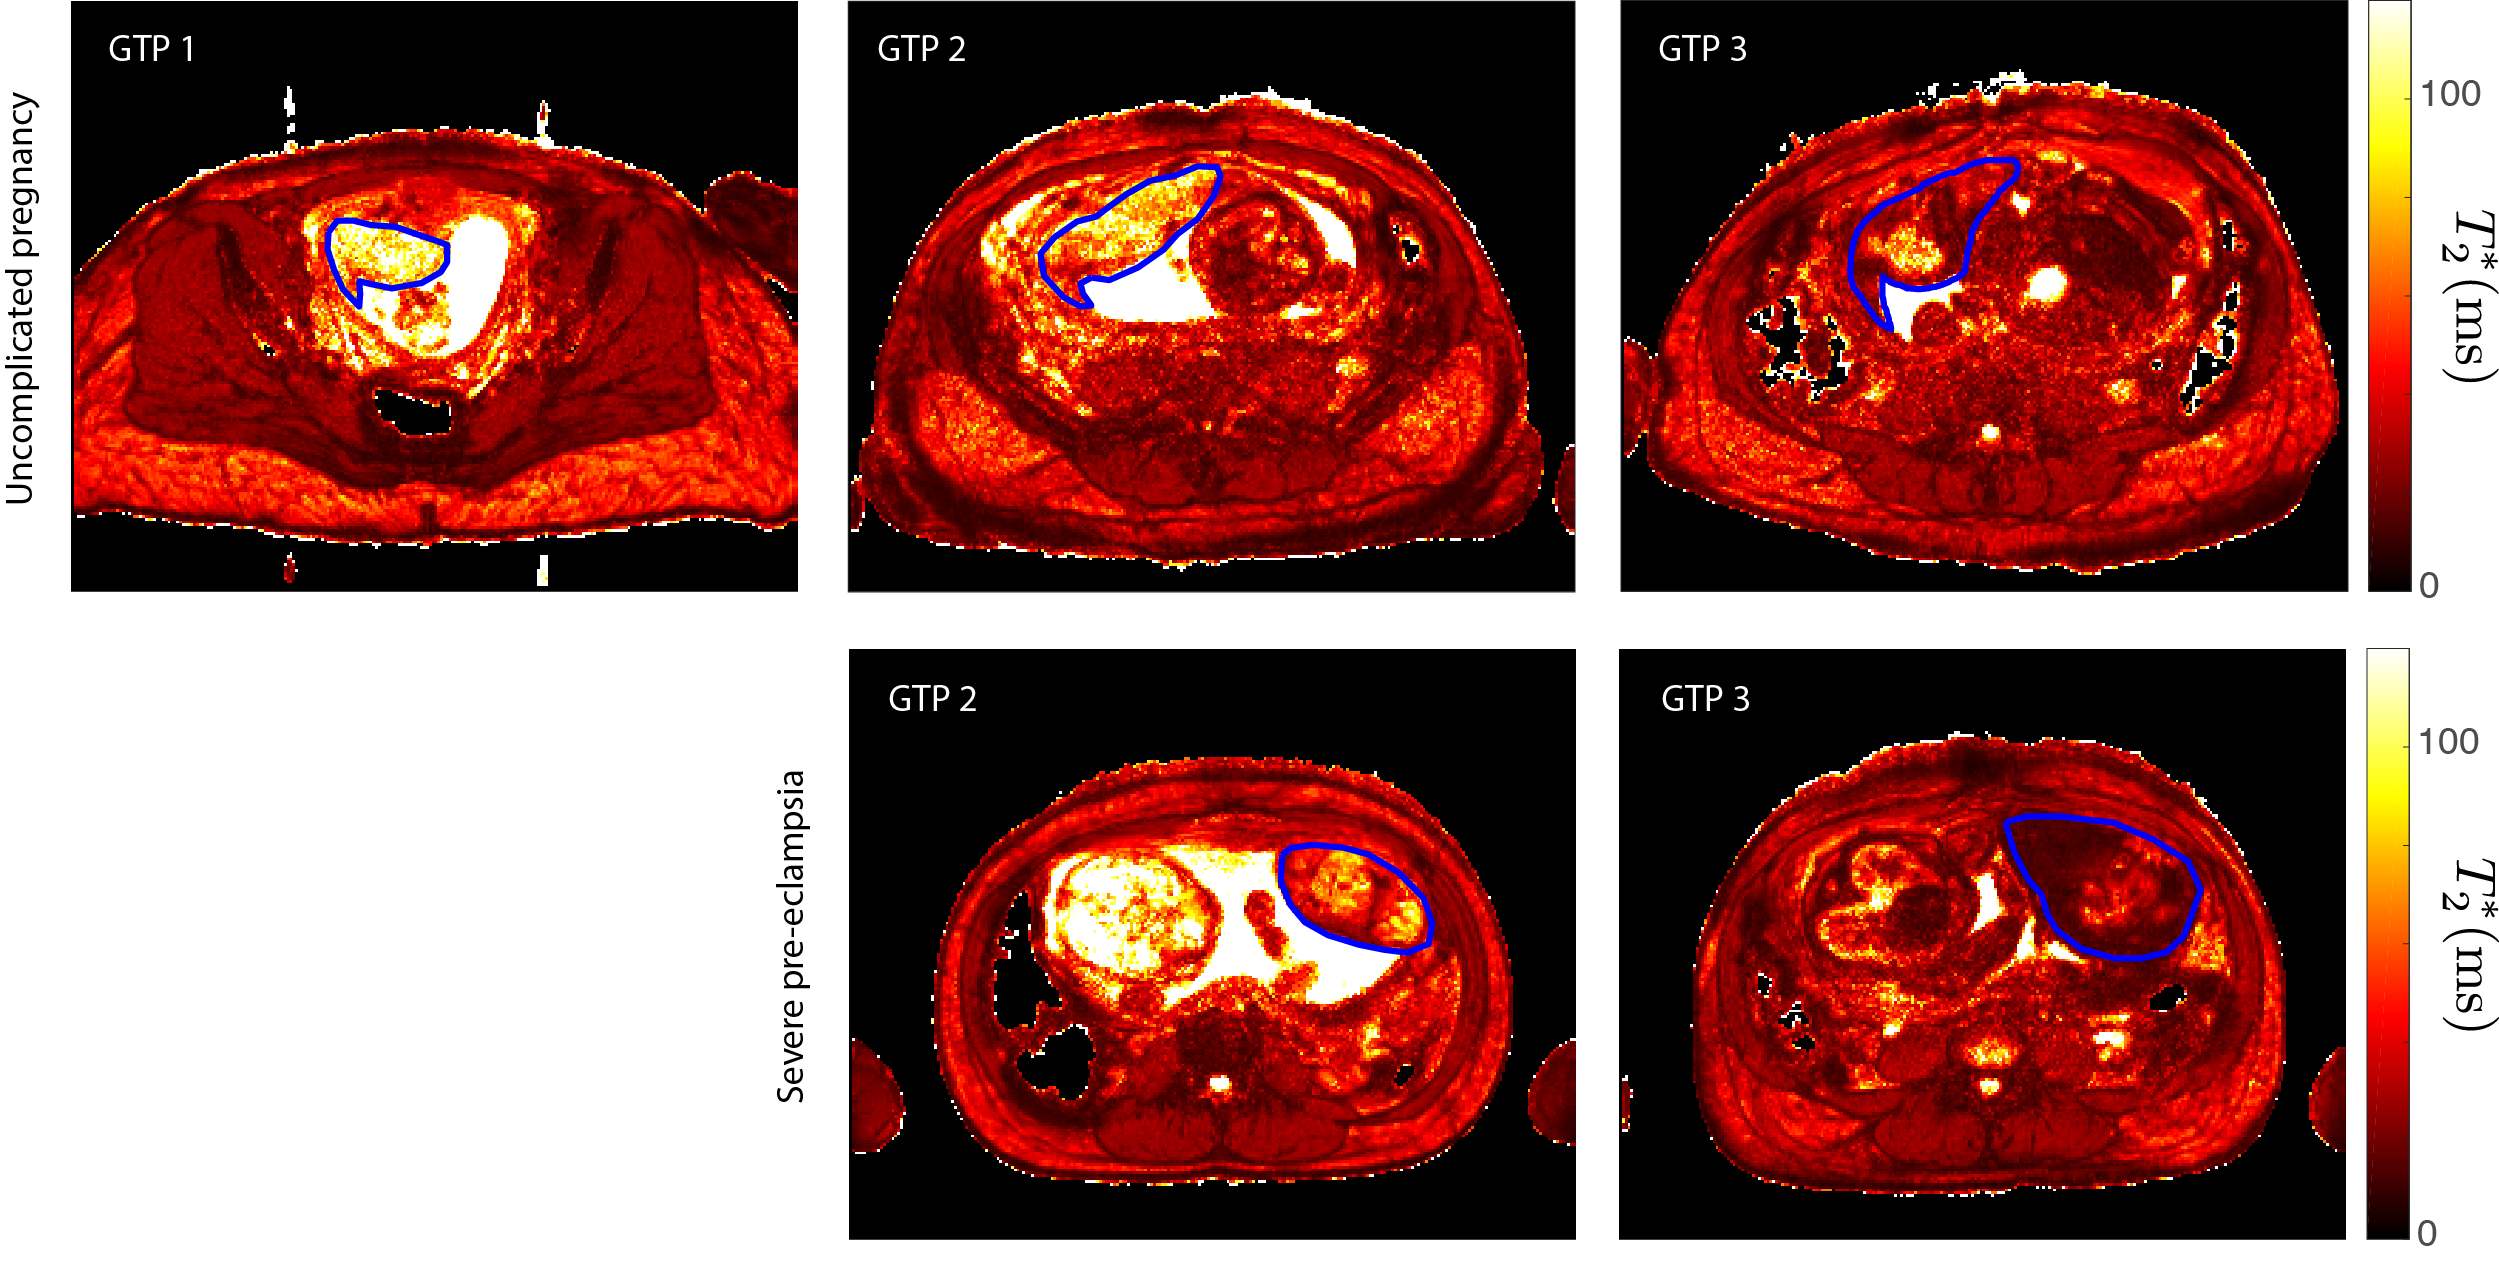
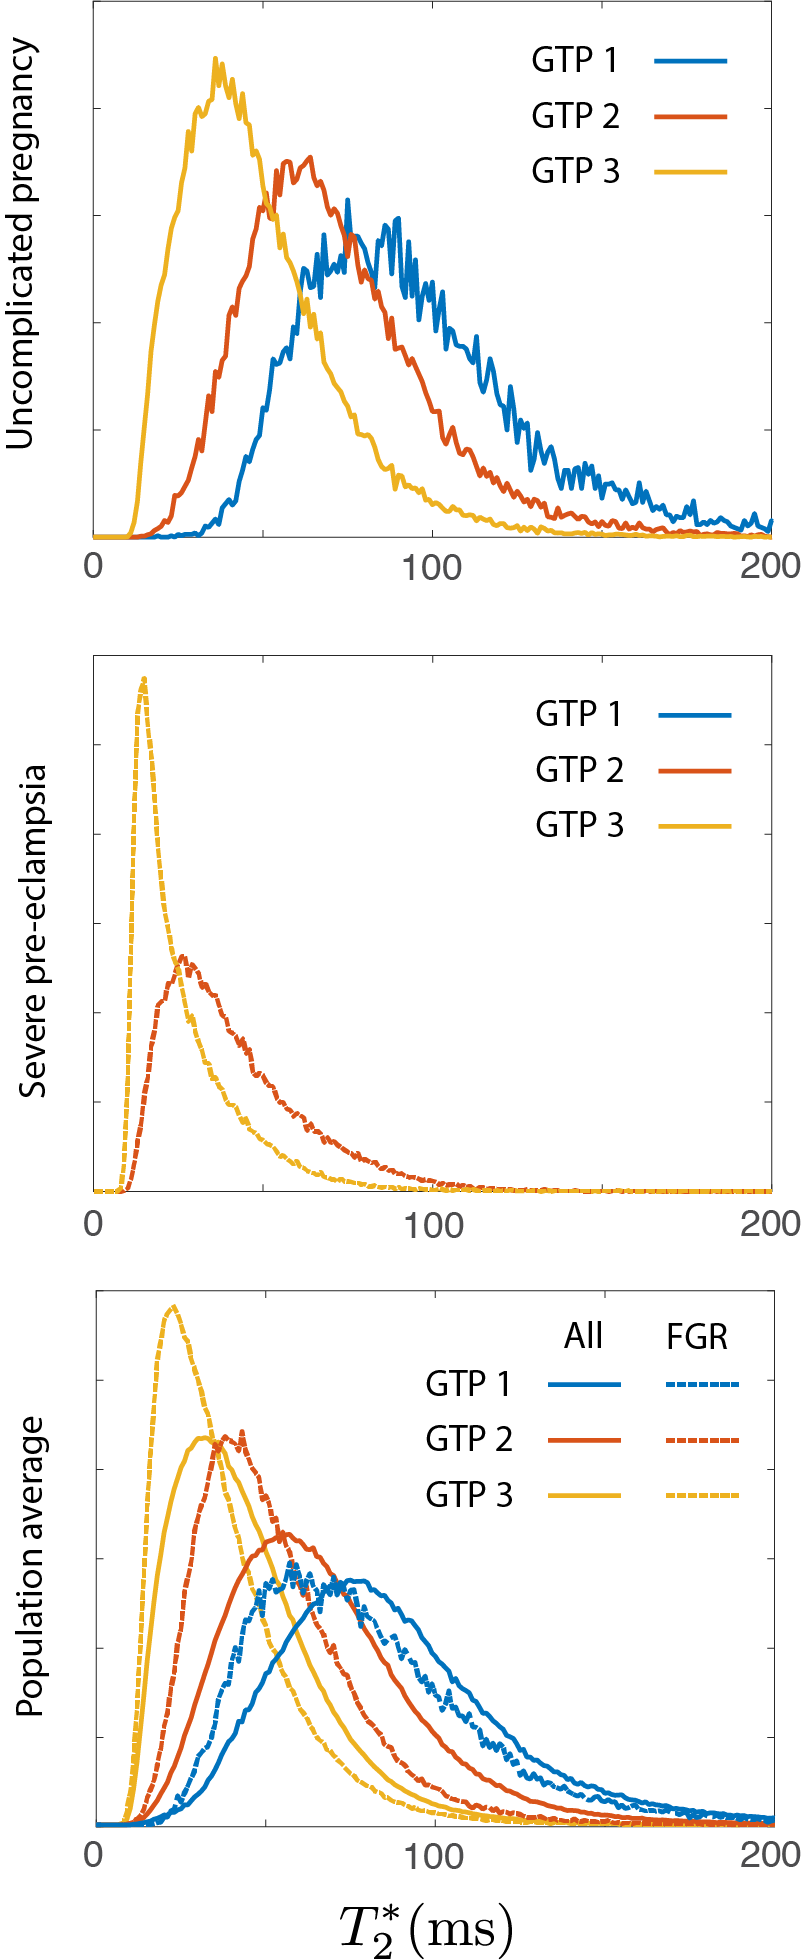
The spatial distribution of placental T2* determined via BOLD MRI has been shown to correlate with maternal blood flow and corresponding blood oxygen levels within individual placental lobules. Here, we report data from a longitudinal multisite study aimed at assessing placental T2* across multiple gestational time points in human pregnancy and correlating it with pregnancy outcomes.
Purpose
Recent studies of placental BOLD MRI signal in both primates and humans have elucidated the relationship between the spatial distribution of T2* and corresponding blood oxygen levels within individual placental lobules [1-5]. Here, we report preliminary results from an ongoing longitudinal multisite study aimed at assessing placental T2* across multiple gestational time points in human pregnancy and correlating it with pregnancy outcomes.Methods
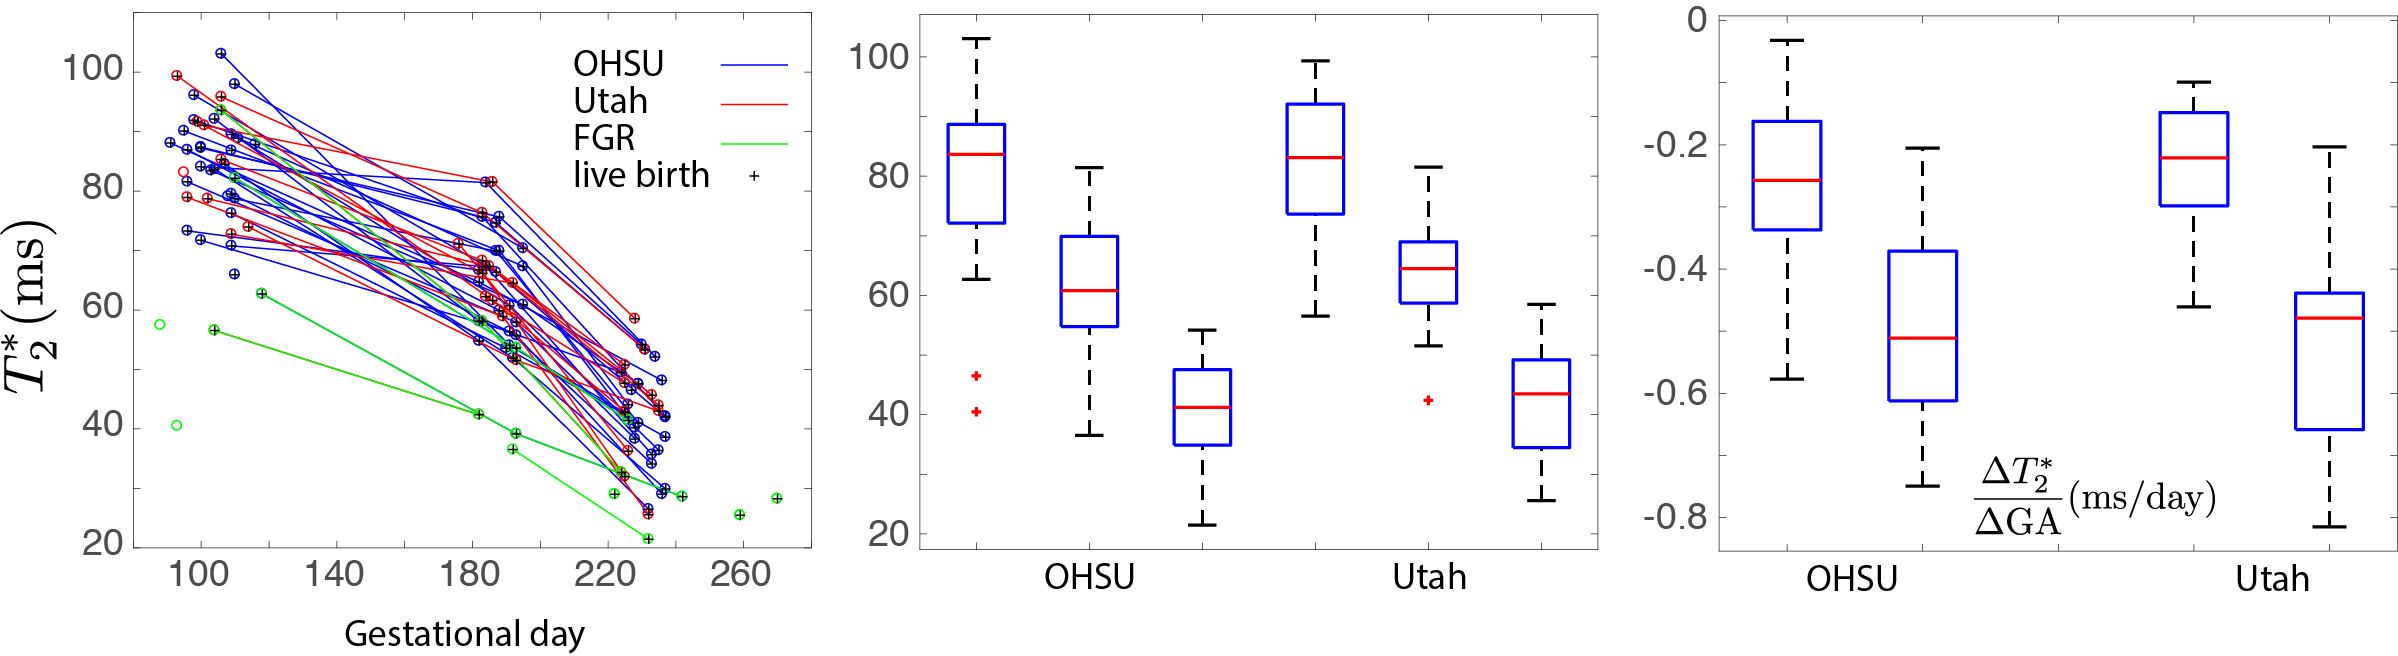
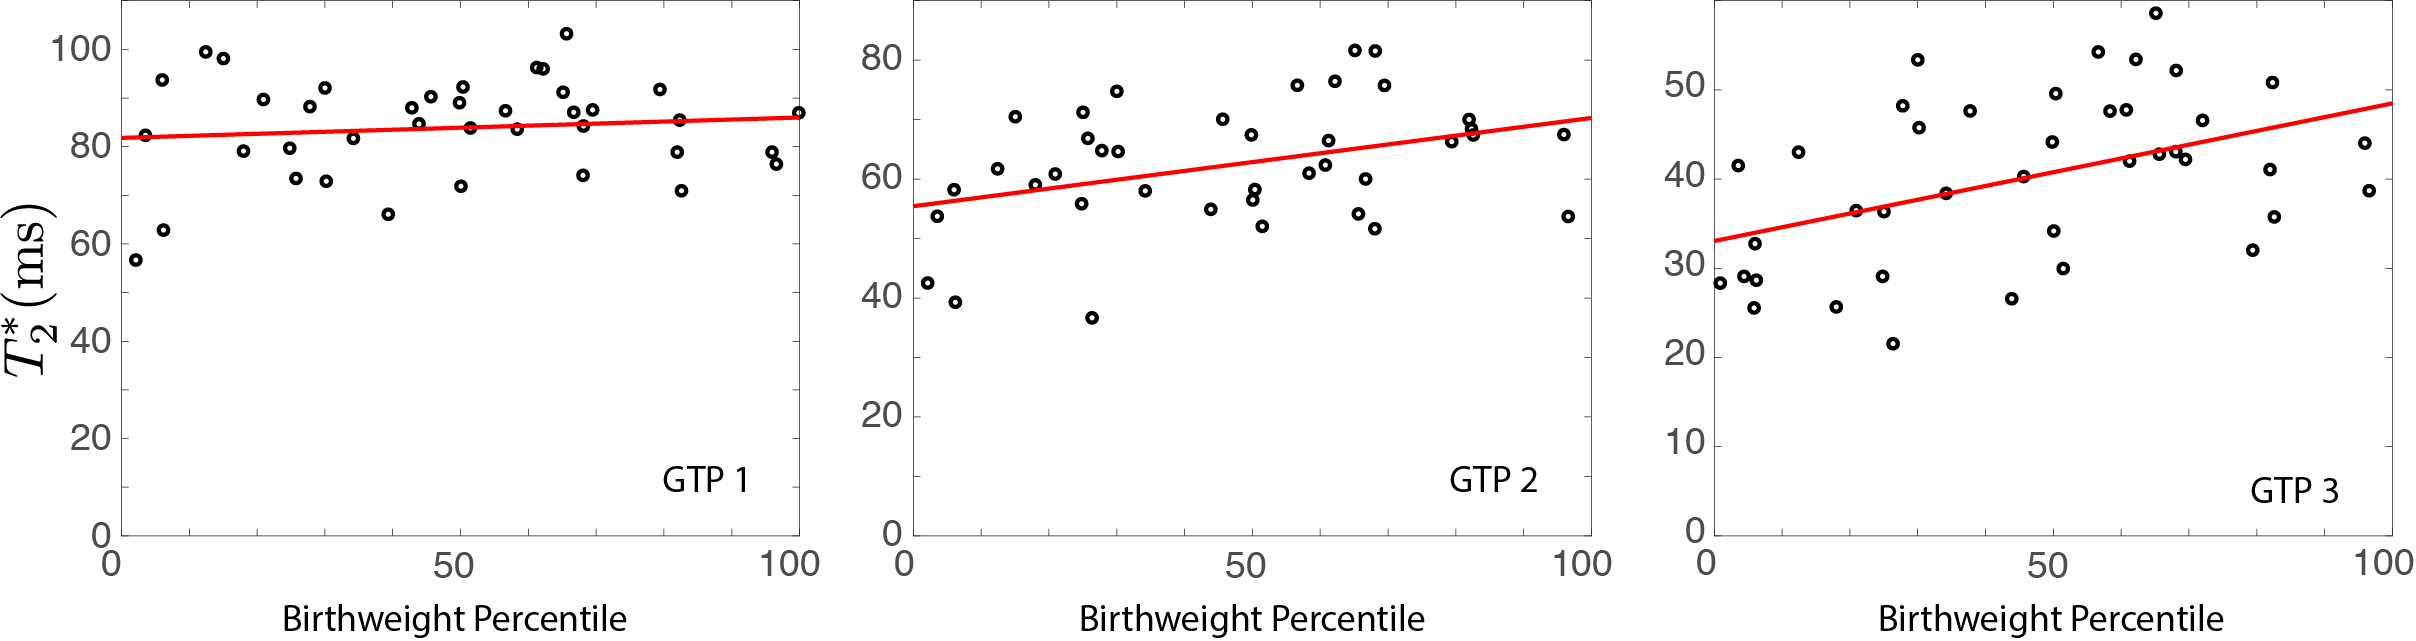
52 pregnant human volunteers were recruited at two research sites (Oregon Health & Science University, Portland, OR, 37 patients, and University of Utah, Salt Lake City, UT, 15 patients) to undergo three sequential MRI studies in defined windows of gestational age (GA, time point 1 between 12 and 16 weeks, time point 2 between 24 and 28 weeks, and time point 3, between 32 and 36 weeks). Scanners at both sites were Siemens 3T Prisma instruments running identical imaging protocols. 32 patients were scanned at all three time points, 7 at two of the three time points, and 13 at a single time point. Following localization of the uterus and placenta and anatomic imaging in three orthogonal orientations with a T2-HASTE protocol, multiecho gradient echo (MEGE, 6 in-phase echo times between 4.92 and 49.2ms, 1.5x1.5x3mm voxels) data were acquired during sequential breath holding in a transverse orientation, with slices covering the entire uterus. Quantitative values of T2* were computed by weighted log-linear regression to measured MEGE signal amplitudes [1]. ROIs encompassing the placenta were drawn on each slice of the resulting T2* maps, with visibly motion-corrupted slices dropped from further analysis. Neonatal birthweight percentiles were computed for gestational age at birth using data from [6], and fetal pregnancy complications were tracked antenatally through delivery.Results
A consistent trend toward decreasing placental T2* with gestational age was clear in all patient data (Figs. 1-3). T2* values at all three time points were statistically-indistinguishable across the two sites, as were values of dT2*/dGA estimated from differences between sequential single-patient measurements (Fig. 3). Low placental T2* values, particularly in early- and mid-gestation were strongly associated with adverse pregnancy outcomes, particularly intrauterine growth restriction (IUGR), low birthweight, maternal hypertension, and pre-eclampsia (Fig. 1-2). We observe statistically-significant (p<0.05) positive correlation between birthweight percentile and placental T2* at both mid- and late-gestational time points, but none at the early gestational time point (Fig 4).Conclusions
Quantification of maternal placental oxygen deliveryvia BOLD T2* mapping is a clinically-feasible method for characterizing placental health in human pregnancies. Data was found to be statistically consistent across sites, demonstrating that these methods have translational relevance. Placental T2* is a marker for fetal growth, and is sensitive to and predictive of poor pregnancy outcomes.Acknowledgements
NIH U01 HD087182References
[1] Schabel MC, Roberts VHJ, Lo JO, Platt S, Grant KA, Frias AE, Kroenke CD.Magn Reson Med. 2016 Nov;76(5):1551-1562. doi: 10.1002/mrm.26052. Epub 2015 Nov 24.PMID: 26599502
[2] Frias AE, Schabel MC, Roberts VH, Tudorica A, Grigsby PL, Oh KY, Kroenke CD.Magn Reson Med. 2015 Apr;73(4):1570-8. doi: 10.1002/mrm.25264. Epub 2014 Apr 18.PMID: 24753177
[3] Sinding M, Peters DA, Frøkjær JB, Christiansen OB, Petersen A, Uldbjerg N, Sørensen A.Placenta. 2017 Jan;49:48-54. doi: 10.1016/j.placenta.2016.11.009. Epub 2016 Nov 22.PMID: 28012454
[4] Melbourne A, Aughwane R, Sokolska M, Owen D, Kendall G, Flouri D, Bainbridge A, Atkinson D, Deprest J, Vercauteren T, David A, Ourselin S.Magn Reson Med. 2018 Sep 21. doi: 10.1002/mrm.27406. [Epub ahead of print]PMID: 30239036
[5] Hutter J, Slator PJ, Jackson L, Gomes ADS, Ho A, Story L, O'Muircheartaigh J, Teixeira RPAG, Chappell LC, Alexander DC, Rutherford MA, Hajnal JV.Magn Reson Med. 2018 Sep 21. doi: 10.1002/mrm.27447. [Epub ahead of print]PMID: 30242899
[6] Oken E, Kleinman KP, Rich-Edwards J, Gillman MW.BMC Pediatr. 2003 Jul 8;3:6. Epub 2003 Jul 8.PMID: 12848901
Figures