1068
Towards a Fitting Model of Macromolecular Spectra: Amino Acids1Biological Cybernetics, Max Planck Institute, Tübingen, Germany, 2Faculty of Science, University of Tübingen, Tübingen, Germany
Synopsis
Broad signals underlying in vivo 1H MRS spectra are referred to in
Introduction
Broad signals underlying in vivo 1H MRS spectra are referred to in literature as macromolecules. Most work refers to them as resonances of amino acids (AA) in peptides and proteins1. Behar et al.2,3 had assigned them to AAs upon a comparison of metabolite nulled in vivo spectra with NMR spectra of brain extracts from both rat2 and human3 brain, verifying cross peaks in COSY spectra, and determining J-coupling constants from J-resolved spectra.
Proteins are composed of AAs chains. The three-dimensional structure of proteins and the sequences of AAs in the respective protein chains create slightly different chemical shifts for the same spin system of the composing AAs. The chemical shifts of the AA resonances have been very well documented and stored in the Biological Magnetic Resonance Data Bank (BMRB)4.
Proteins have different lengths and hence different molecular weights. The presence of the peaks assigned to AAs in the brain has been verified for molecular weights “between 25 kDa to >100 kDa” cytosolic macromolecule fractions2.
Recent studies of human brain spectra at ultra-high fields allowed the individual quantification of macromolecular resonances5,6.
This work aims to create a spectral fitting model for in vivo human brain macromolecules using published chemical shifts of amino acids from the BMRB4.
Methods
A pair of 1H-MRS metabolite-cycled (MC) and MC Double-inversion-recovery (DIR) semi-LASER spectra were acquired in the occipital lobe of the human brain at 9.4 T in 11 volunteers (TR 10 s / TE 24 ms / TInv1 2360 ms / TInv2 625 ms / NEX = 64). Spectra were preprocessed and averaged across subjects.
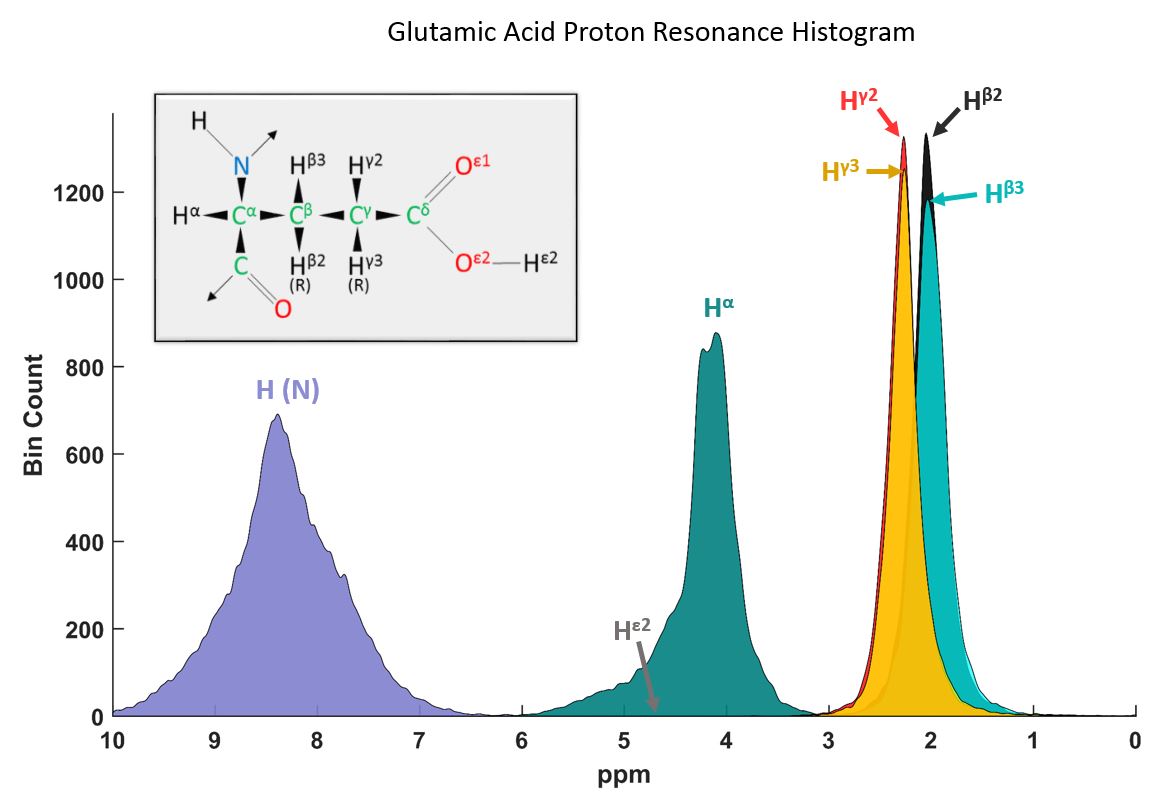
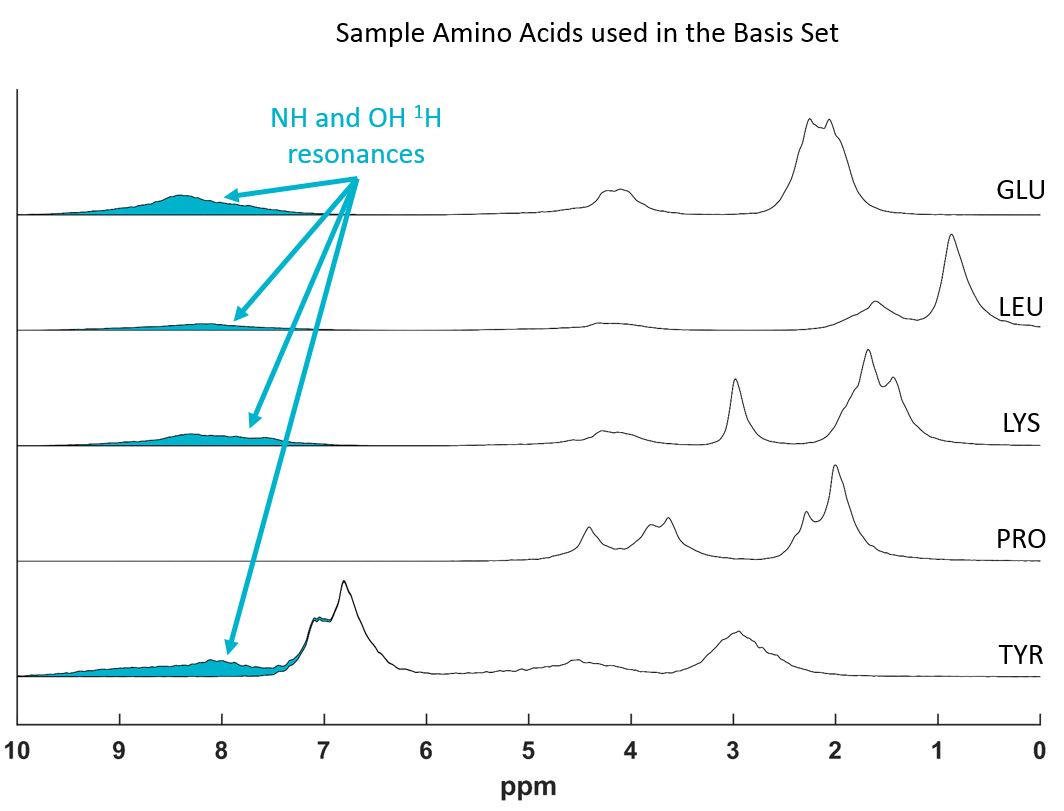
Chemical shift histograms were created for all 20 amino acids using the reported proton resonances in BMRB4 (several ten-thousand resonances contribute to a single proton resonance chemical shift histogram)(Fig.1). Schanda P.7 reports rapidly exchanging peaks of “oxygen- and nitrogen-bound sidechain protons”. Hence two basis sets were created fitting a spline to the summed histograms: 1. including all resonances, 2. all resonances except the NH and OH proton resonances of the amino acids (Fig. 2).
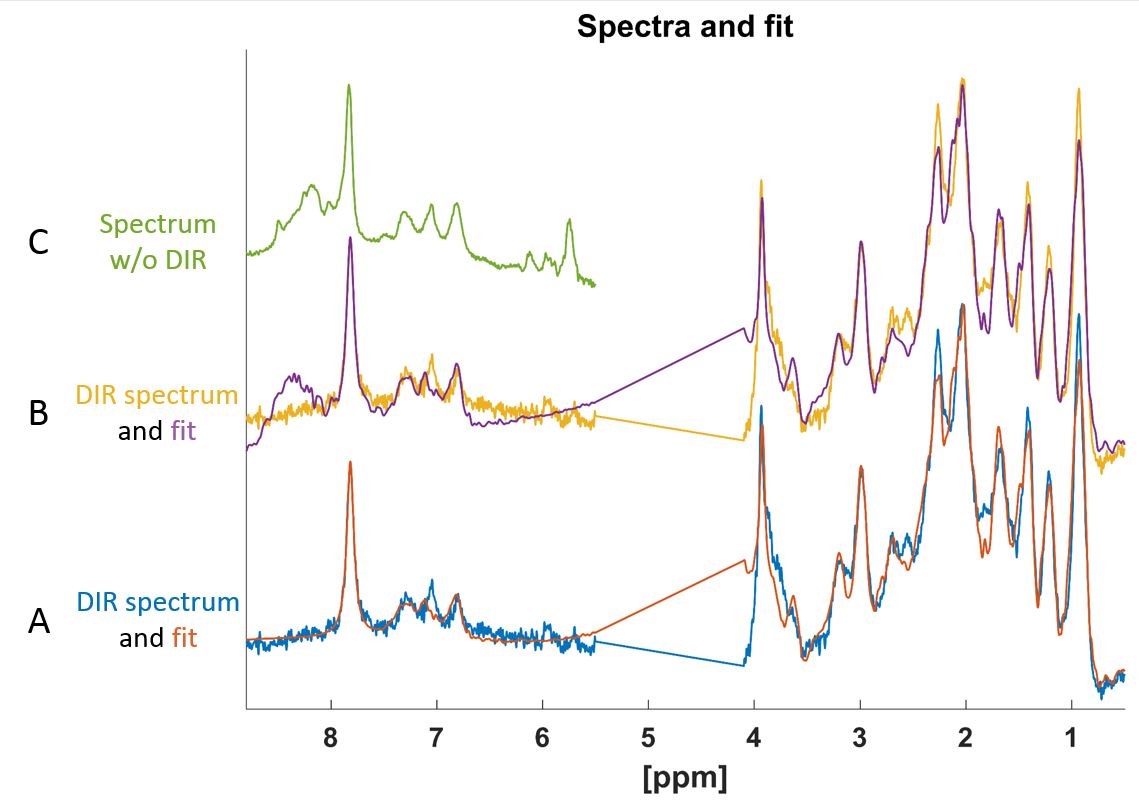
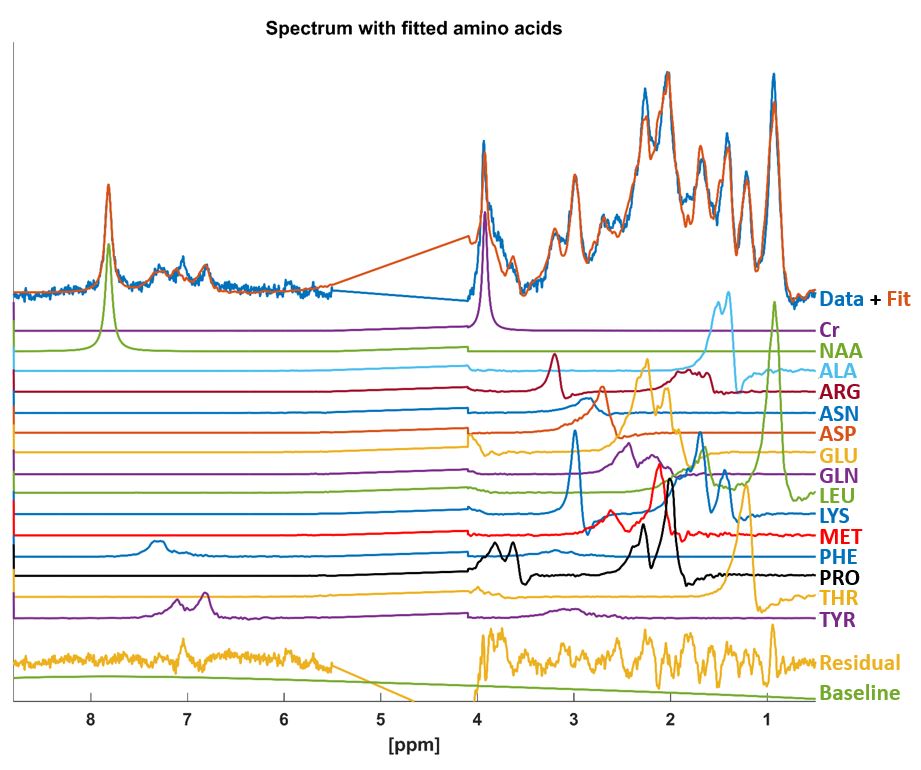
The MC-DIR-semi-LASER spectra were fit using LCModel-v6.38 with the aforementioned basis sets containing 20 amino acids and residual singlets for creatine (Cr) and N-Acetyl-Aspartate (NAA) at 3.92 ppm and 7.82 ppm respectively (Fig. 3,4) with a flat baseline.
Results
The across subjects summed spectra showed an SNR of 102 for Cr. Downfield spectra of MC-DIR-semi-LASER downfield spectra demonstrate complete saturation of resonance lines with chemical shifts of 8.0 ppm or more, which are detectable in MC-semi-LASER without DIR.
The metabolite nulled macromolecular spectrum shows a decent spectral fit when using amino acids as basis set (Fig. 3B). The spectral fit is significantly better if the NH and OH protons are not included. Visually the overfit of the amino acids above 8.0 ppm (Fig.3B) match the MC-semi-LASER spectrum (without double inversion) (Fig.3C).
Discussion & Conclusion
This work attempts for the first time to create a fitting model for in vivo brain macromolecular spectra using published chemical shift histograms of amino acid resonances.
The fast exchange with water of peaks with chemical shifts above 8.0 ppm has been reported in previous in vivo studies8-10. These could correspond to amide resonances of the amino acids7 (Fig.2), hence the improved fit (Fig. 3), when omitting these resonances.
The contributions of the different amino acids, contributing to the macromolecular resonances are in accordance with assignment by Behar et al.2,3 for example: alanine (ALA), leucine (LEU), glutamic acid (GLU), glutamine (GLN), lysine (LYS), methionine (MET); or to previously not assigned but visible cross peaks and resonances of proline (PRO) also seen in the same study.
There is a strong spectral overlap between GLU and GLN and hence per subject fits weighted these contributions differently. Similarly, the overlaps between, LEU, isoleucine, and valine are neither clearly distinguishable, the main contributions being assigned to LEU for most cases.
The spatial distributions in the MRSI fit by Povazan et al.6 are also well-mapped with this fitting model. Macromolecular peaks at 2.04, 2.26, 3.77 ppm, being more dominant in gray matter (GM), are assigned by this model to coupled GLU, GLN, and PRO peaks. Mostly homogeneous distribution of peaks at 1.43, 1.67 and 2.99 ppm are fit with ALA and LYS. The peak at 3.2 ppm with a higher white matter content is fit in our model with arginine, which has minor contributions at 1.9ppm.
The fitting model needs to be improved to account for chemical shift changes with pH and temperature of the AAs11, and to exclude paramagnetic AAs. The lineshape distortions created by LCModel should be eliminated using another spectral fitting software. Because of these necessary improvements and missing cross-validations, quantification results are not reported in this study.
Acknowledgements
For the funding by the Horizon 2020/ CDS-QUAMRI grant.References
1. Cudalbu C, Mlynárik V, Gruetter R. Handling macromolecule signals in the quantification of the neurochemical profile. Journal of Alzheimer's Disease 2012;31:S101-S115.
2. Behar KL, Ogino T. Characterization of macromolecule resonances in the 1H NMR spectrum of rat brain. Magnetic resonance in medicine 1993;30:38-44.
3. Behar KL, Rothman DL, Spencer DD, Petroff OA. Analysis of macromolecule resonances in 1H NMR spectra of human brain. Magnetic Resonance in Medicine 1994;32:294-302.
4. Ulrich EL, Akutsu H, Doreleijers JF, Harano Y, Ioannidis YE, Lin J, Livny M, Mading S, Maziuk D, Miller Z. BioMagResBank. Nucleic acids research 2007;36:D402-D408.
5. Giapitzakis IA, Avdievich N, Henning A. Characterization of macromolecular baseline of human brain using metabolite cycled semi‐LASER at 9.4 T. Magnetic resonance in medicine 2018;80:462-473.
6. Považan M, Strasser B, Hangel G, Heckova E, Gruber S, Trattnig S, Bogner W. Simultaneous mapping of metabolites and individual macromolecular components via ultra‐short acquisition delay 1H MRSI in the brain at 7T. Magnetic resonance in medicine 2018;79:1231-1240.
7. Schanda P. Fast-pulsing longitudinal relaxation optimized techniques: enriching the toolbox of fast biomolecular NMR spectroscopy. Progress in Nuclear Magnetic Resonance Spectroscopy 2009;55:238-265.
8. Fichtner ND, Giapitzakis IA, Avdievich N, Mekle R, Zaldivar D, Henning A, Kreis R. In vivo characterization of the downfield part of 1H MR spectra of human brain at 9.4 T: Magnetization exchange with water and relation to conventionally determined metabolite content. Magnetic Resonance in Medicine 2017. doi.
9. MacMillan EL, Chong DG, Dreher W, Henning A, Boesch C, Kreis R. Magnetization exchange with water and T1 relaxation of the downfield resonances in human brain spectra at 3.0 T. Magnetic resonance in medicine 2011;65:1239-1246.
10. de Graaf RA, Behar KL. Detection of cerebral NAD+ by in vivo 1H NMR spectroscopy. NMR in biomedicine 2014;27:802-809.
11. Platzer G, Okon M, McIntosh LP. pH-dependent random coil 1 H, 13 C, and 15 N chemical shifts of the ionizable amino acids: a guide for protein pK a measurements. Journal of biomolecular NMR 2014;60:109-129.
Figures