1067
Functional Magnetic Resonance Spectroscopy in the mouse brain1Champalimaud Neuroscience Programme, Champalimaud Centre for the Unknown, Lisbon PT, Portugal
Synopsis
Functional magnetic resonance spectroscopy (fMRS) can provide insights on brain metabolism under activation, as has already been shown in humans. Assessing fMRS in mice would open interesting perspectives for understanding neural activity given mouse transgenics. We report preliminary encouraging results of fMRS in the mouse superior colliculus, during visual stimulation at 9.4 T (using a cryocoil for reception). Time courses of different metabolites concentrations notably reveal metabolite signal modulations during activation.
Introduction
Functional magnetic resonance spectroscopy (fMRS) can potentially provide insight into brain activation through exploration of metabolic processes involved in neurotransmission. While human fMRS reports are increasing1, fMRS in rodents remains quite rare likely due to the small voxels involved. Studies on rats under sustained stimulation have been previously performed2,3; however, given the amount genetically engineered mouse models available, fMRS in mice would be of great interest and, to our knowledge, has not been achieved yet. Here we present the first fMRS measurements in the mouse brain upon a relatively short visual stimulation.Methods
All animal experiments were preapproved by the institutional and national authorities and carried out according to European Directive 2010/63.
Animal preparation. Anesthesia in mice (N=7 C57Bl6 females, 3-4 months old) were induced using 5% isoflurane in a 28% O2/air mixture. The percentage of isoflurane was progressively decreased during animal preparation. The anesthesia regime was then switched to a mix of isoflurane (0.5%) and subcutaneous medetomidine infusion4 (bolus: 0.4mg/ml/kg, constant infusion: 0.8mg/ml/kg). Temperature (maintained at 36±0.5ºC) and respiration rate remained stable during the session.
fMRI and fMRS acquisition. Data were acquired using a 9.4 T Bruker BioSpec scanner equipped with a volume quadrature resonator for transmission and a 4-element array cryoprobe for reception. Fig. 1 presents the full experimental procedure. To ensure robust activation in the superior colliculus (SC) from the beginning to the end of the experiment, Blood Oxygenation Level Dependent (BOLD) fMRI maps were acquired before and after fMRS acquisitions (Fig. 1), using a gradient echo EPI (TR/TE=1000/12ms), resolution 0.145x0.145x0.500mm3). These fMRI data were analyzed using custom code written in Python and Matlab® using SPM.
MRS spectra were acquired in a 2.3x1.7x1.7mm3 voxel positioned around superior colliculus, using a LASER5 sequence (TR/TE=1500/28ms; SLR6 excitation pulse bandwidth, 8000Hz; HS4 adiabatic refocusing pulses’ bandwidth, 10000Hz; acquisition bandwidth, 4000Hz; spectral resolution, 1.67Hz/pt). OVS was performed prior to excitation, and the phase-cycle was reduced to 4 steps for time resolution. An optimized CHESS7 module achieved water suppression and the water residual was removed in post-processing8. A macromolecule baseline was acquired for each mouse, by applying a double inversion (TI1/TI2=2200/700ms) prior to LASER localization (Fig. 1). Spectra were individually rephased, eddy-current corrected in Matlab and quantified with LCModel9. The averaged macromolecular spectrum was included in the basis set.
Non-water suppressed spectra using otherwise identical parameters were also acquired upon stimulation to ensure a consistent BOLD effect inside the MRS voxel (Fig. 1).
The stimulation paradigm is described in Fig.1. LEDs (wavelength=470nm, intensity=0.8W/m2) positioned bilaterally near the eyes delivered flashing light at 4Hz (15ms pulse width). Stimulation paradigms were equal for functional imaging and functional spectroscopy, alternating 48s of rest and 24s (ACTIVATION block, Fig. 1). Since metabolic responses could be slow, this block was immediately followed by a RECOVERY block (Fig. 1), where spectra were acquired without stimulation. For fMRS, this ACTIVATION-RECOVERY block was repeated 5 times per animal. Time courses are displayed normalized to the mean of the (flat) recovery period.
Results
fMRI maps revealed robust activation in SC across the entire experiment and the non-water-suppressed MRS showed robust activation patterns as well, suggesting good voxel localization (Fig. 1). Chemical Shift displacements were less than 0.25mm for NAA.
Figs. 2A and 2B show the averaging sliding window and a representative spectrum with LCModel spectral decomposition respectively. The sliding window design assisted in keeping CRLB<5% for [Glu].
Fig. 2C shows normalized metabolite concentration time courses, and Fig. 3 presents normalized metabolite concentration distributions, revealing higher [Glu] and [Ins], as well as [tCr] and [tCho] during the ACTIVATION block. Since quantification of GABA, glucose (Glc) and glutamine (Gln) were not reliable on a single animal, spectra were summed across all animals at each time point to enhance the spectral quality (Fig. 3A) prior to LCModel fit. [Gln] and [GABA] appear slightly higher during ACTIVATION, while [Glc] progressively decreases and recovers after the last stimulation (Fig. 3B), consistent with previous studies3,10.
Discussion
This first fMRS study in the mouse focused on low frequency changes in metabolite concentrations. Surprisingly, [Ins] increased upon stimulation. Ins is described as a preferentially astrocytic metabolite, especially in the mouse11 and its modulation may indicate astrocytic modulations of neural activity12. As previously reported1,2,3,10, [Glu] increased during ACTIVATION while [Glc] decreases overall. However, the temporal resolution of our dataset points toward large [Glu] fluctuations during the paradigm. Assessing these higher-frequency dynamics will require further experiments with longer rest periods.Conclusion
fMRS was successfully performed in mice. Although further refinements and analyses are required, our work opens promising perspectives to fMRS applications in the mouse.Acknowledgements
This study was supported through funding from European Research Council (ERC) under the European Union’s Horizon 2020 research and innovation programme (Starting Grant, agreement No. 679058). TSD acknowledges funding from the Fundação da Ciência e Tecnologia (FCT), Portugal (SFRH/BD/124637/2016). The authors would also like to thank Dr Rui Simões for fruitful discussions.References
[1] Mullins, P. G. (2018). Towards a theory of functional magnetic resonance spectroscopy (fMRS): A meta‐analysis and discussion of using MRS to measure changes in neurotransmitters in real time. Scandinavian Journal of Psychology, 59, 91–103.
[2] Just et al. (2013). Characterization of sustained BOLD activation in the rat barrel cortex and neurochemical consequences. NeuroImage 74, 343-351.
[3] Sonnay et al. (2017). Astrocytic and neuronal oxidative metabolism are coupled to the rate of glutamate–glutamine cycle in the tree shrew visual cortex. Glia 66, 3 477-491
[4] Adamczak et al. (2010) High field BOLD response to forepaw stimulation in the mouse. NeuroImage 51, 2 704-712.
[5] Garwood et DelaBarre (2001). The return of the frequency sweep: designing adiabatic pulses for contemporary NMR. J Magn Res 153, 2 155-177.
[6] Pauly et al. (1991). Parameter relations for the Shinnar-Le Roux selective excitation pulse design algorithm (NMR imaging). IEEE Transactions on Medical Imaging, 10, 1
[7] Haase et al. (1985). 1H NMR chemical shift selective (CHESS) imaging. Phys Med Biol, 30, 4 341-344.
[8] Barkhuijsen et al. (1987). Improved algorithm for noniterative time-domain model fitting to exponentially damped magnetic resonance signals. J Magn Res, 73, 3 553-557.
[9] Provencher (2001). Automatic quantitation of localized in vivo 1H spectra with LCModel. NMR Biomed, 14, 4 260-264.
[10] Mangia et al. (2007). Sustained Neuronal Activation Raises Oxidative Metabolism to a New Steady-State Level: Evidence from 1H NMR Spectroscopy in the Human Visual Cortex. JCBFM 27, 5
[11] Ligneul et al. (2018). Diffusion-weighted magnetic resonance spectroscopy enables cell-specific monitoring of astrocyte reactivity in vivo. bioRxiv
[12] Ben Haim et Rowitch (2017) Functional diversity of astrocytes in neural circuit regulation. Nature Reviews Neuroscience 18, 31–41
Figures
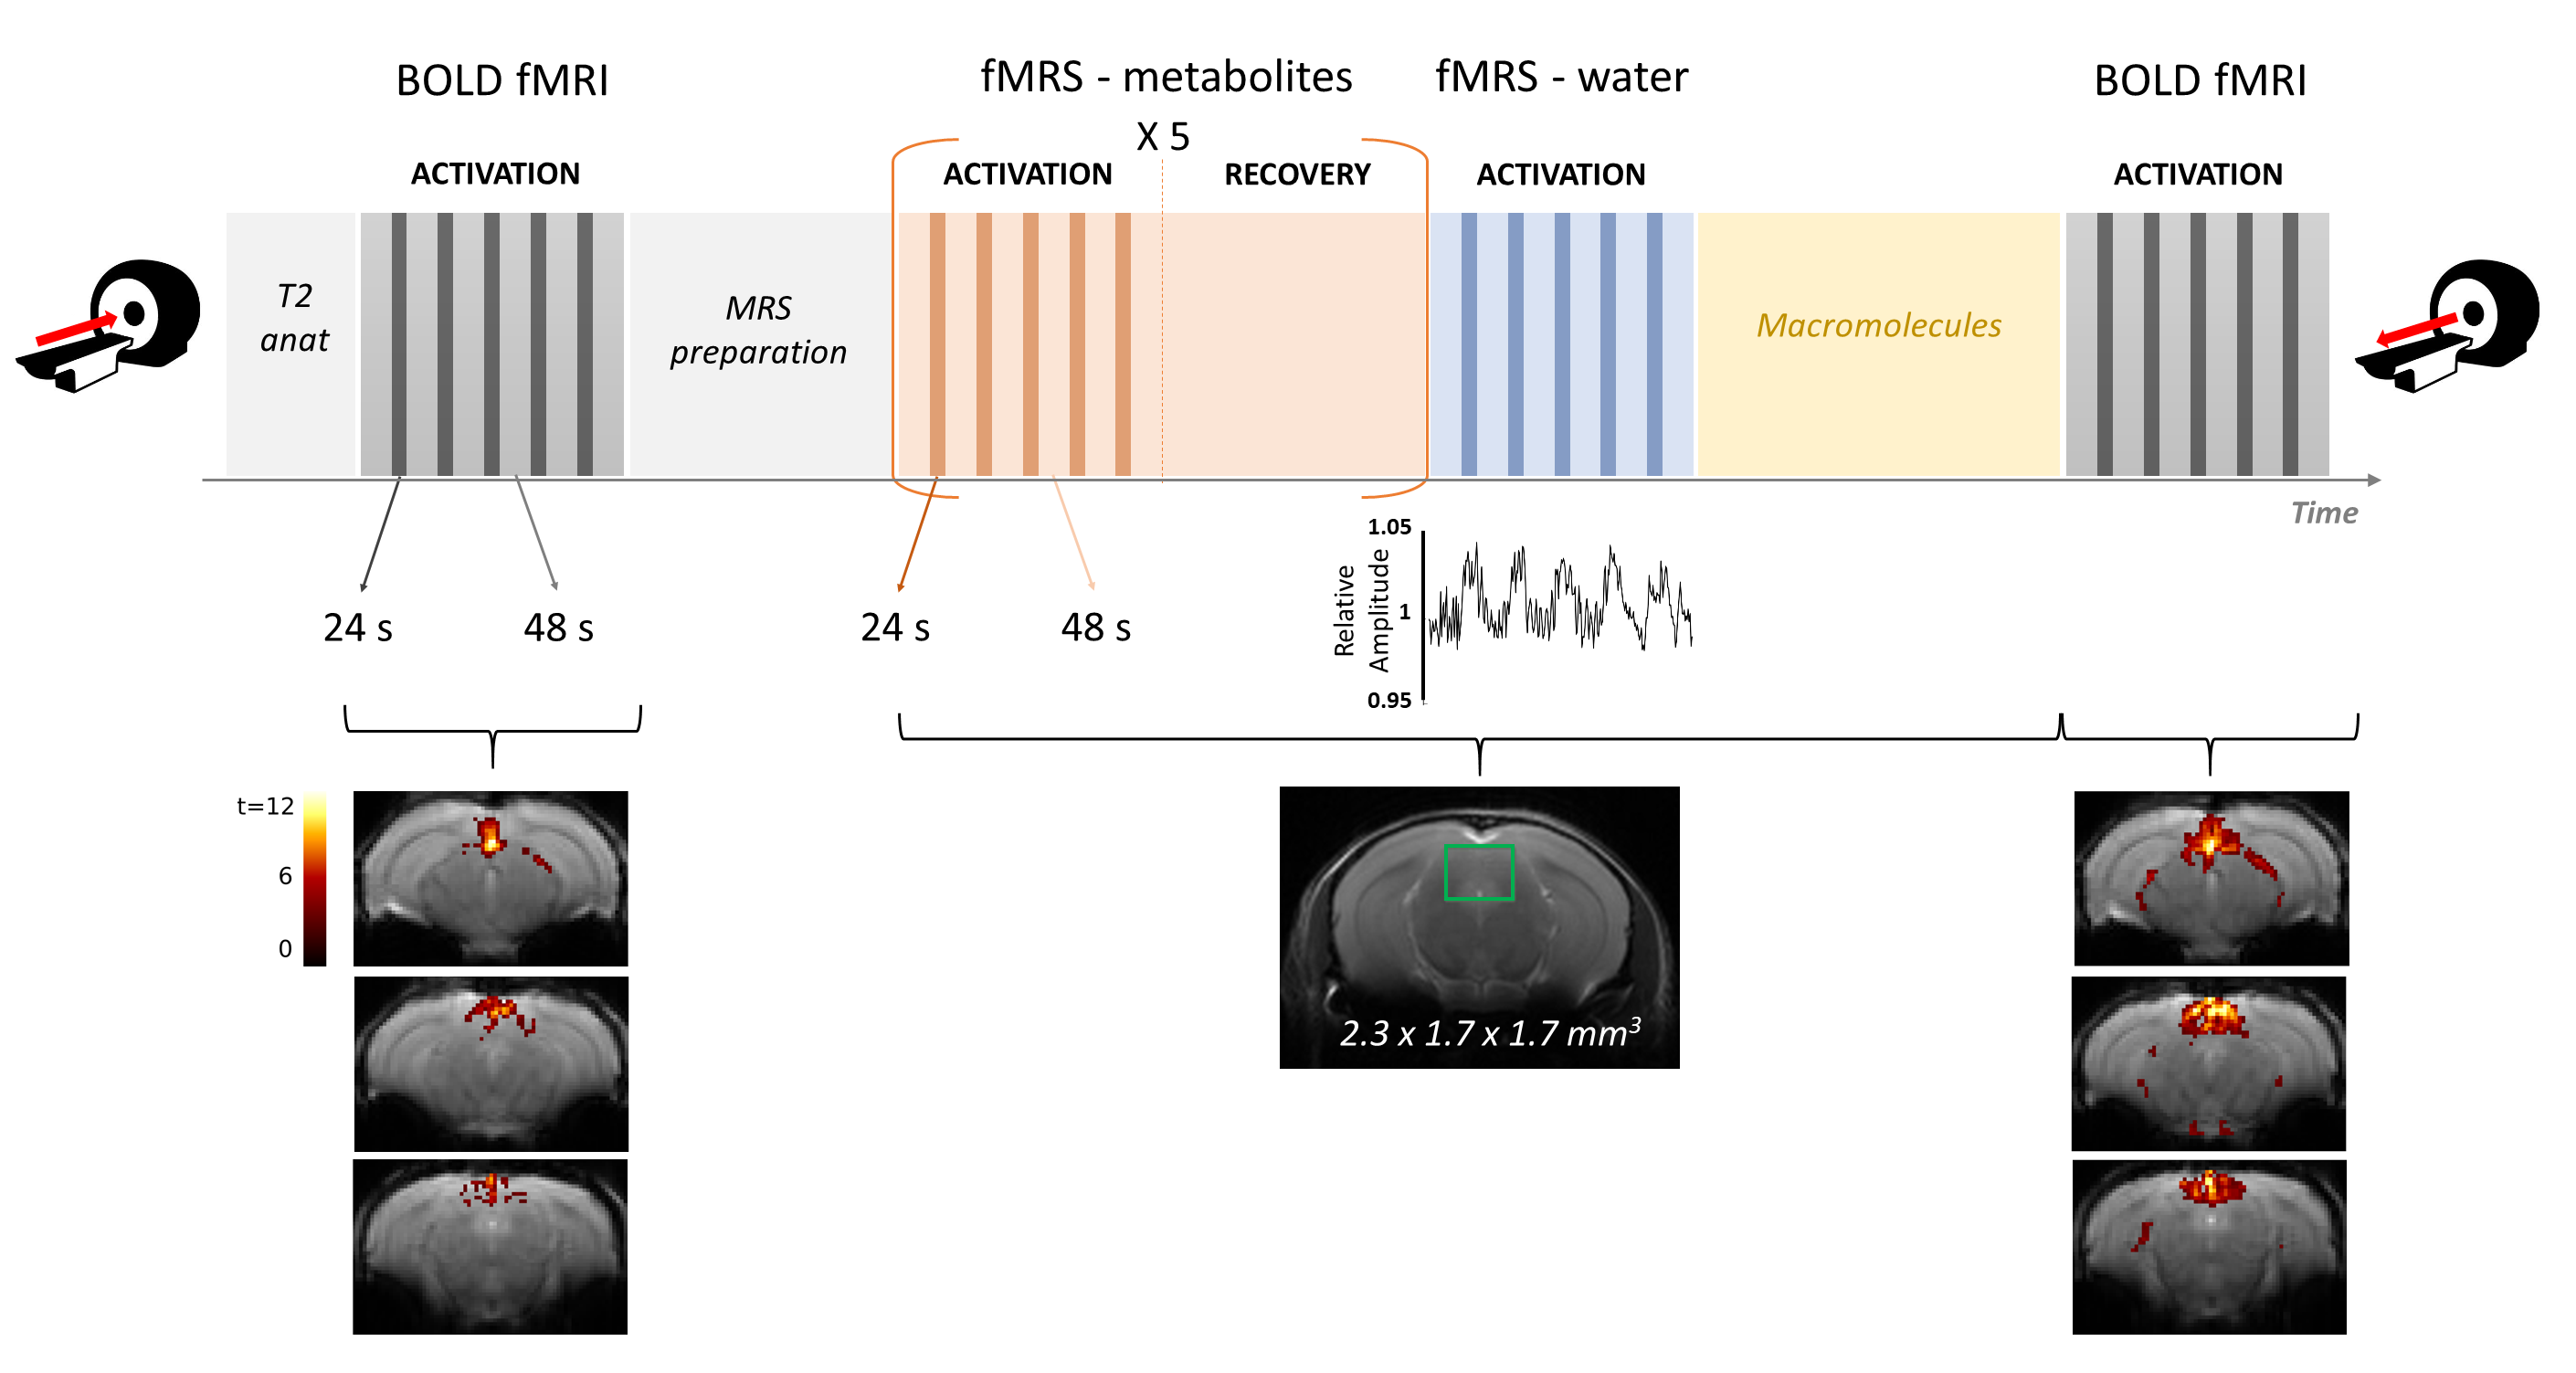
Figure 1
(upper) Experimental design with the sequence of different acquisition types
(mid) Representative time course of the relative amplitude of the water peak (normalized to the first point) in the MRS voxel is shown under the fMRS-water block
(lower) Representative BOLD maps acquired in a single animal in the beginning and in the end of the experiment. The voxel position used for all MRS acquisition (2.3x1.7x1.7 mm3) is displayed on a T2 anatomical image.
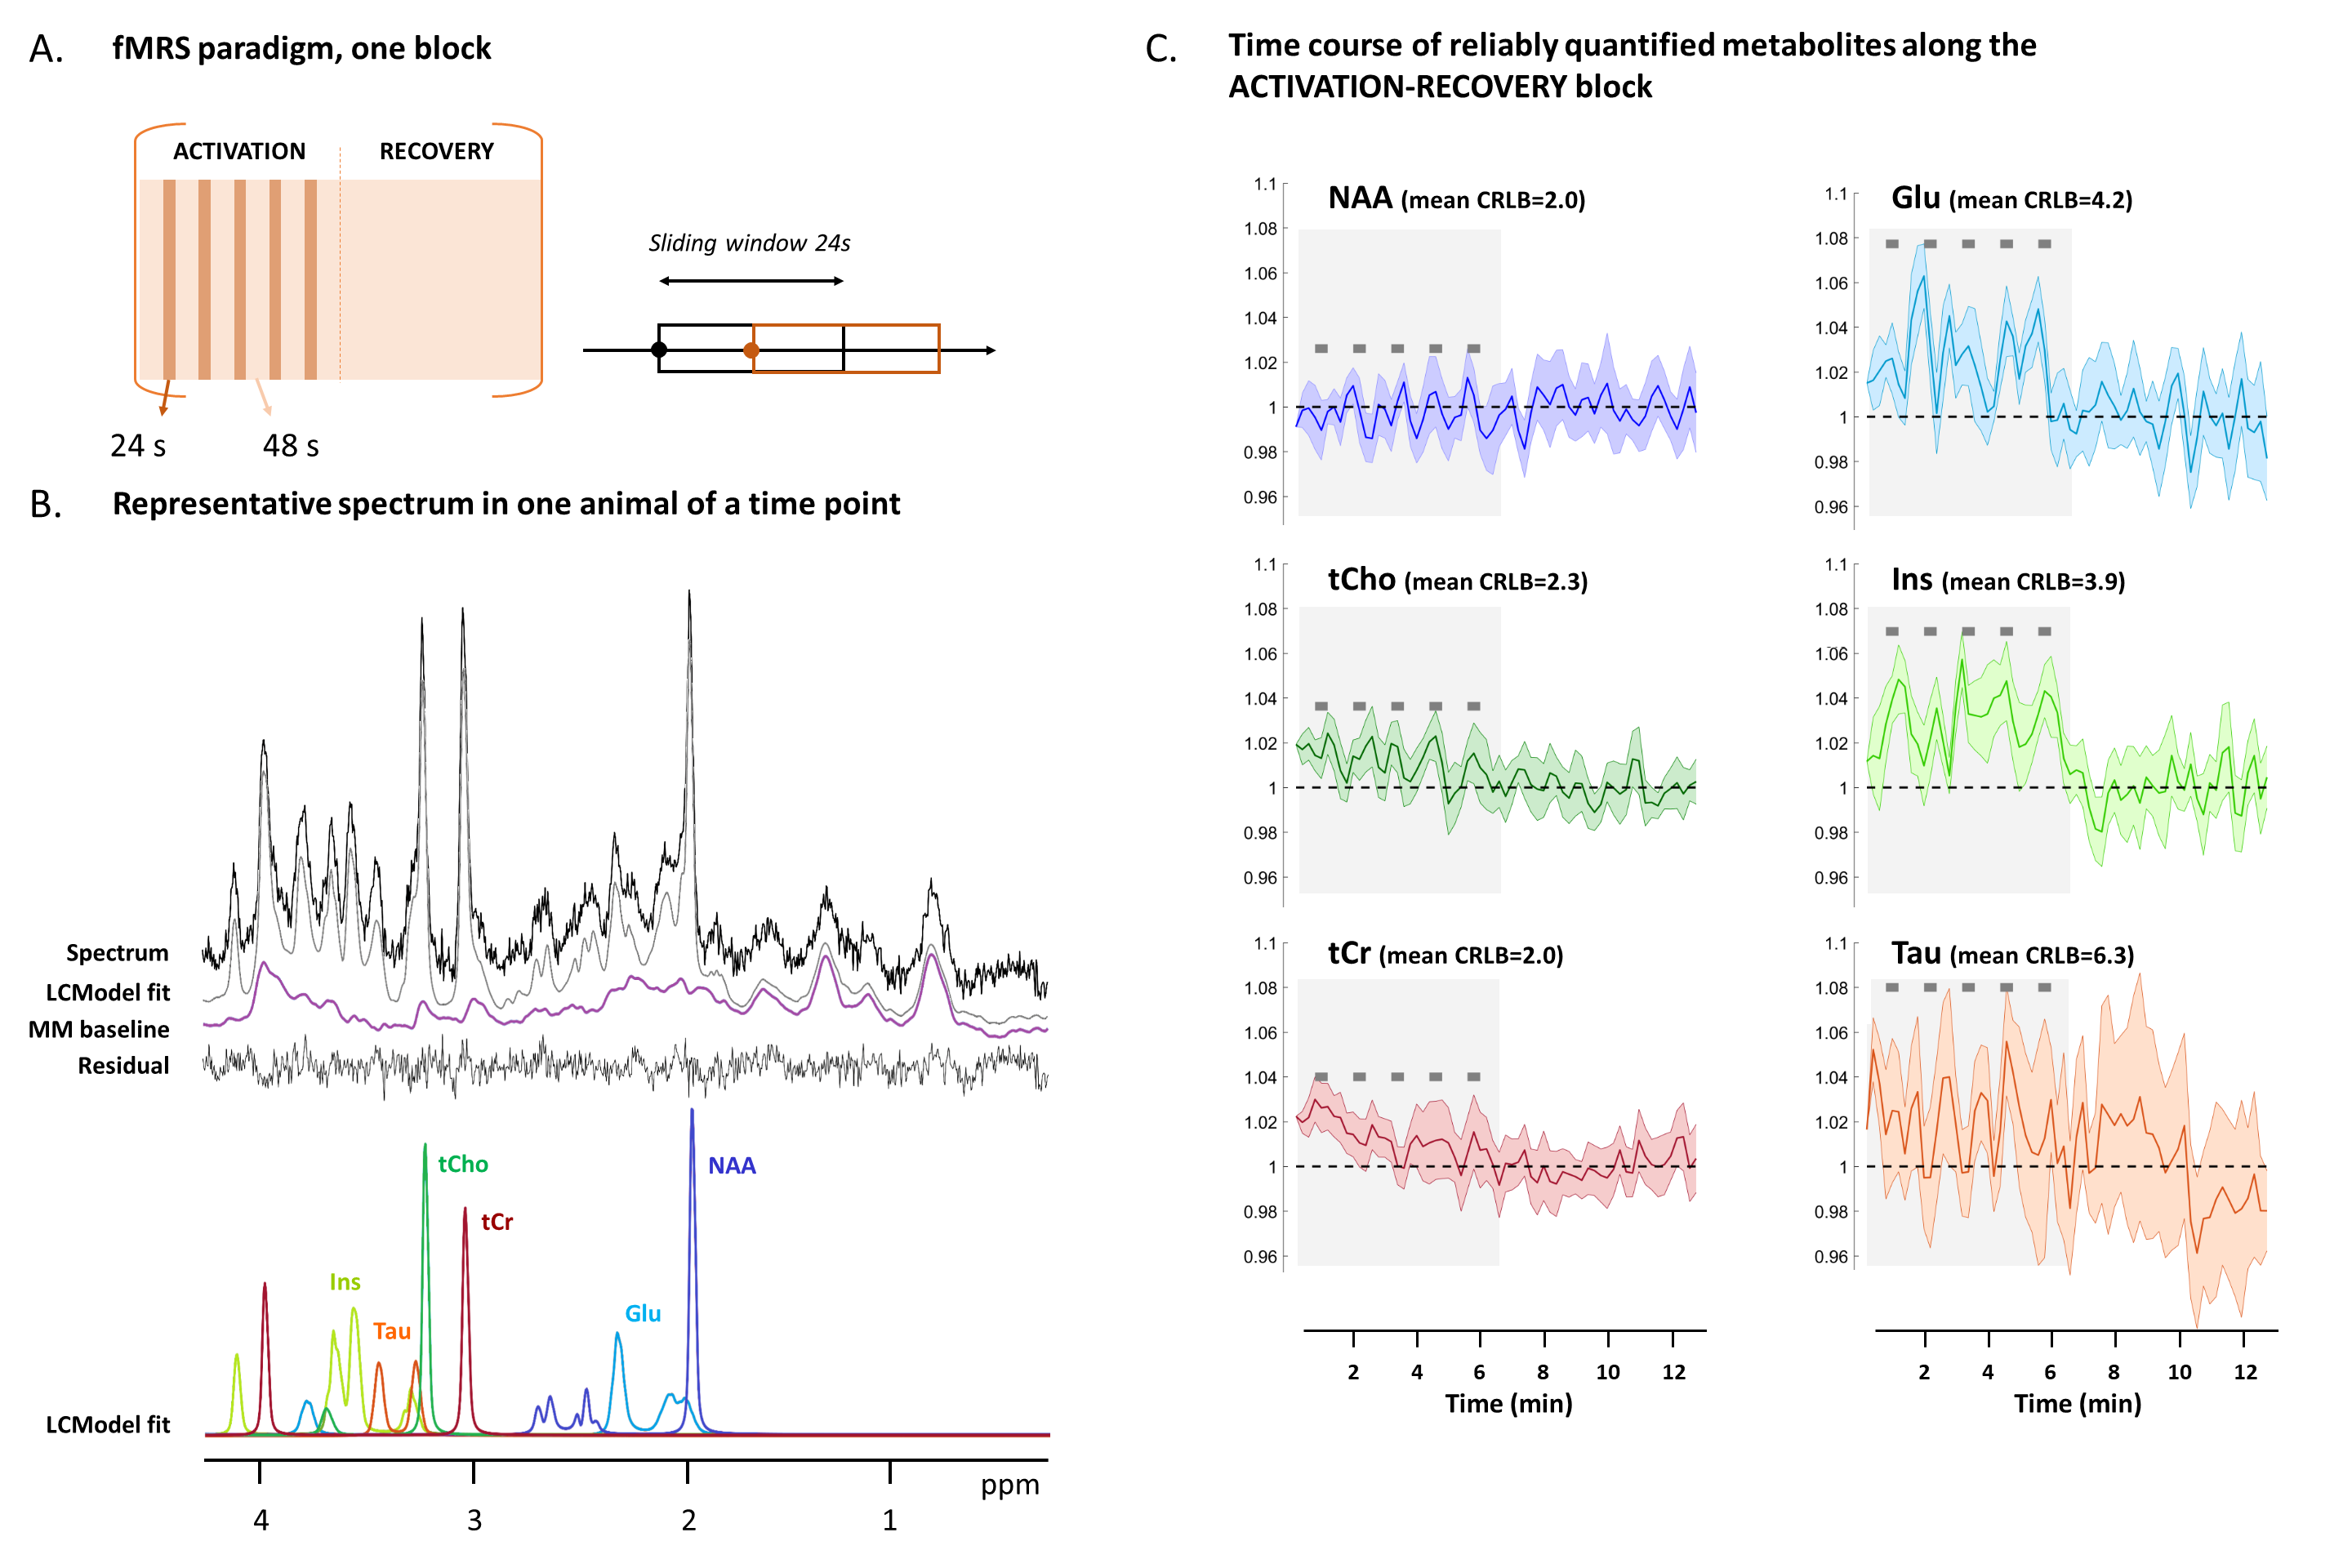
Figure 2
(A) fMRS paradigm. Spectra were consistently summed from the 5 ACTION-RECOVERY blocks every 8 repetitions (12s) for 16 repetitions (24s).
(B) Representative spectrum acquired in a single animal (16x5=80 repetitions) and its LCModel fit and decomposition. The corresponding time point belongs to a rest period during ACTIVATION.
(C) Time courses of [NAA], [tCr], [tCho], [Glu], [Ins] and [Tau] normalized by their own mean concentration in the recovery period. Mean Cramer-Rao-Lower-Bound (CRLB) are given. The grey shadow underlines the ACTIVATION period and thick dark grey lines correspond to the effective stimulation. Colored shadows represent the standard errors.
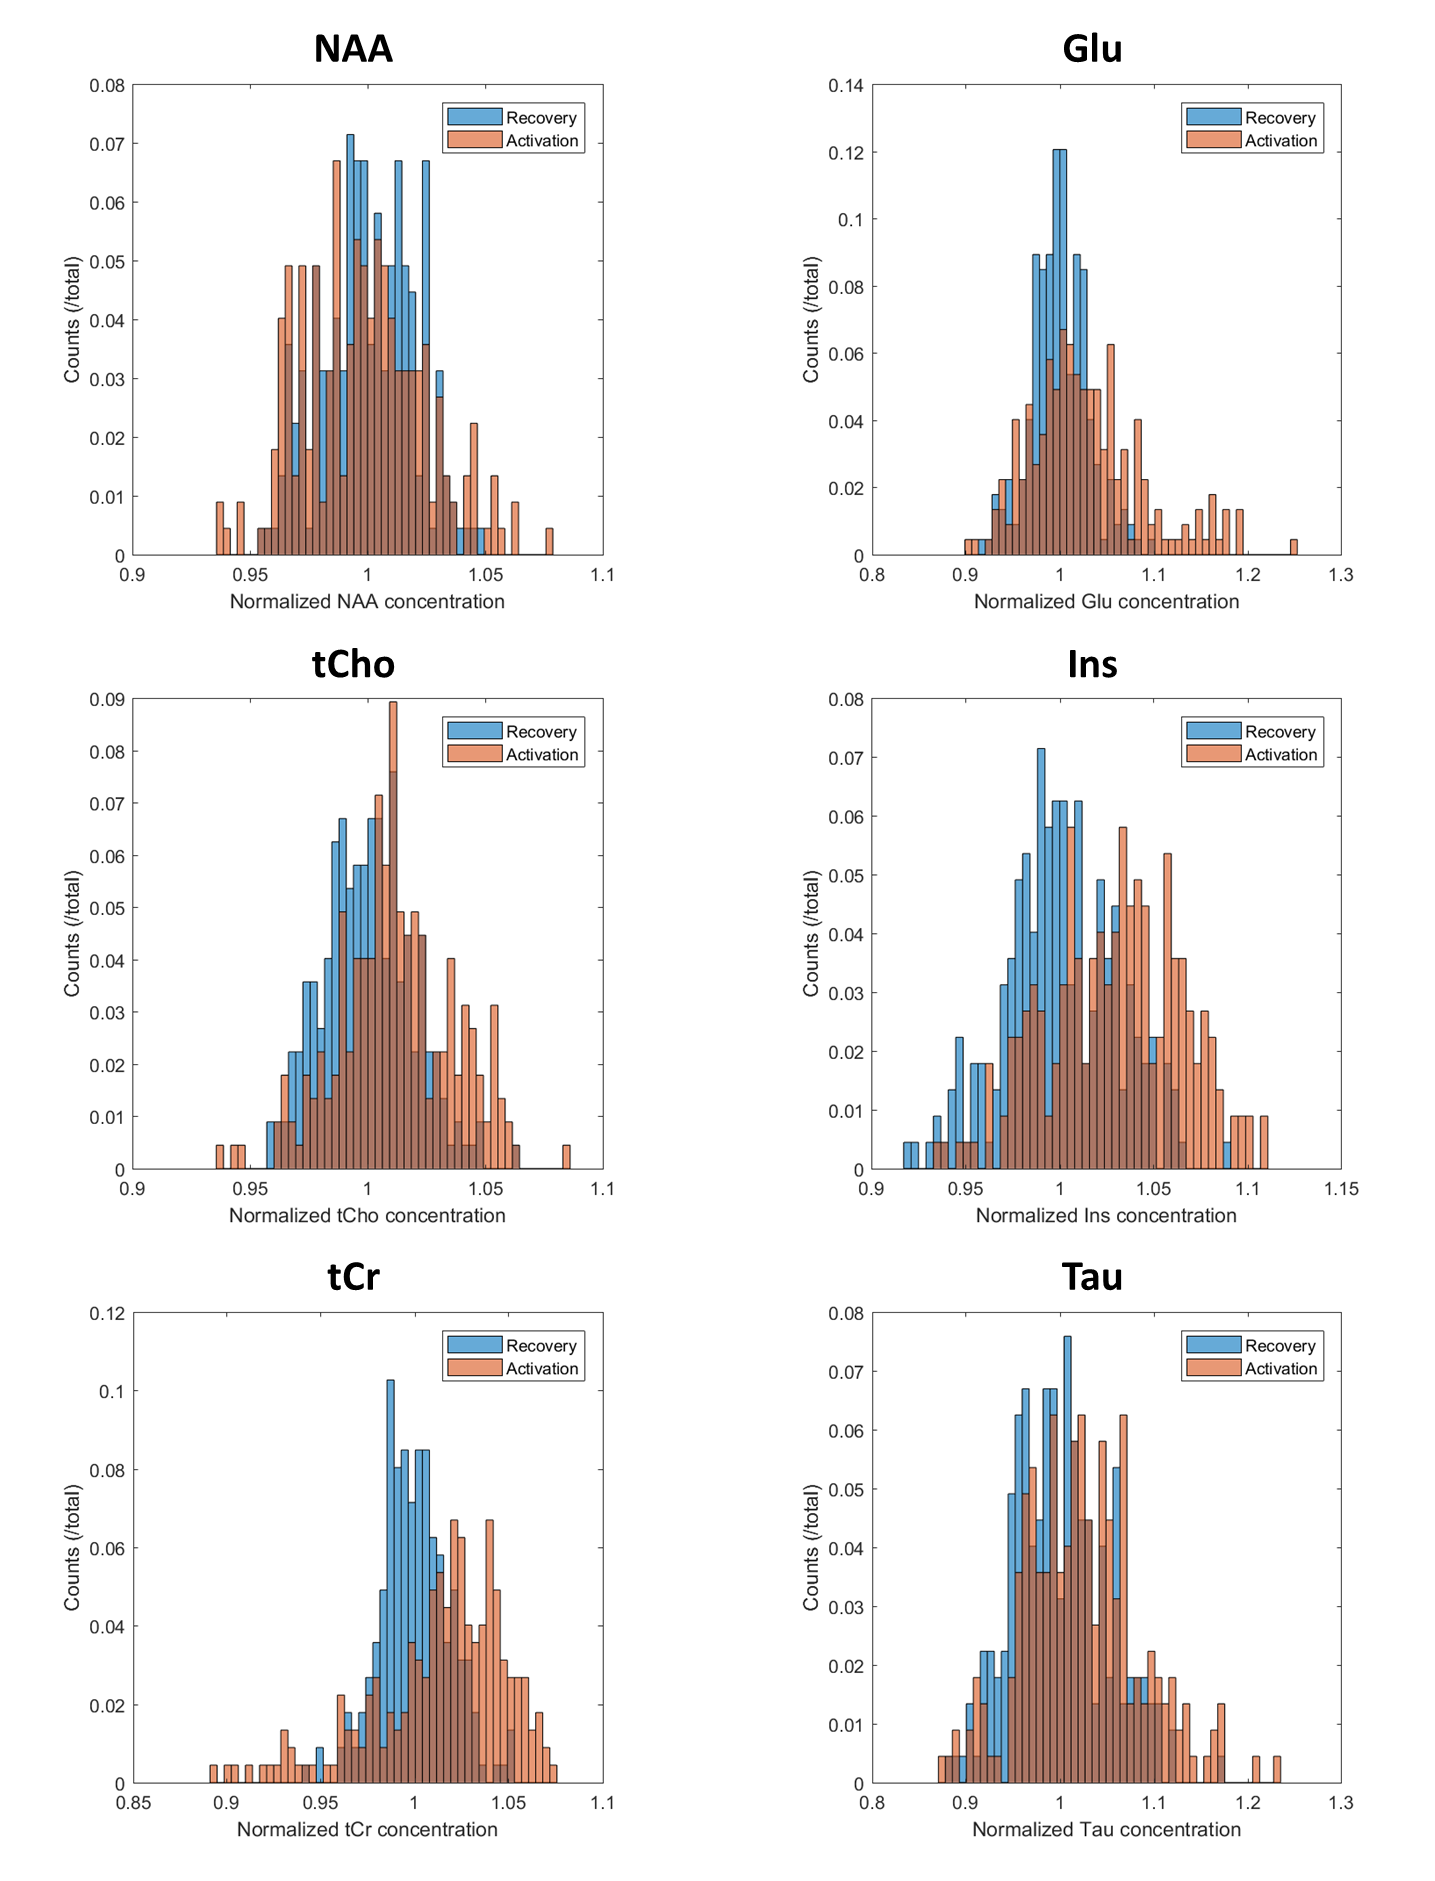
Figure 3
Metabolites distributions over all animals and all time points in ACTIVATION versus RECOVERY periods. Concentrations are normalized by their own mean concentration in the recovery period. Except for NAA, distributions between ACTIVATION and RECOVERY are all significantly different (p-value < 3E-4, calculated by a Student’s t-test, corrected for multiple comparison by Bonferroni).
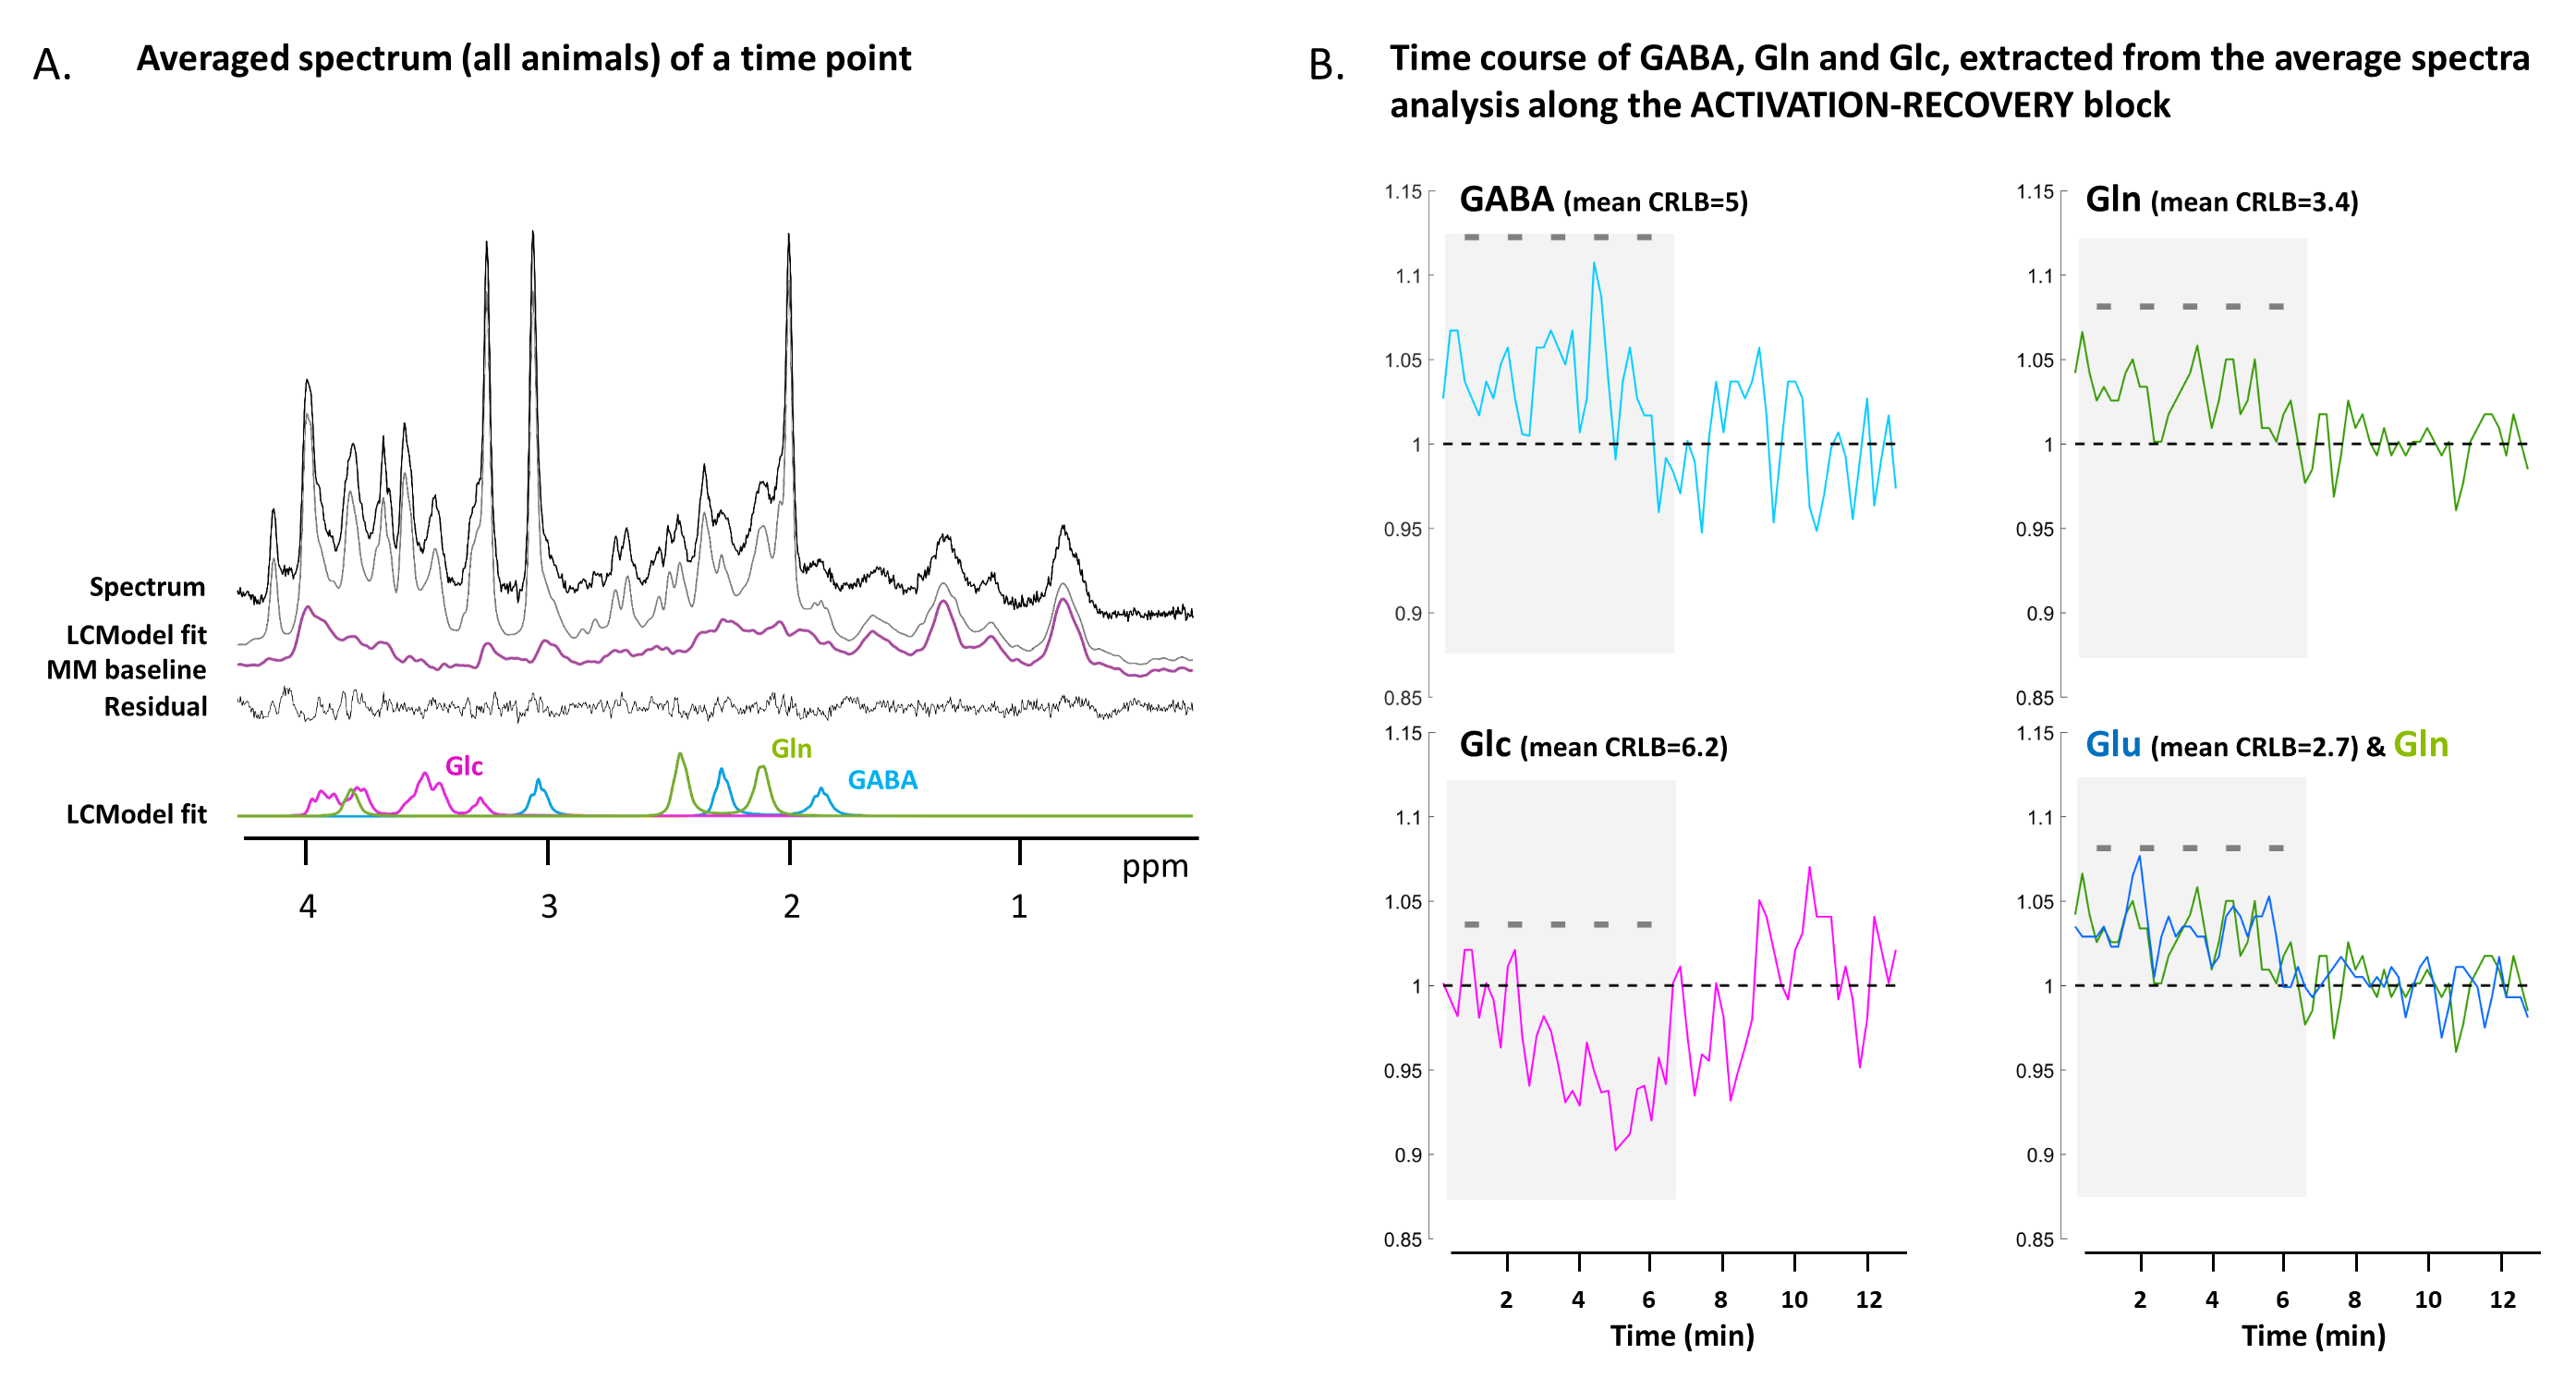
Figure 4
(A) Averaged spectrum on 7 animals (16x5x7=560 repetitions) and its LCModel fit and decomposition for Gln, GABA and Glc. The corresponding time point belongs to a rest period during ACTIVATION.
(B) Time courses of [GABA], [Gln] and [Glc] normalized by their own mean concentration in the recovery period. Since the analysis is coming from a single LCModel fit (extracted from summed spectra on all animals prior to the fit), no error bars can be displayed.