1065
Cardiac creatine quantified by cycled water-suppressed 1H-MRS at 3T1University of Cambridge, Cambridge, United Kingdom, 2Oxford Centre for Clinical Magnetic Resonance Research, University of Oxford, Oxford, United Kingdom, 3Radcliffe Department of Medicine, University of Oxford, Oxford, United Kingdom, 4Oxford Heart Centre, John Radcliffe Hospital, Oxford, United Kingdom, 5Department of Imaging Methods, Institute of Measurement Science, Slovak Academy of Science, Bratislava, Slovakia
Synopsis
This work aimed to use cardiac 3T 1H-MRS to quantify creatine concentration (“[Cr]”) in the human heart, because creatine plays a key role in cardiac energy metabolism. We implemented a cycled water-suppression scheme (WC) into the PRESS and STEAM pulse sequences on a Siemens 3T Prisma MRI scanner. Compared to the vendor’s product PRESS sequence, we found that PRESS-WC was able to measure [Cr] more than 2 times more reproducibly and in a shorter scan. Using PRESS WC in a 10-breathhold protocol, we were able to detect a decrease in creatine concentration in 5 patients suffering from aortic stenosis.
Introduction
In vivo cardiac proton magnetic resonance spectroscopy (1H MRS) has been widely used to quantify myocardial lipids and potentially other metabolites.1 However, it is sensitive to motion; and motion-induced phase and frequency shifts can lose SNR through incoherent averaging. Thus, detection of low concentration metabolites, e.g. creatine, is challenging in the heart. Recently, a cycled water-suppressed scheme (WC) has been suggested to correct for these shifts in neuro-1H-MRS.2 We now present the first application of WC-SVS for cardiac 1H-MRS, evaluating its performance and reproducibility in phantoms and volunteers. Finally, we apply our PRESS WC sequence to measure [Cr] in patients before clinically-indicated valve replacement surgery and compare to biopsy in two of them.Methods
All measurements were performed on a 3T scanner (Prisma, Siemens) using an 18-channel body-array coil (Siemens) in combination with a spine coil array (Siemens).
Phantom experiment
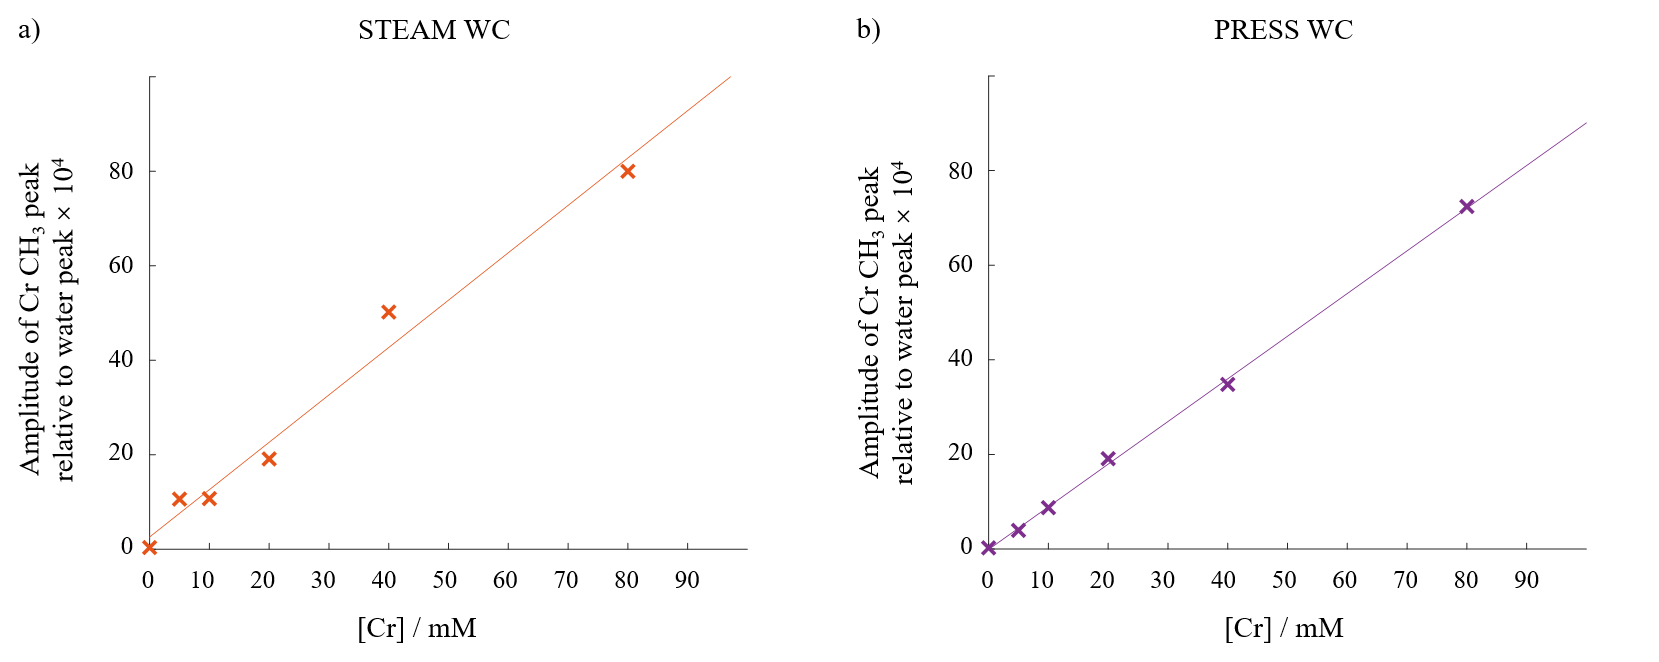
Data were acquired from phantoms containing 6 different [Cr] (0, 5, 10, 20, 40 and 80mM) using three sequences:
- STEAM with vendor’s standard WET water-suppression3 (STEAM WET), TE = 10ms
- STEAM with our WC module (STEAM WC), TE = 10ms
- PRESS with our WC module (PRESS WC), TE = 26ms
In each case, 50 measurements were obtained, followed by 3 non-water-suppressed measurements. TR was 4000ms throughout. Complex weights for coil combination were calculated from the non-water-suppressed data. The residual water peak was used for phase-correction and frequency alignment before signal averaging.2 Spectra were fitted using the OXSA toolbox.4
Healthy controls
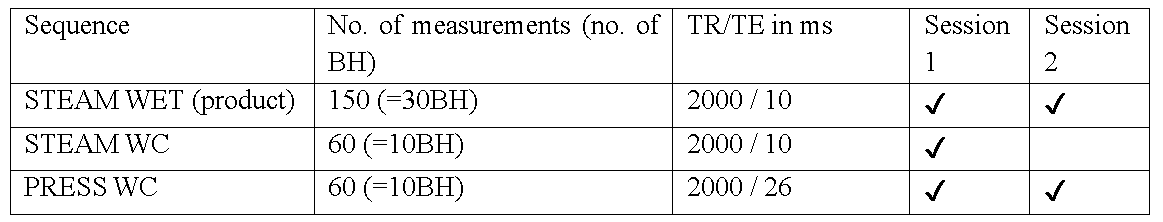
10 healthy volunteers (3 females, mean age = 29.3 ± 4.0 years) were scanned in two sessions on the same day. Table 1 describes the protocol. After each sequence, a non-water-suppressed data set was obtained (1 breath-hold (BH), 3 measurements). All MRS data were obtained at end expiration using ECG triggering from a 12.6cm3 voxel centred on the mid-interventricular septum.
For direct comparison, 12BH were randomly selected and analysed from the STEAM WET data (giving 60 measurements to match the STEAM WC data). SNR and Cramér-Rao lower bounds (CRLB) of the Cr-CH3 peaks were compared between the 4 sequences. [Cr] was obtained by correcting the Cr-CH3/water peak ratios for relaxation and number of protons while fat fraction was computed with the lipid CH2 peak area. Reproducibility data were analysed for 30BH STEAM WET and 10BH PRESS WC.
Patient group
5 patients with aortic stenosis (2 females, mean age = 74.8 ± 6.6 years) due to undergo valve replacement surgery were recruited. Data from 10BH PRESS WC acquisitions were analysed as described above. In 4 cases, intra-operative surgical biopsies of left ventricular endocardium were flash frozen in liquid nitrogen for biochemical analysis. 2 samples are still awaiting analysis.
Results and discussion
Phantom experiment
Figure 1 shows that both sequences are sensitive over the typical physiological range of [Cr].
Healthy controls
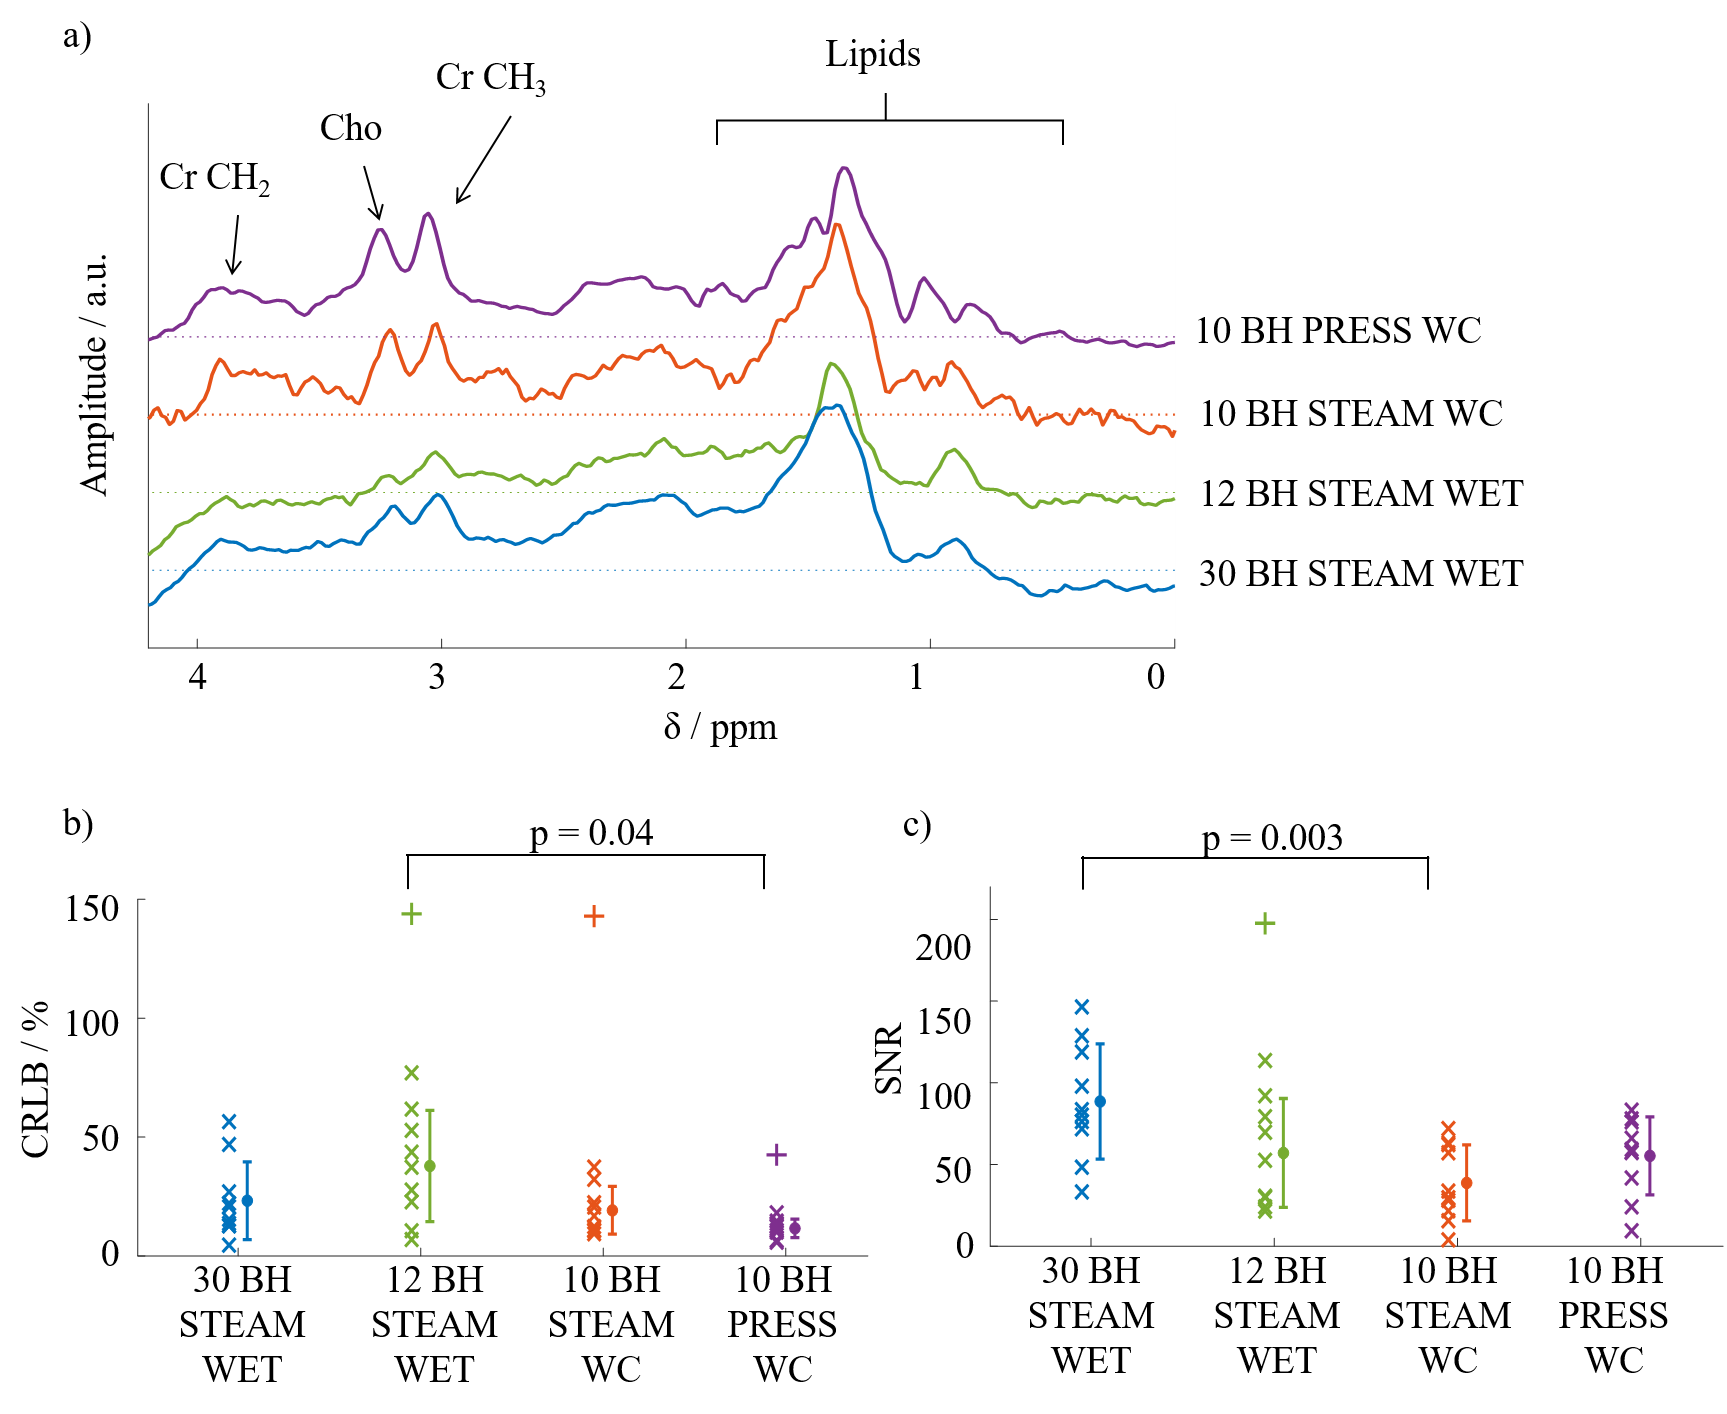
Figure 2a depicts a set of representative spectra from the compared sequences. Although there was a slight decrease in SNR, STEAM WC improves the fitting of the spectra (lower CRLB value) compared to the product STEAM WET. This allows better Cr quantification (Figure 2b and Figure 2c). This fitting is further improved with PRESS WC implying a more accurate measurement of myocardial Cr.
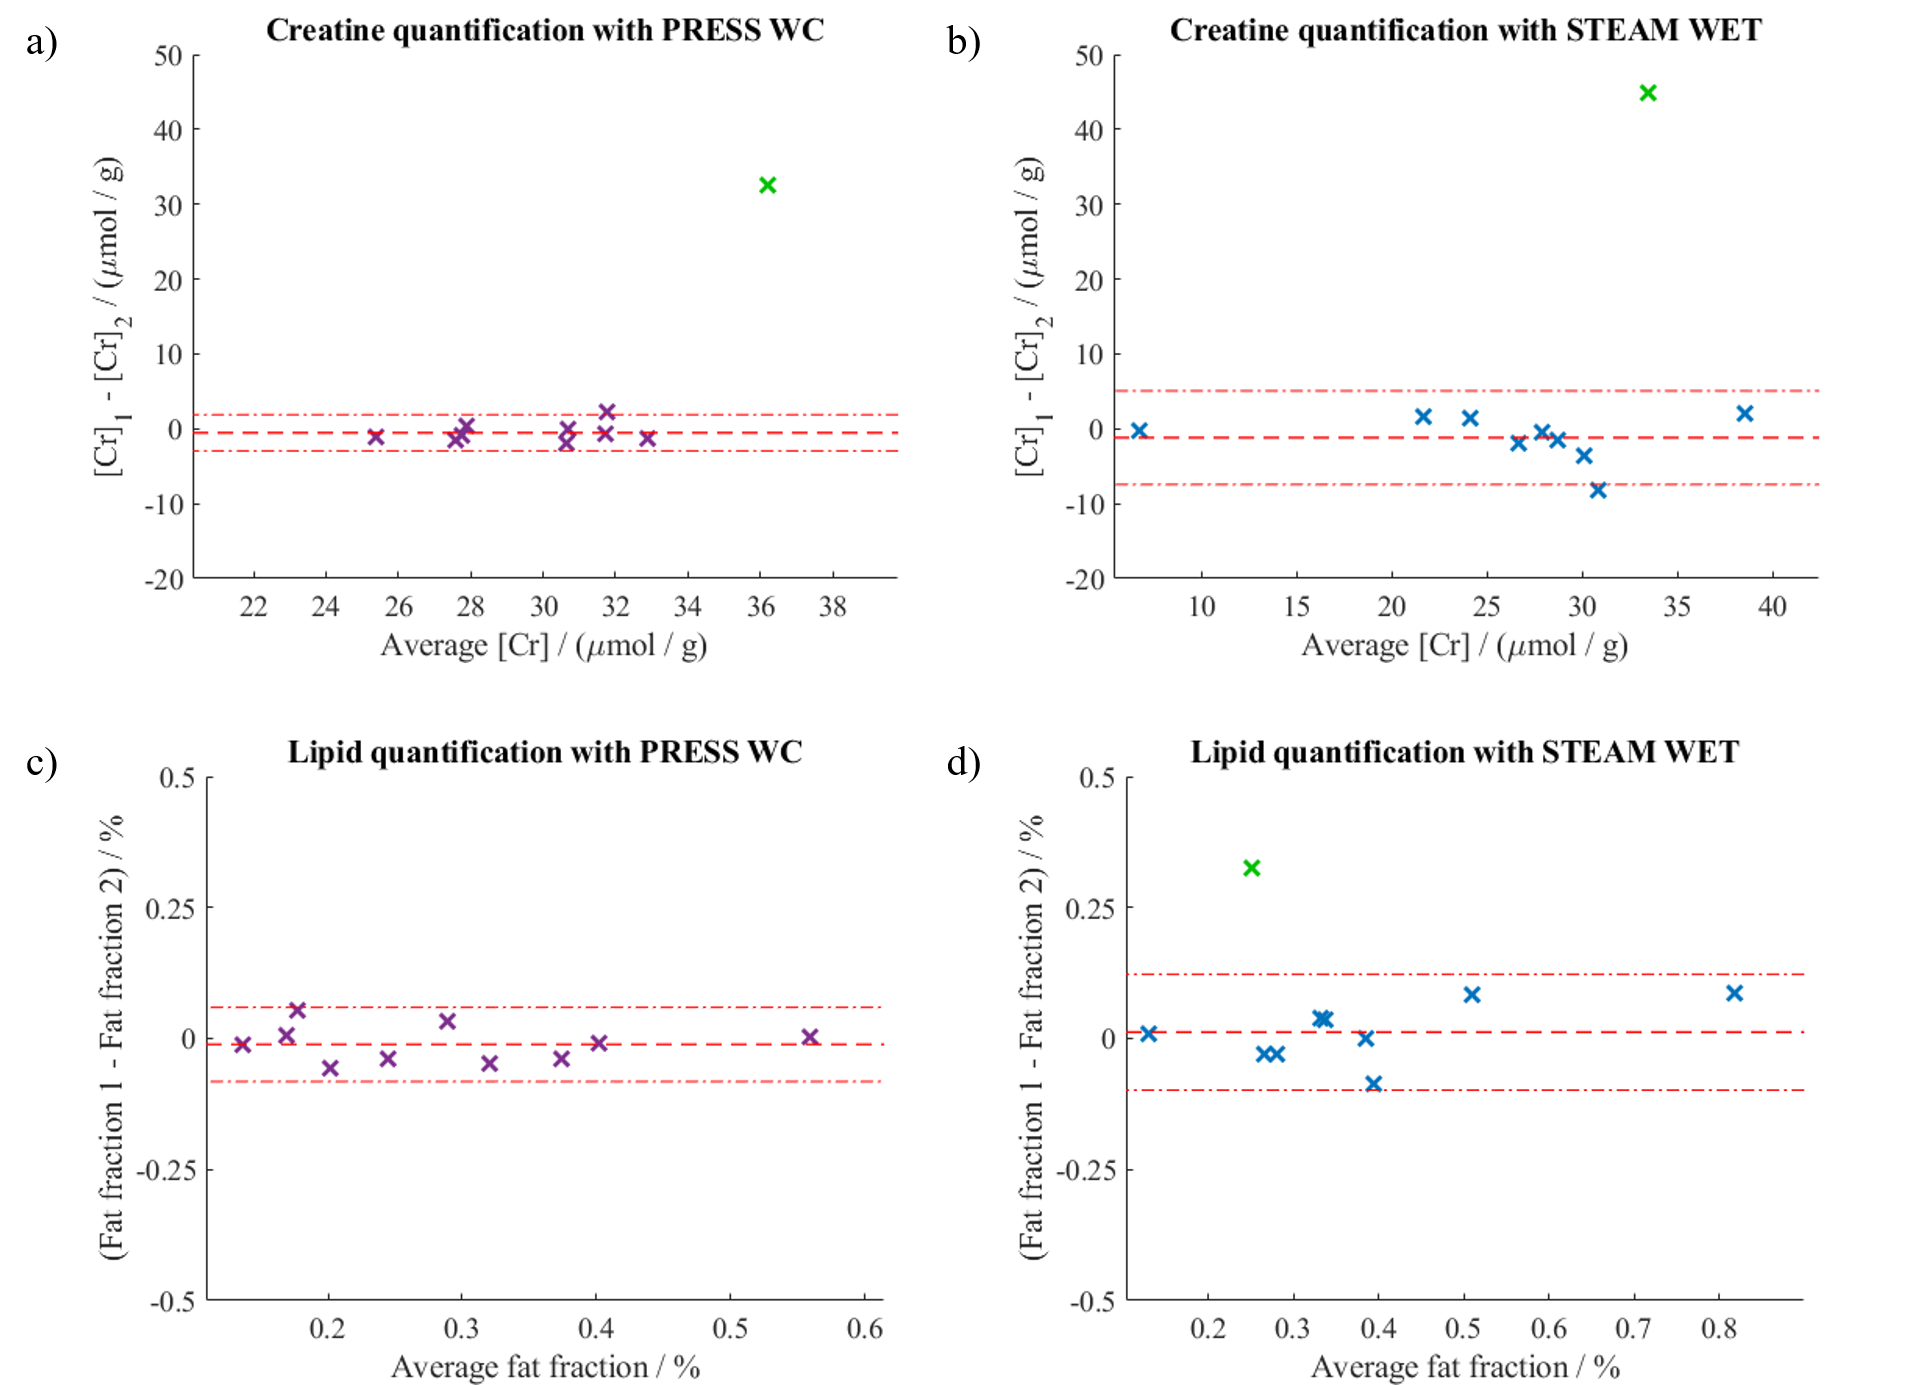
The [Cr] and fat fraction range obtained with both sequences agrees with literature values.5,6 Figure 3 compares the reproducibility of the sequences. PRESS WC shows an increased reproducibility for both measurements, even when using only 10BH. A simple power calculation of the sample size needed to detect a 15% change in [Cr] decreases from 20 for STEAM WET to 3 for PRESS WC. This is of great benefit for clinical studies.
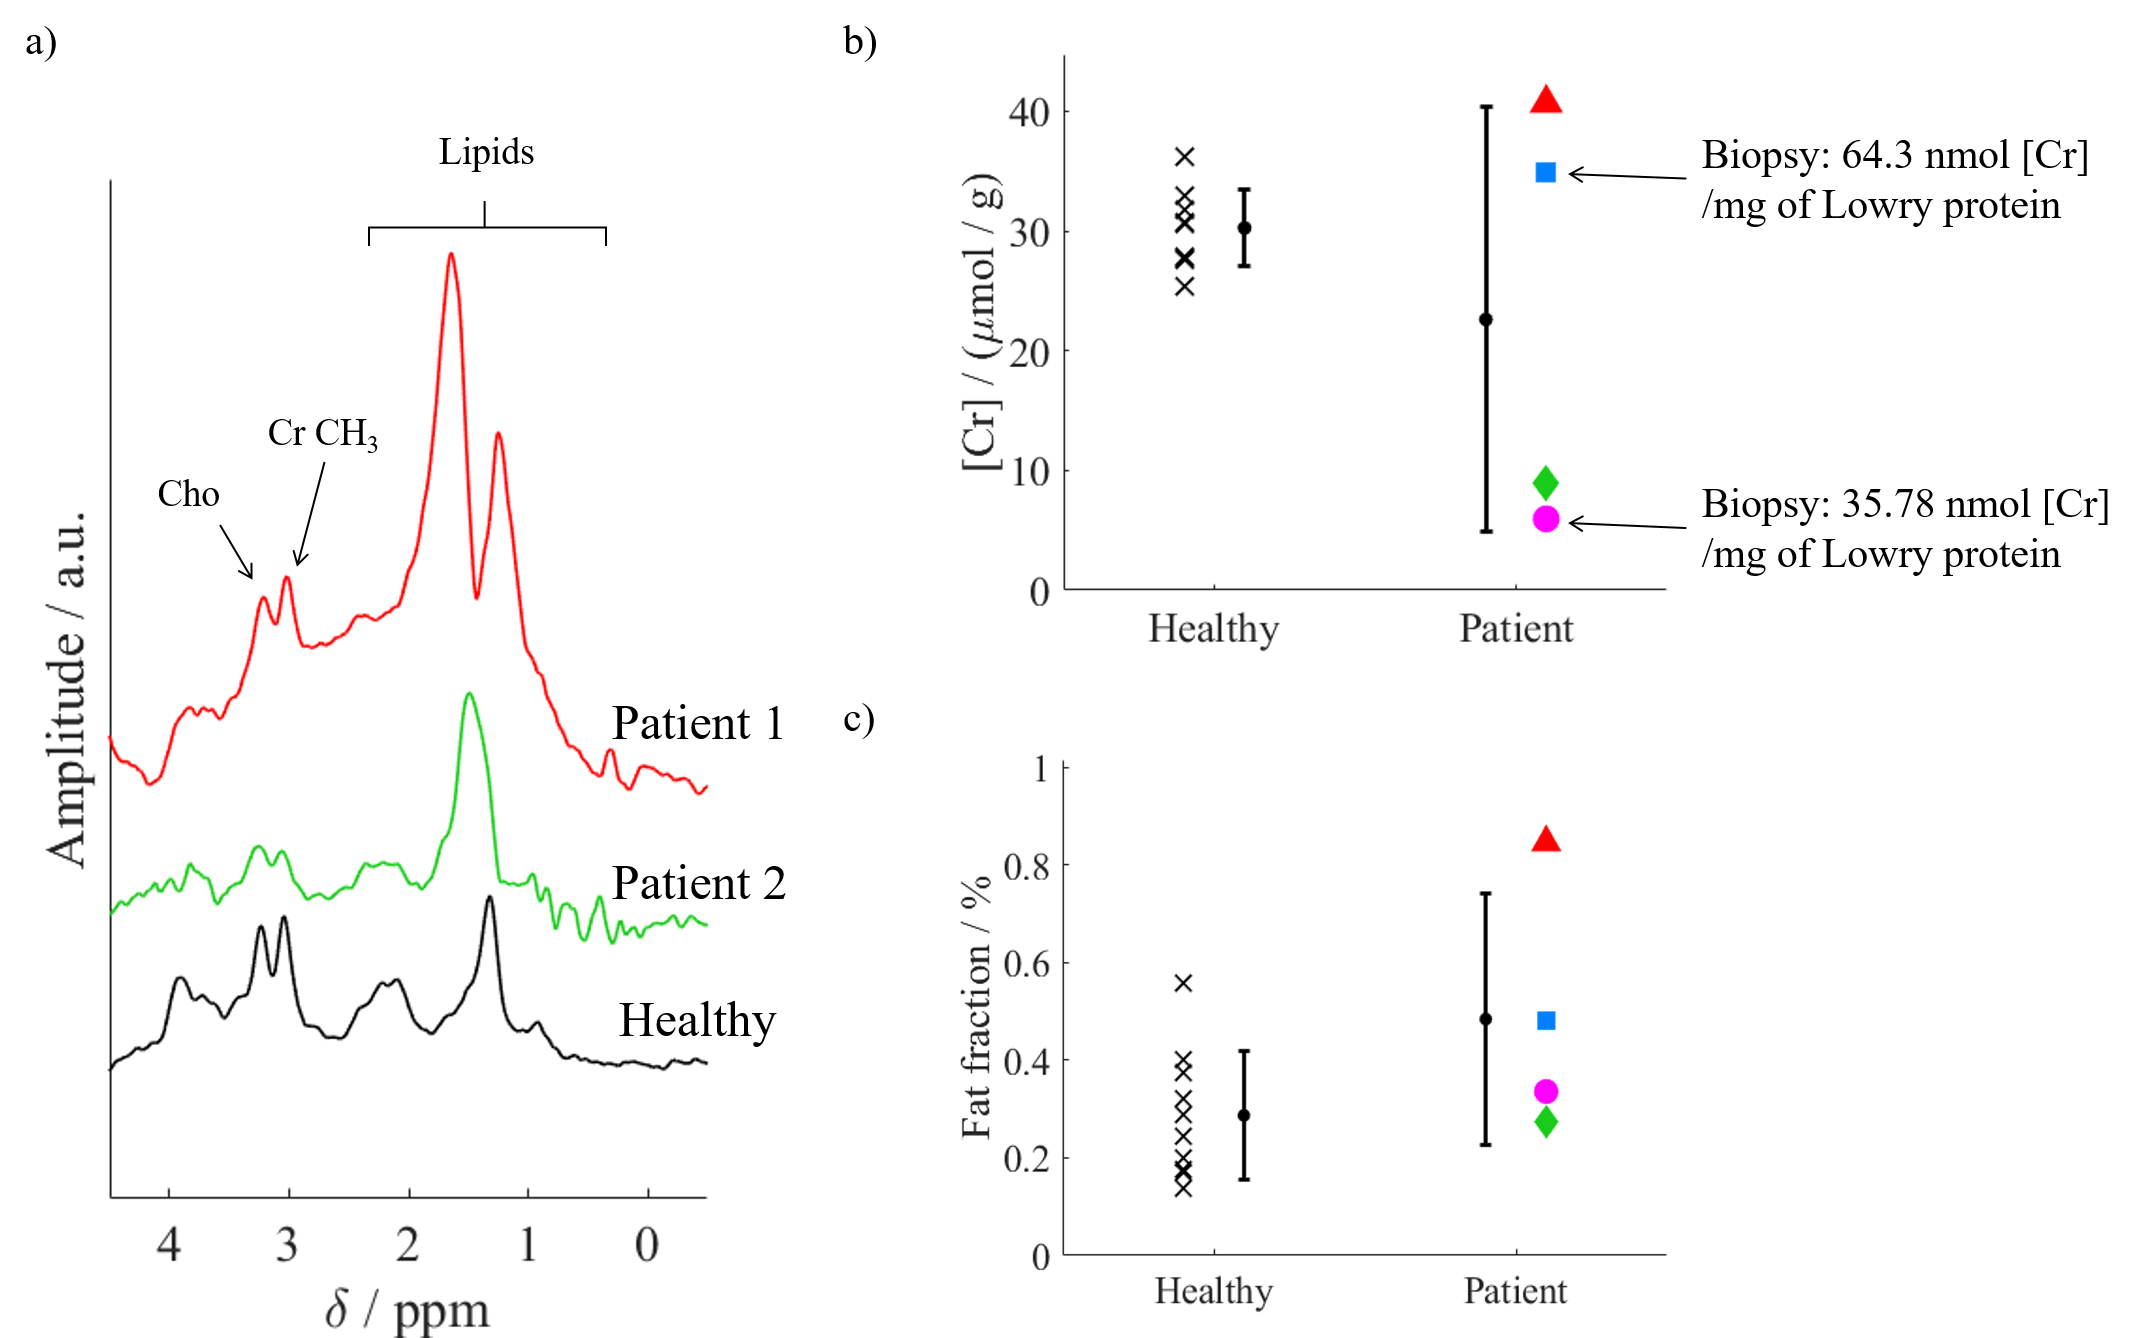
Patient group
All patients tolerated the exam well. One patient had both [Cr] and fat fraction more than 8 times the mean values. We suspect that the voxel had moved away from the septum during the water reference scan and subsequently excluded this data set. Figure 4 compares the spectra, [Cr] and fat fraction between healthy controls and patients. The increase in fat fraction is also consistent with previous studies.7
Conclusion
Our work has shown that a WC module is able to correct efficiently for signal loss due to motion in 1H cardiac MRS. The increased reproducibility in PRESS WC will allow the quantification of [Cr] more accurately in a shorter scan time, increasing the clinical feasibility of the technique, as demonstrated by the good tolerance in valvular heart disease patients. The variability in measured [Cr] in the patient group may potentially allow us to differentiate the extent of disease progression.Acknowledgements
BD is currently funded by Gates Cambridge Trust. CTR is funded by a Sir Henry Dale Fellowship from the Wellcome Trust / Royal Society [098436/Z/12/B]. MAP was supported by a British Heart Foundation Clinical Research Training Fellowship (FS/15/80/31803).References
- Rial, B., Robson, M. D., Neubauer, S. & Schneider, J. E. Rapid Quantification of Myocardial Lipid Content in Humans Using Single Breath-Hold 1H MRS at 3 Tesla. Magn Reson Med 66, 619–624 (2011).
- Ernst, T. & Li, J. A novel phase and frequency navigator for 1H MRS using water suppression cycling. Magn Reson Med 65, 13–17 (2011).
- Ogg, R. J., Kingsley, R. B. & Taylor, J. S. WET, a T1- and B1-Insensitive Water-Suppression Method for in Vivo Localized 1H NMR Spectroscopy. Journal of Magnetic Resonance, Series B 104, 1–10 (1994).
- Purvis, L. A. B. et al. OXSA: An open-source magnetic resonance spectroscopy analysis toolbox in MATLAB. PLOS ONE 12, e0185356 (2017).
- Szczepaniak, L. S. et al. Myocardial triglycerides and systolic function in humans: in vivo evaluation by localized proton spectroscopy and cardiac imaging. Magn Reson Med 49, 417–423 (2003).
- Nakae, I. et al. Assessment of Myocardial Creatine Concentration in Dysfunctional Human Heart by Proton Magnetic Resonance Spectroscopy. Magnetic Resonance in Medical Sciences 3, 19–25 (2004).
- Mahmod Masliza et al. Myocardial Steatosis and Left Ventricular Contractile Dysfunction in Patients With Severe Aortic Stenosis. Circulation: Cardiovascular Imaging 6, 808–816 (2013).
- Nakae, I. et al. Proton magnetic resonance spectroscopy can detect creatine depletion associated with the progression of heart failure in cardiomyopathy. J. Am. Coll. Cardiol. 42, 1587–1593 (2003).
Figures