1064
In vivo Detection of Metabolic Turnover of GABA and Glutamate in Human Brain using Dynamically Acquired MEGA-PRESS MRS During 13C-Labeled Glucose Infusion1Department of Psychiatry, Mcgill university, Montreal, QC, Canada, 2Centre d'Imagerie Cérébrale, Douglas Mental Health University, Montreal, QC, Canada, 3Clinical Research Division, Douglas Institute Psychiatrist, Montreal, QC, Canada
Synopsis
Glucose, the main substrate for cerebral energy metabolism, serves as a metabolic precursor for both glutamate and GABA synthesis. In the current study, we employ a novel approach to investigate 13C-labeling of both glutamate and GABA in the human brain. Specifically, localized homonuclear (1H) J-difference edited (MEGA-PRESS) MRS spectra were acquired dynamically (without heteronuclear decoupling or editing pulses) to detect glutamate and GABA labelling following an infusion of 13C labeled glucose. Despite excellent spectral quality and temporal stability, little or no GABA labeling was observed, raising some questions as to the functional status of the GABA pools detected by MEGA-PRESS.
Introduction
Glutamate (Glu) and -aminobutyric
acid (GABA) are the main excitatory and inhibitory neurotransmitters in the
brain, respectively1,2. Glucose,the main substrate for cerebral
energy metabolism, serves as a metabolic precursor for both Glu and GABA
synthesis3,4. NMR spectroscopy can been used to probe the metabolism
of Glu and GABA in vivo following the infusion of 13C‐labeled glucose. While many previous studies
have examined the turnover of Glu in the human brain, few have focused on the
GABA. In the current study, we employ a novel approach to investigate 13C-labeling
of both Glu and GABA in the human brain.
Methods
One
healthy female volunteer provided informed consent to participate in this study.
Experiments were performed on a 3T Siemens Prisma MR scanner with a commercial
body transmit-volume coil and 32-channel receive array. Bo field
inhomogeneities were minimized within VOI(50x45x35 mm3) positioned over
the precuneus/posterior cingulate cortex using the
GRE-shim procedure, resulting in a water linewidth of 6 Hz. Localized water
suppressed 1H spectra were acquired using MEGA-PRESS J-difference editing
sequence5 with with the parameters shown in Fig.1. Prior to infusion, one baseline water-unsuppressed and two water-suppressed scans
were acquired. The infusion consisted of a solution of 99% [1-13C]
glucose (20% w/w), administrated intravenously(0.30 g/kg body-weight) at a
constant rate over 40 min. During and following the
infusion, repeated water-suppressed MEGA-PRESS scans were acquired to track dynamic
changes in 1H signals due to incorporation of the 13C
label.
Spectral pre-processing steps,
including coil combination, phase and frequency correction and averaging were
performed in MATLAB using the FID-A toolkit6. The MEGA-PRESS edit-on
and edit-off subspectra at each timepoint were aligned and subtracted to yield
the MEGA-PRESS difference spectra. A time-series of labeling-specific signals was
then obtained by subtracting the processed pre-infusion MEGA-PRESS difference
spectra from each of the subsequent timepoints. Quantification was performed in
LCModel using basis sets that were simulated in-house using the FID-A toolkit6.
For analysis of the pre-infusion MEGA-PRESS difference spectrum, the basis set included
only the spectral shapes of standard 1H metabolites. For analysis of
the subsequent labelling timeseries, the basis set took into account the pronounced effect of heteronuclear (13C-1H)
scalar coupling on the observed 1H spectra, as described previously7.
The fractional enrichment(FE) of Glu and GABA were estimated
at each time point.
Results
Fig.1 shows the region of interest for
acqusition, along with the MEGA-PRESS edit-on, edit-off and difference spectra.
Fig.2 shows the simulated basis spectra used to fit
the labelling timeseries in LCModel. Note that large reductions in the signal
intensity of the 3.0 ppm GABA resonance are expected to result from labeling
at either the C4 position of GABA (due to reduction in endogenous 12C-H4 of GABA)
or the C3 positions of GABA (due to inefficacy of the 1.9 ppm editing pulse
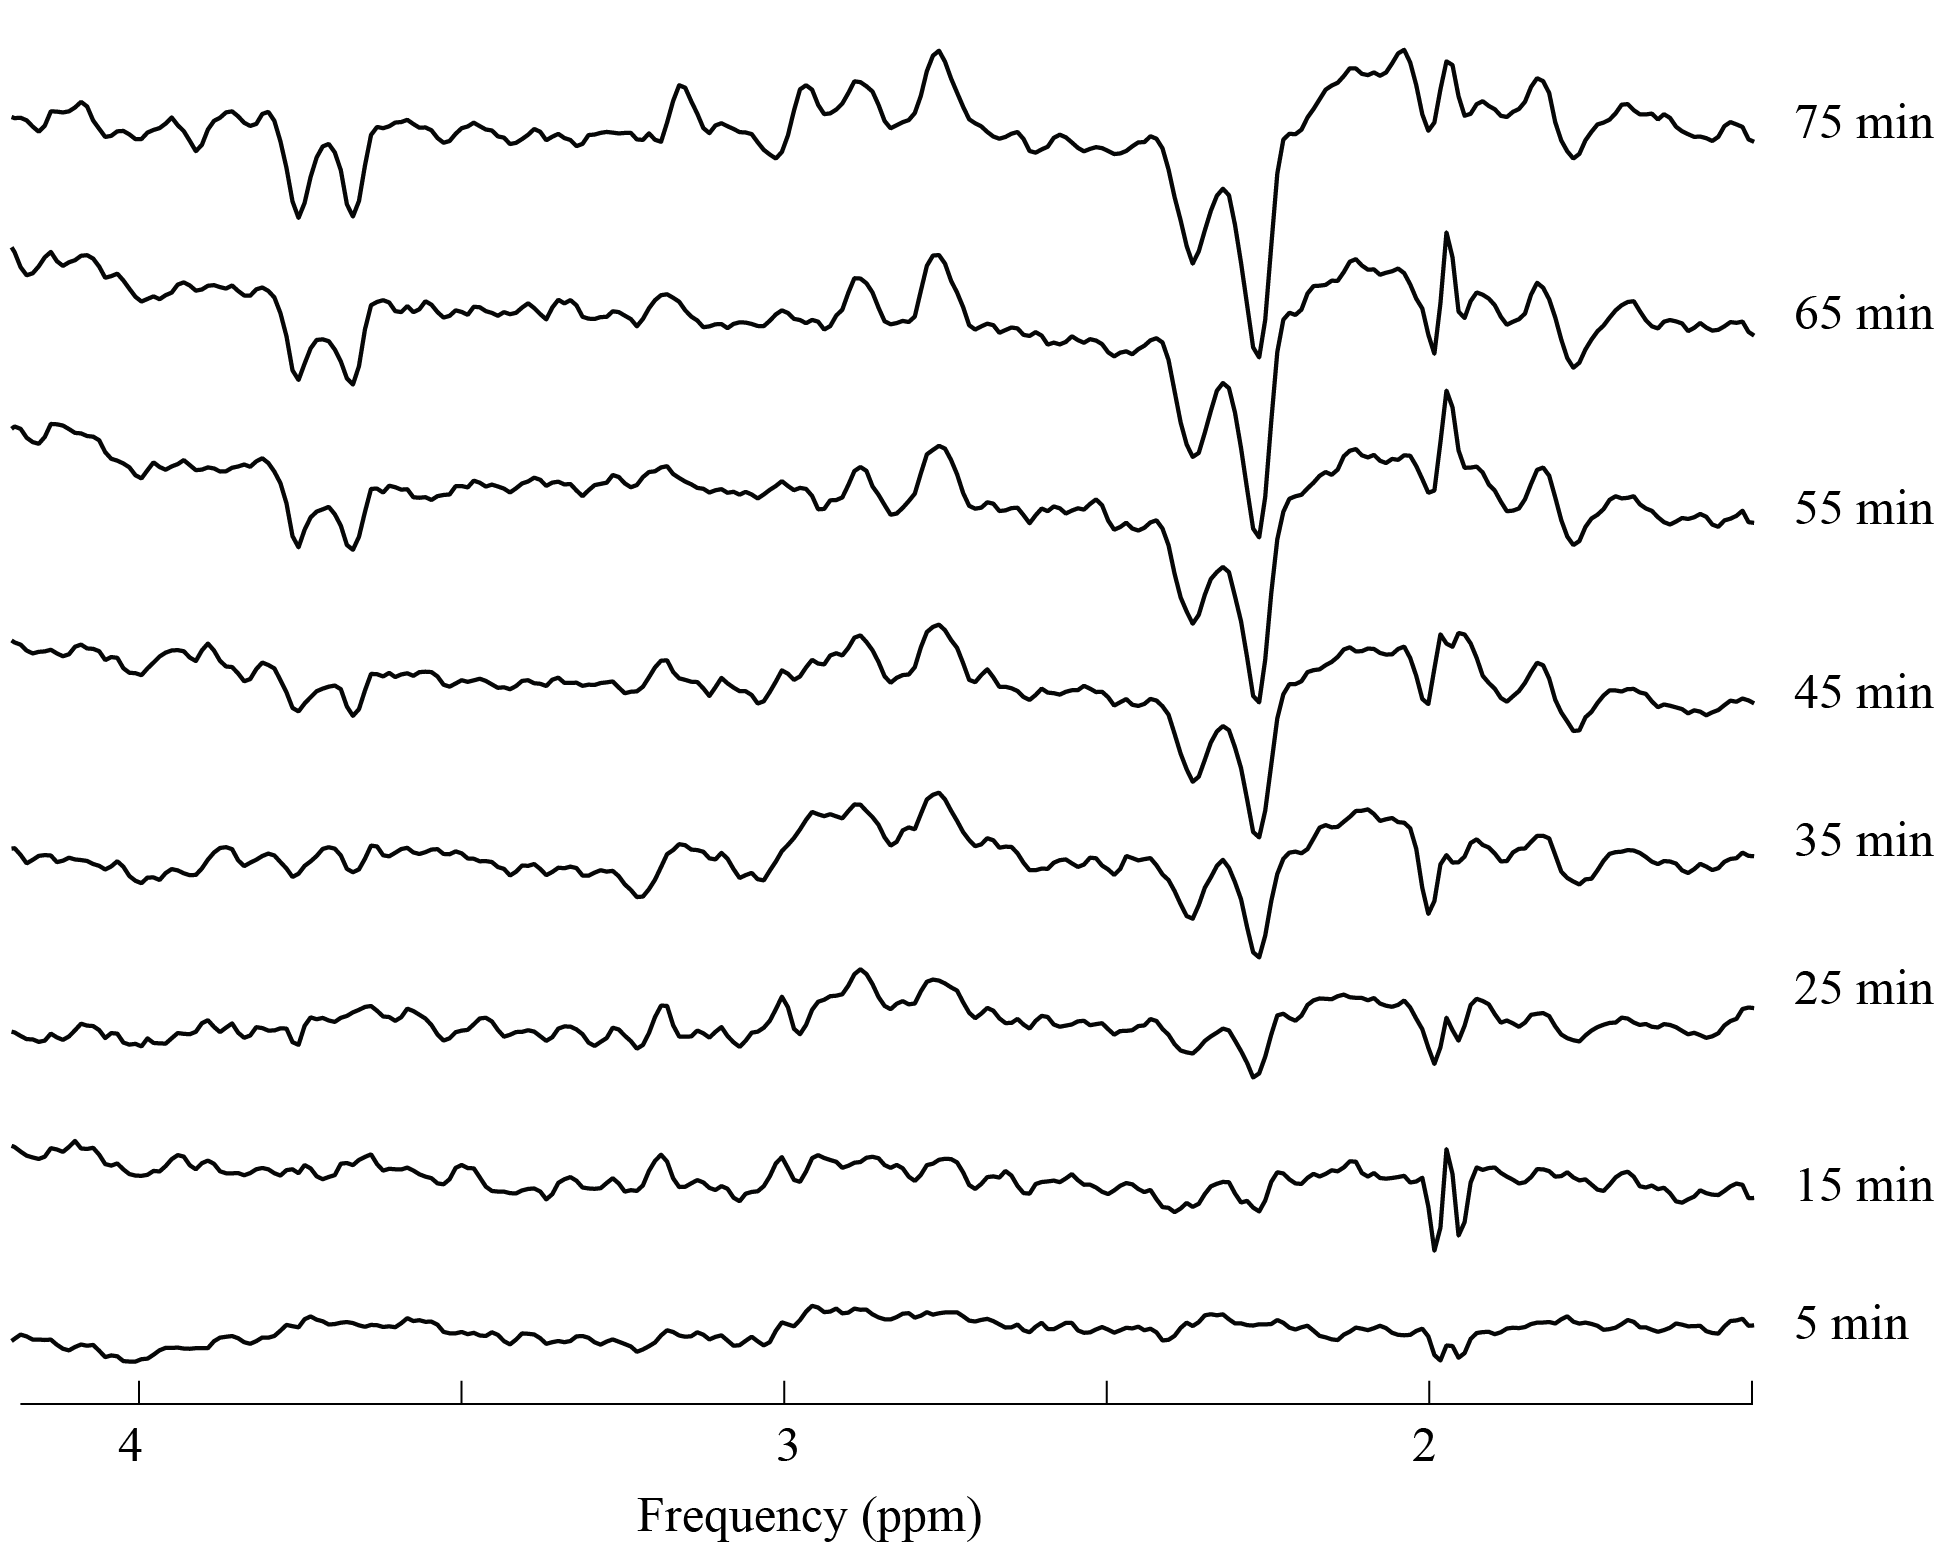
when the 12C-H3 of GABA resonance is split due to 13C coupling). Fig.3 shows the time-series of labeled-difference
spectra obtained by the subtraction of the baseline difference spectrum from
post-infusion time-series spectra. As expected, a clear decrease in
signal from 12C-bonded protons and an increase
in signal from 13C-coupled protons was observed for Glu. However, labeling
of GABA was not obvious. In particular, no appreciable reduction in the 3.0 ppm
GABA signal was observed, indicating minimal labeling at C3 and C4 positions
of GABA (Fig3). The LCModel fit of the final post-infusion labeled-difference
spectra, along with the fit residuals and the estimated fit components for Glu
labeled at positions C4, C3, C2 and GABA labeled at positions C2 and C3 are
shown in Fig.4. The turnover curves of total FE of Glu and GABA are shown in Fig.5.
At the end of the acquisition, the total FEs of Glu and GABA were 27 % and 8 %,
respectively.
Discussion
In
the present study, we demonstrate the use of MEGA-PRESS editing sequence to
follow the fate of 13C label from infused [1-13C] glucose
in the human brain, in the absence of complicated hardware and heteronuclear decoupling
RF pulses. The presence of the 13C
label uptake was clearly detectable in Glu, owing to the pronounced
effect of heteronuclear (13C-1H) scalar coupling on the
observed 1H spectra. However, the FE of GABA was lower than
expected. This finding leads us to question the degree to which the 3.0 ppm MEGA-PRESS
GABA resonance truly reflects GABA that is synthesized from glucose via Glu. Conclusion
These preliminary results suggest
that MEGA-PRESS editing sequence has the potential to clearly detect the
conversion of 13C labeled glucose into Glu in the brain.
However, detection of GABA labelling using this approach remains a work in
progress.Acknowledgements
We would like to thank Holly Newbold-Fox for her assistance with the infusion and MR scanning. This work is supported by the National Engineering and Sciences Research Council (NSERC, RGPIN-2014-06072, J.N.), and the Fonds de recherche du Quebec – Santé (FRQS, J.N.).References
- Puts NAJ, Edden RAE. In vivo magnetic resonance spectroscopy of GABA: a methodological review. Prog Nucl Magn Reson Spectrosc. 2012;60:29–41.
- Meldrum BS. Glutamate as a neurotransmitter in the brain: review of physiology and pathology. J Nutr. 2000;130:1007S-15S.
- Bak LK, Schousboe A, Waagepetersen HS. The glutamate/GABA-glutamine cycle: aspects of transport, neurotransmitter homeostasis and ammonia transfer. J Neurochem. 2006;98(3):641–53.
- Calvetti D, Somersalo E. Ménage à trois: the role of neurotransmitters in the energy metabolism of astrocytes, glutamatergic, and GABAergic neurons. J Cereb Blood Flow Metab. 2012;32(8):1472–83.
- Tkác I, Starcuk Z, Choi IY, Gruetter R. In vivo 1H NMR spectroscopy of rat brain at 1 ms echo time. Magn Reson Med. 1999;41(4):649–56.
- Near J, Evans CJ, Puts NA, Barker PB, Edden RA. J-difference editing of GABA: simulated and experimental multiplet patterns. J Soc Magn Reson Med. 2013;70(5).
- Simpson R, Devenyi GA, Jezzard P, Hennessy TJ, Near J. Advanced processing and simulation of MRS data using the FID appliance (FID-A)-An open source, MATLAB-based toolkit. Magn Reson Med. 2017;77(1):23–33.
- Boumezbeur F, Besret L, Valette J, Vaufrey F, Henry P-G, Slavov V, et al. NMR measurement of brain oxidative metabolism in monkeys using 13C-labeled glucose without a 13C radiofrequency channel. Magn Reson Med. 2004;52(1):33–40.
Figures