1062
Optimization of 1H Single Voxel Multi-Parametric Spectroscopic Fingerprinting (MRSF)1Chemical and Biological Physics, Weizmann Institute of Science, Rehovot, Israel
Synopsis
Brain metabolite T1 and T2 have diagnostic value and per-subject knowledge of both metabolite and water reference T1, T2 is necessary for accurate metabolite absolute quantification. Here we optimize the excitation schedules of our recently-proposed magnetic resonance spectroscopic fingerprinting (MRSF) sequence to accurately estimate metabolite T1 and T2. We computationally evaluate the optimized schedules using Monte-Carlo simulations, as well as phantom and in-vivo experiments.
Introduction
Brain metabolite concentrations and relaxation values (T1, T2) can change in various pathologies. Not only do such relaxation changes have diagnostic value1, but accurate per-subject knowledge of both metabolite and water reference T1, T2 is necessary for metabolite absolute quantification. Our recently proposed spectroscopic fingerprinting (MRSF) framework2 can simultaneously quantify concentrations, T1, T2 and B1+ values of metabolite within clinical scan times. Here we numerically optimized the MRSF schedule to further improve T1, T2, B1+ estimation. We also investigated the tradeoffs between schedule length and signal to noise (SNR). Results are presented for phantoms and healthy volunteers.Methods
Optimization Variables: We’ve optimized the flip angle of the first pulse (FA), TR and TE for a PRESS-based fingerprinting sequence, for N consecutive excitations. Discrete values for FA= [0:5:150 deg.], TR= [900:10:1600 ms] and TE= [35:5:120 ms] were used. Nine schedule lengths were explored (N=5, 10, 15, 20, 25, 50, 60, 75 and 100), while keeping the SNR per unit time fixed.
Algorithm: Optimization was done using Matlab 2017a’s genetic algorithm toolbox (The Mathworks, Natick, MA). To avoid local minima 2000 starting populations were initialized in four separate optimization runs. Uncoupled singlets were assumed, simulated using the Bloch equations. All spins were driven into dynamic equilibrium.
Target function: A normalized root mean square error, averaged across a range of typical in‑vivo T1 and T2 ($$$T1\in{[750-1650]} ms$$$, $$$T2\in{[125-375]} ms$$$), was calculated ($$$\sqrt{bias^2+std^2} = \overline{RMSE} $$$). For simplicity, radiofrequency transmission was assumed homogeneous (B1+=1). $$$\overline{RMSE}$$$ was evaluated using Monte-Carlo simulations with 1000 different noise realizations, assuming the SNR from a single 90° excitation of fully relaxed magnetization was SNRexc=15. To avoid schedules which lead to excessive SNR loss, an additional penalty was added in the form of $$$P=1-(S^{mean}/S^{max}$$$) were $$$S^{mean}$$$ defined as the sum of all excitation in the schedule and $$$S^{max}$$$ defined as the maximal possible signal without any T1 or T2 weighting. The target function was $$$\overline{RMSE}+P$$$ .
Schedule evaluation: Once optimized, Monte-Carlo simulations were used to estimate each schedule’s bias (accuracy) and standard deviation (precision) over a range of T1, T2 and B1+ values found in‑vivo ($$$T1\in{[750-1650]} ms$$$, $$$T2\in{[125-375]} ms$$$ and $$$B_{1+}=1$$$) using SNRexc=10.The sum of the averaged bias and accuracy values was used to assess each schedule’s performance, using a single number.
Phantom experiments: The reproducibility of the optimal schedule was assessed in a 3.375 mL voxel using a homogeneous spherical phantom containing a water solution with metabolites at brain concentrations (NAA: 12.5 mM, T1/T2=830/630 ms; Cr: 10 mM, T1/T2=600/400 ms; Cho: 2 mM, T1/T2=430/340 ms; water T1/T2=625/422 ms). The phantom was scanned 18 times and for every 3 scans the phantom was repositioned and reshimmed. Water relaxation was estimated by running the schedule once without water suppression; the resulting non stead state fingerprint was used for water T1 and T2 estimation. The total scan time was 6 min. The CVs of NAA, Cr, Cho and water T1 and T2 were quantified.
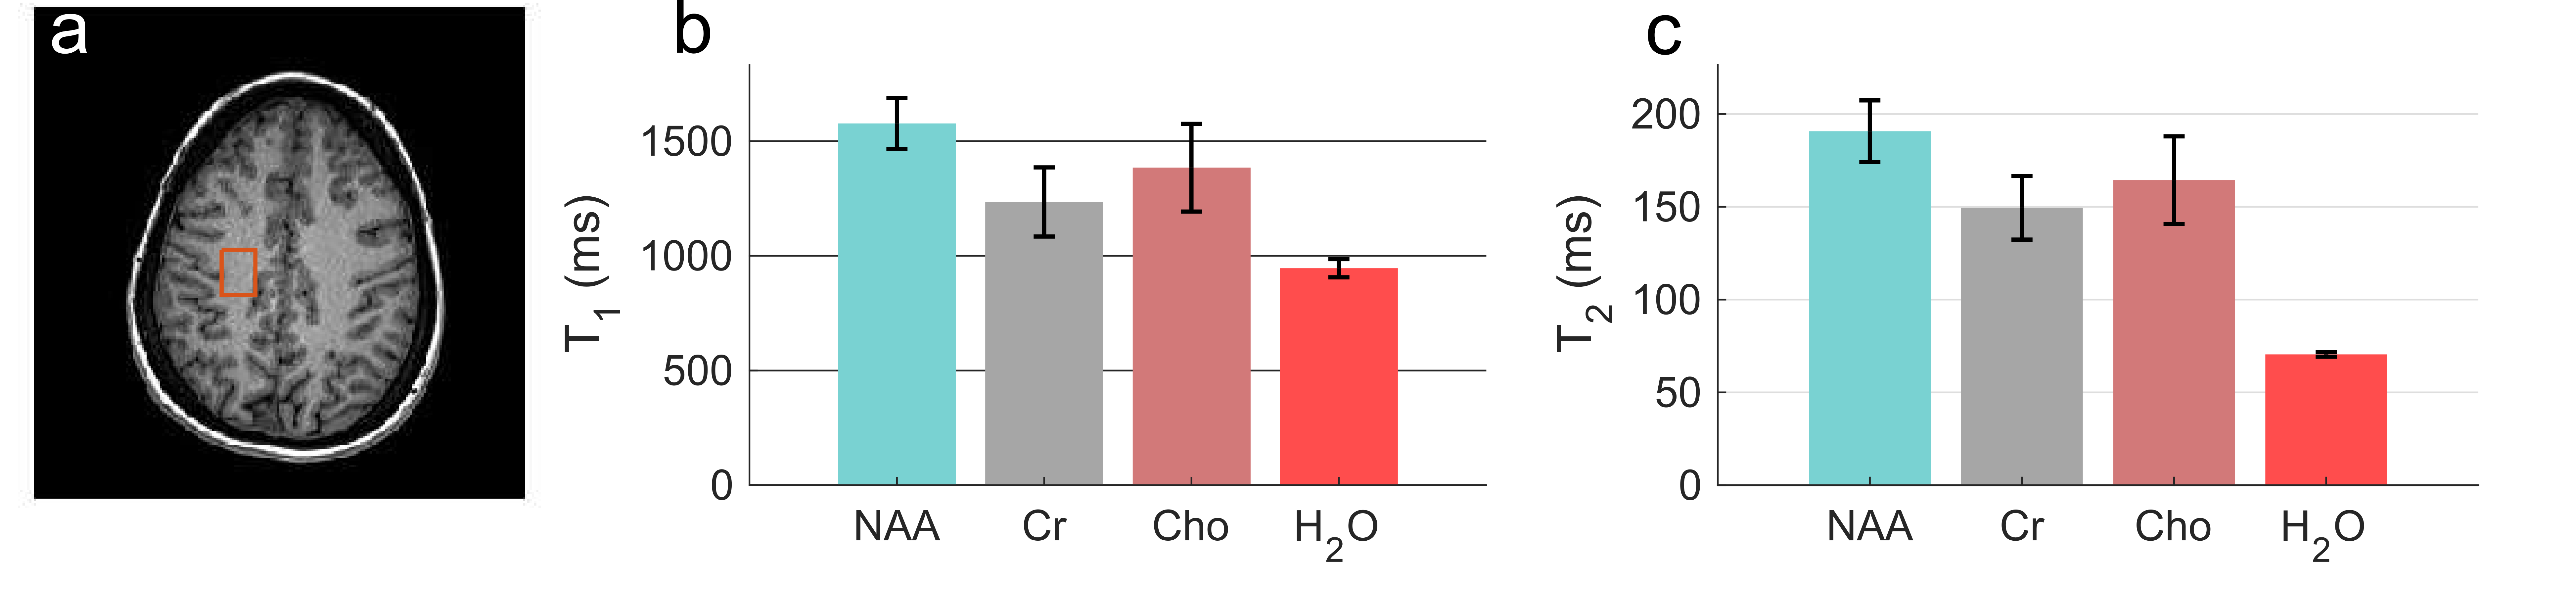
In-vivo experiments: Reproducibility of the optimal schedule was assessed in two volunteers, scanned 10 times each. Spectra were collected from a 4.5 ml voxel placed in parietal white matter (Fig. 4a). Total scan time was fixed at 6 minutes.
Results
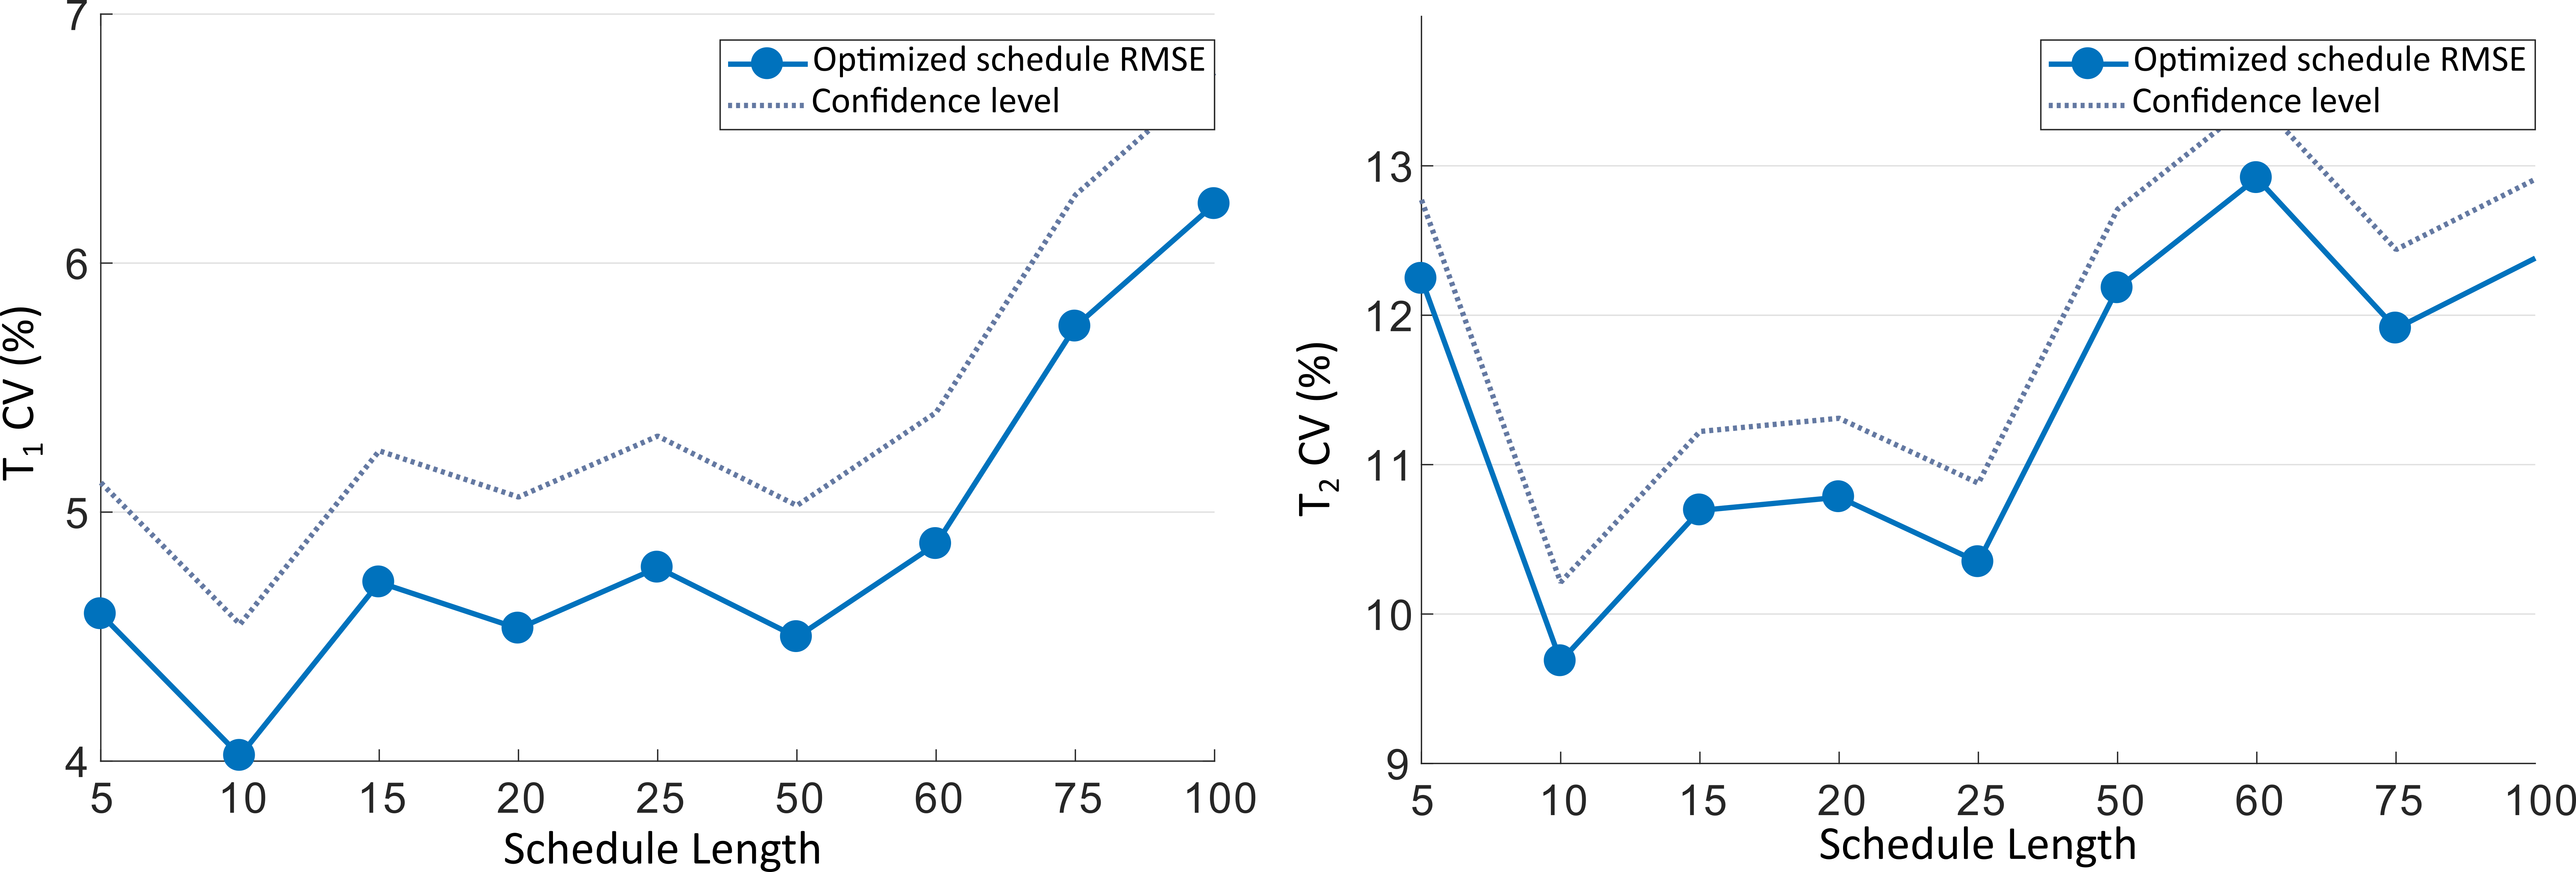
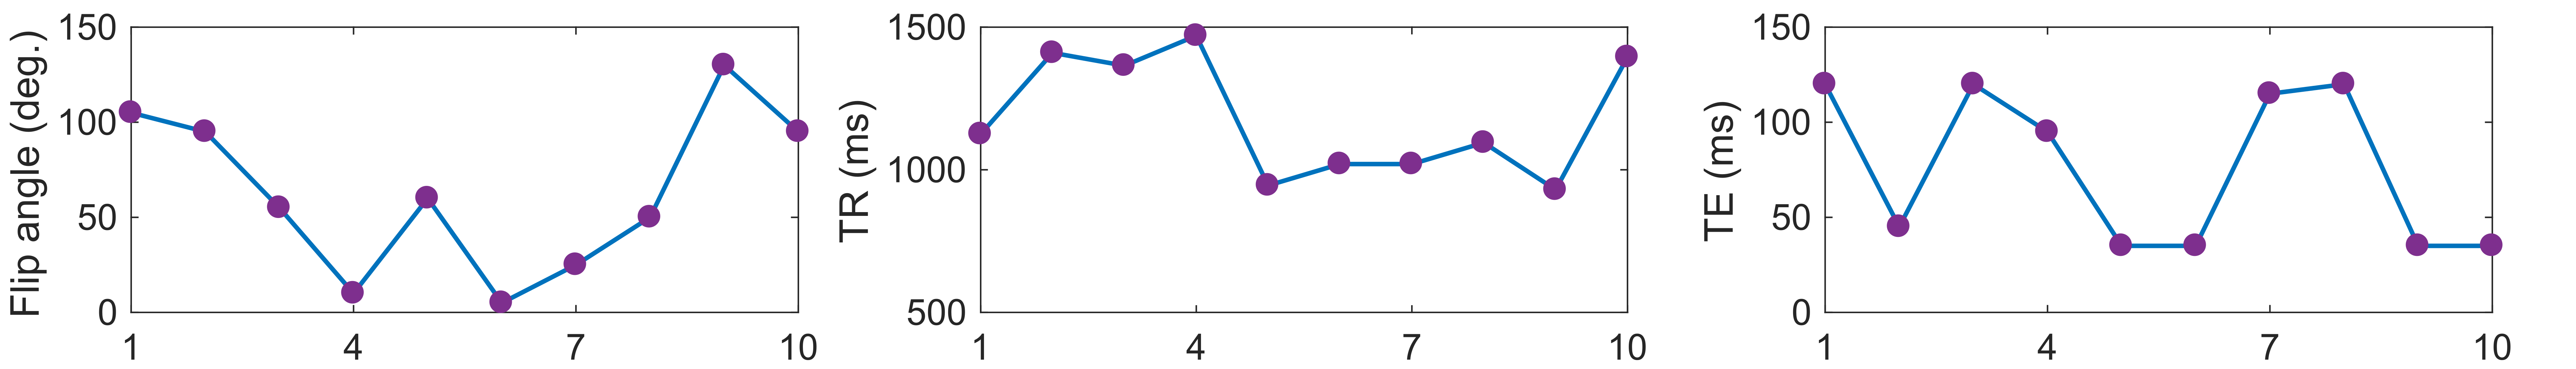
Optimization: Figure 1 plots the CV for T1 and T2 as a function of schedule length after optimization. The schedule with the optimal CV required only 10 excitations. The optimized FAs, TRs and TEs found are plotted in Figure 2.
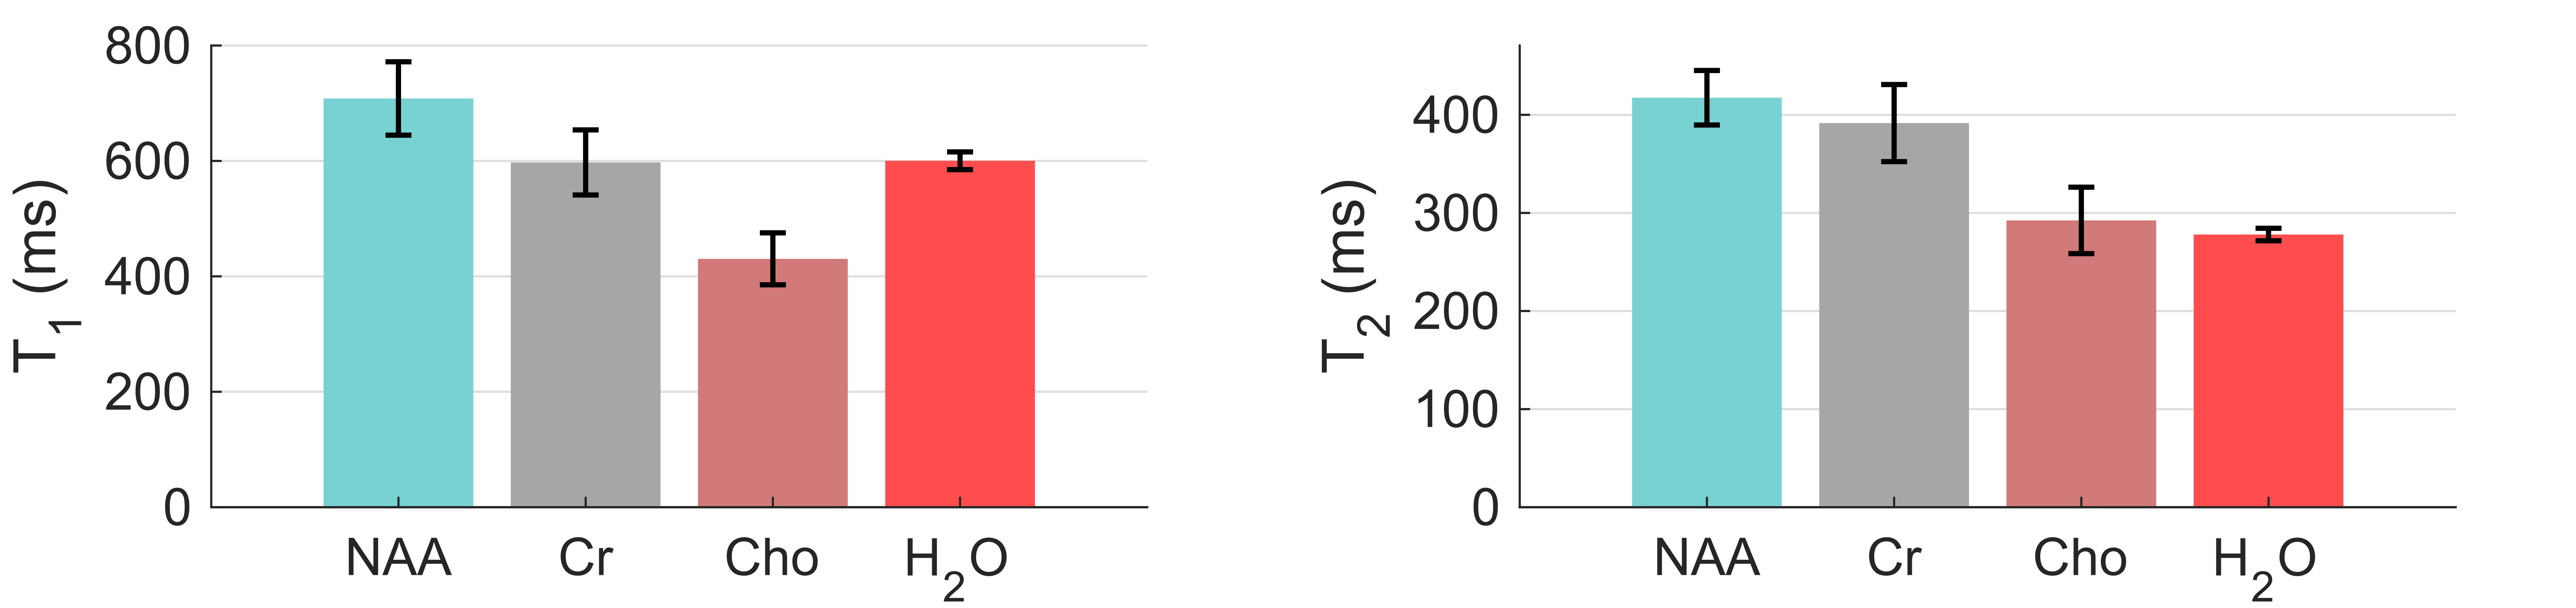
Phantom: Phantom reproducibility show CV of 7% and 3% for metabolite and water T1 estimation (figure 3 left). T2 CV was 9% and 2% for metabolite and water (figure 3 right).
In-vivo: In-vivo average T1 CV was 11% and 4% (figure 4b) and T2 average CV was 11% and 2% (figure 4c) for metabolites and water.
Discussion
Our computer simulations indicate that, for the same total acquisition time, short schedules (with more averages) produce more accurate and precise T1 and T2 estimations. Short schedules have other substantial advantages: they are easier to compute, optimize and can be applied to other lengthy acquisitions such as 2D NMR or spectroscopic imaging.
We optimized schedule and schedule length to reduce T1 and T2 estimation errors. Optimal schedule was tested in phantom and in-vivo to produce small estimation errors within clinical time scale, as was expected by Monte-Carlo simulations.
Acknowledgements
This work was supported by the Minerva Foundation. Assaf Tal acknowledges the support of the Monroy-Marks Career Development Fund and the historic generosity of the Harold Perlman Family.References
[1] II Kirov et al, Radiology 254(3):858-866 (2010);
[2] Kulpanovich A. and Tal A .NMR in Biomedicine 31.11 (2018): e4001;
Figures