1059
Subcortico-centric view of macaque neocortical organization investigated using resting-state fMRI1Center for Biosystems Dynamics, RIKEN, Kobe, Japan, 2Sumitomo Dainippon Pharma Co., Ltd, Osaka, Japan, 3Department of Neuroscience, Washington University in St. Louis, St. Louis, MO, United States, 4Department of Radiology, Washington University in St. Louis, St. Louis, MT, United States
Synopsis
An important aspect to understand evolutionary differences across primate species is through conserved subcortical circuitry and diversification of neocortical inputs. Here, we explore neocortical profiles of major subcortical structures using ‘Human Connectome Project-style’ resting-state functional MRI (rfMRI) connectivity in alert and anesthetized macaque monkeys. Our results reveal that the major subcortical “limbic and associative” structures have largely overlapping neocortical rfMRI connectivity profiles. These findings suggest important differences relative to previous reports of functional connectivity profiles in humans, and may provide a valuable clue to the evolution of human brain function and behavior in the primate lineage.
Introduction
The organization of subcortical structures and their interconnections are thought to be largely preserved throughout primate evolution1,2,3. In contrast, neocortex, which is the origin of many subcortical inputs, has gone through differential areal expansion in the human lineage4,5. Thus, it is important to understand evolutionary differences across species through conserved subcortical circuitry and diversification of neocortical inputs3. To obtain insight into these evolutionary changes, we take a subcortico-centric view of macaque neocortical organization and explore major subcortical structures using resting-state functional MRI (rfMRI) connectivity in macaque monkeys, both awake and anesthetized.Methods
Macaque (awake N=2 and anesthetized N=30) experiments were performed in a 3 T MRI scanner (MAGNETOM Prisma, Siemens, Erlangen, Germany) equipped with 80 mT/m gradients in combination with a custom-made 24-channel macaque coil. We used ‘HCP-style’ data acquisition6,7 customized for the macaque. In brief, anatomical images were acquired using T1w MPRAGE (0.5 mm isotropic, TI 900 ms, TR 2200 ms) and T2w SPACE (0.5 mm isotropic, TE 562 ms, TR 3200 ms, GRAPPA 2). Awake cerebral blood volume (CBV)-weighted (MION 12 mg/kg) rs-fMRI was acquired with gradient-echo EPI (1.25 mm isotropic, TE 16 ms, TR 755 ms, multiband factor 2, iPAT 2 and 40 min per animal) and anesthetized-state (isoflurane + dexmedetomidine ) using blood oxygen level dependent (BOLD) rs-fMRI was acquired with 1.25 mm isotropic, TE 30 ms, TR 755 ms, multiband factor 5 and 102 min per animal. Data analysis used the HCP pipelines with some customization for non-human primate pipelines4,6, including FreeSurfer cortical surface modeling and subcortical segmentation. The data was processed into standard grayordinates (164k and 10k for structural and fMRI, respectively) in the CIFTI format. Myelin maps were generated based on the T1w/T2w ratio, bias field corrected and averaged across subjects (N=30). The rfMRI was denoised using sICA+FIX for structural artefacts, and the wishart filtering approach (WF=7) for unstructured noise7,8. The dense connectome (dconn) and parcellated connectome9 (average timeseries in ROI were calculated. In anesthetized macaques, cross-correlation was calculated between subcortical parcels and dense cortical timeseries (i.e. pdconn) whereas for the two awake macaques, to boost subcortical signal-to-noise ratio, we limited the analysis to the parcellated connectome (i.e. pconn). A basic two-part subdivision of the dense connectome was generated using fuzzy c-means clustering (number of clusters=2, exponent of fuzzy partition matrix=1.2, MATLAB Fuzzy Logic Toolbox).Results
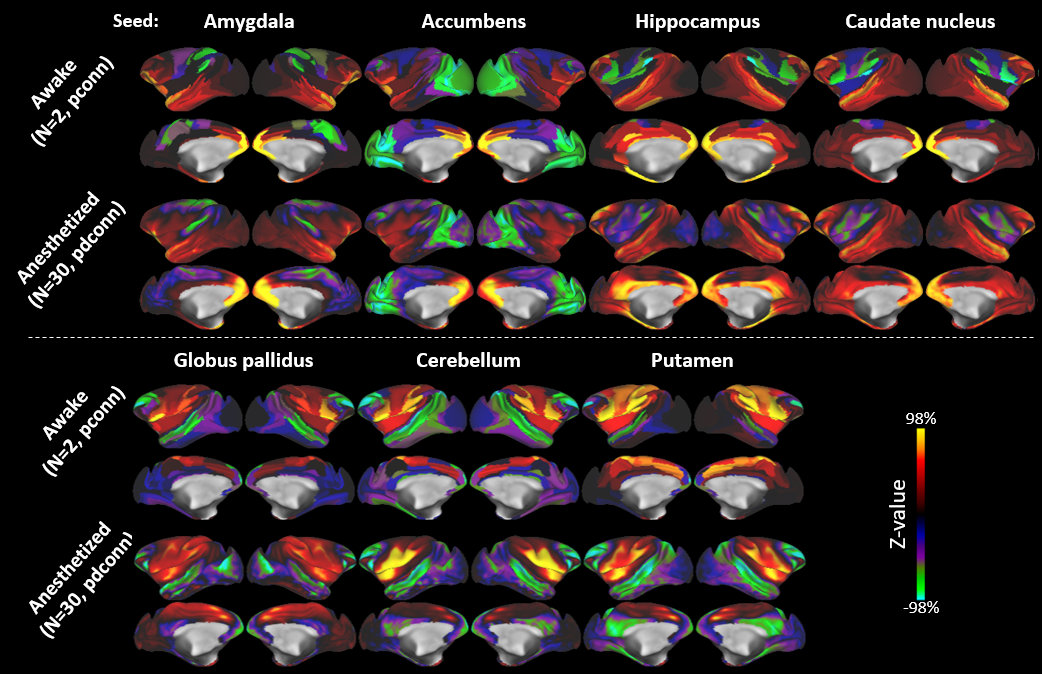
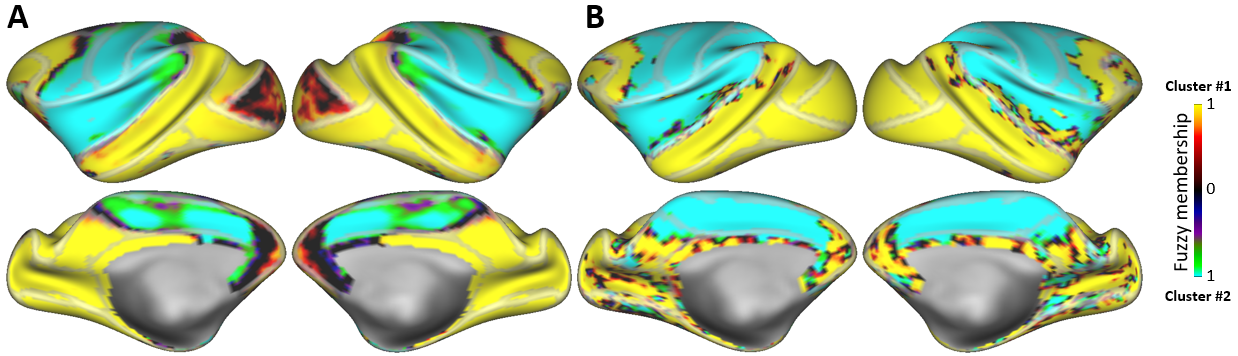
Neocortical rfMRI connectivity profiles of major FreeSurfer-generated macaque subcortical structures are shown in Figure 1. The correlation maps for four “associative” subcortical domains (amygdala, accumbens, hippocampus and caudate nucleus) strongly correlated and overlapped over large portions of neocortex. The predominantly sensorimotor community (bottom row: globus pallidus, putamen and cerebellum) also shows a high degree of spatial overlap but these are strongly anticorrelated with associative neocortical connectivity profiles. This dichotomy is supported by a fuzzy (soft) C-means clustering using all brain greyordinate edges (n=26,020, edges=2.7× 10⁹). At a clustering level of 2, the division between association and sensorimotor communities is, indeed, the dominant feature of the macaque network (Fig. 2a). This community division closely follows the boundaries of the putamen neocortical connectivity profile including the ventral margins of the Sylvian fissure and of posterior cingulate cortex. However, in medial prefrontal cortex the transition of community membership is graded. A similar community subdivision appears also in the awake state (Fig. 2b).
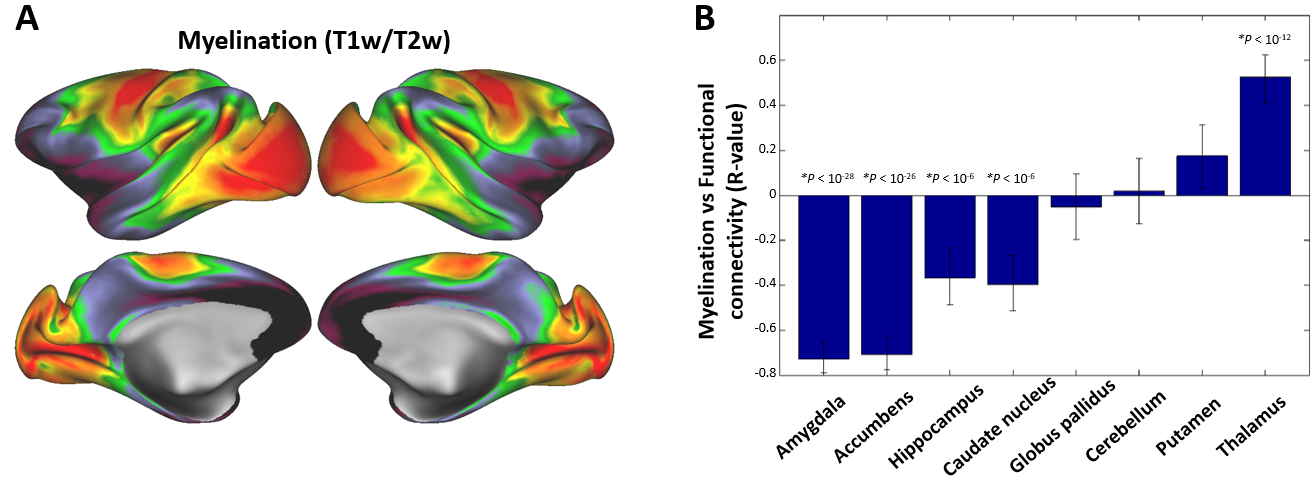
We also examined the association between myelination and subcortico-neocortical functional connectivity, as cortical myelin content provides a useful indicator of transitions between associative and sensorimotor regions4,6. Indeed, rfMRI connectivity from associative subcortical structures were highly anticorrelated with myelination (i.e. amygdala R=-0.73, accumbens R=-0.71, hippocampus R=-0.37 and caudate nucleus R=-0.40) whereas no significant association was found between myelination and cerebellar-putamen functional connectivity (Fig. 3b).
Discussion & conclusions
We found that four major subcortical association structures have largely overlapping neocortical rfMRI connectivity profiles. These results support the anatomically derived concept of parallel and densely distributed association networks in macaque9,10,11. Notably, the sensorimotor community (putamen, globus pallidus and cerebellum), overlaps with corticopontine projections12. Most of the macaque neocortex appears to be divided between these two distinct communities which in turn may be associated with distinct fiber systems of basal ganglia: striatopallidal (putamen) and striatonigral (caudate nucleus)13. The cluster boundaries also support the association/sensorimotor area boundaries derived using myelin maps and tractography4,5. Taken together, these macaque functional connectivity profiles are quite distinct from previous reports of functional connectivity profiles in humans, and may provide valuable insights regarding unique human behaviors in the primate lineage.Acknowledgements
This research is partially supported by the program for Brain/MINDS and Brain/MINDS-beyond from Japan Agency for Medical Research and development, AMED (JP18dm0207001, JP18dm0307006), by RIKEN Compass to Healthy Life Research Complex Program from Japan Science and Technology Agency, JST, by MEXT KAKENHI Grants 16H03300, 16H03306, 16H01626 and 15K12779 (TH), NIH F30 MH097312 (MFG) and RO1 MH-60974 (DCVE)References
1. Allen TA, Fortin NJ, The evolution of
episodic memory. PNAS 2013;110:10379–10386.
2. Insausti R, Comparative anatomy of the
entorhinal cortex and hippocampus in mammals. Hippocampus 1993;3:19–26.
3. Manns JR, Eichenbaum H, Evolution of declarative memory. Hippocampus 2006;6:795–808.
4. Donahue CJ, Glasser MF, Preuss TM, et al. Quantitative assessment of prefrontal
cortex in humans relative to nonhuman primates. PNAS 2018;115:22.
5. Glasser MF, Goyal MS, Preuss TM, et al. Trends and properties of human cerebral cortex:
Correlations with cortical myelin content. NeuroImage 2014;93:165–175.
6. Glasser MF, Sotiropoulos SN, Wilson JA, et al. The minimal preprocessing
pipelines for the Human Connectome Project. NeuroImage 2013;80:105–124.
7. Glasser MF, Smith SM, Marcus DS, et al. The Human Connectome Project’s
neuroimaging approach. Nature Neuroscience 2016;19:1175–1187.
8. Glasser MF, Coalson TS, Bijsterbosch JD, et al.
Using temporal ICA to selectively remove global noise while preserving global
signal in functional MRI data. Neuroimage 2018;181:692–717.
9. Markov NT, Misery P, Falchier A, et al. Weight Consistency Specifies Regularities of
Macaque Cortical Networks Cereb. Cortex 2011;21:1254–1272.
10. Selemon LD, Goldman-Rakic PS. Common cortical and subcortical targets of the dorsolateral prefrontal and posterior parietal cortices in the rhesus monkey: evidence for a distributed neural network subserving spatially guided behavior. J. Neuroscience 1998;8:4049–406.
11. Yeo T, Krienen BT, Sepulcre FM, et al. The organization of the human cerebral cortex estimated by intrinsic functional connectivity. Journal of Neurophysiology 2011;106:1125–1165.
12. Glickstein M, May JG, Mercier BE,
Corticopontine projection in the macaque: The distribution of labelled cortical
cells after large injections of horseradish peroxidase in the pontine nuclei.
Journal of Comparative Neurology 1985;235:343–359.
13. Parent A, Bouchard C, Smith Y, The
striatopallidal and striatonigral projections: two distinct fiber systems in
primate. Brain Research 1984;303:385–390.
Figures