1058
Multilevel functional organization of the mouse lemur primate brain1Commissariat à l’Energie Atomique et aux Energies Alternatives (CEA), Direction de la Recherche Fondamentale (DRF), Institut François Jacob, MIRCen, Fontenay-aux-Roses, France, 2Centre National de la Recherche Scientifique (CNRS), Université Paris-Sud, Université Paris-Saclay UMR 9199, Neurodegenerative Diseases Laboratory, Fontenay-aux-Roses, France
Synopsis
Resting state networks have been characterized in numerous mammals covering human, non-human primates, dogs, rabbits and rodents, though only ever at single semi-arbitrary levels of complexity. In humans, resting state networks analyses have been extended to extracting networks of varying complexity, representing different levels of a possible “functional hierarchy”. We performed the first study of “functional hierarchy” in animals. We focused on the gray mouse lemur (Microcebus murinus), a small primate attracting increased attention as a model for cerebral and age-related disorders.
Introduction
In humans, resting state network (RSN) analyses have extracted networks of varying complexity ranging from focal to multiregional networks. Integration of these multiscale networks represents different levels of a possible “functional hierarchy” [1]. RSNs have also been characterized in numerous other mammals covering rodents, rabbits, dogs and non-human primates (NHPs), though only ever at single semi-arbitrary levels of complexity.
The gray mouse lemur (Microcebus murinus) is a small NHP attracting increased attention as a model for cerebral and age-related disorders. RSNs have never been described for this species. The aim of this study was to characterize RSNs in the mouse lemur using a systematic exploration of their brain networks at different scales and by using data-driven methods.
As a first step, we focused on the identification of elementary/focal functional clusters and built a 3D functional atlas of the mouse lemur brain. Secondly, large scale networks were identified with data-driven dictionary learning and modularity graph analysis. Similar networks were identified with the two methods, which suggests reliability of network identification. In particular, a default-mode-like and a fronto-temporal network were identified. Focal clusters were mostly embedded in large scale networks, which suggests for the first time the identification of a neural network “functional hierarchy” in animals.
Materials and methods
Animal preparation
Resting state functional MRI data were recorded in 14 mouse lemurs, the largest number of NHPs ever used for an RSN study. Animals were scanned twice each, six months apart. All scans were recorded under isoflurane anesthesia at 1.25-1.5% in air (with respiratory rate monitored to control animal stability) using an 11.7 T Bruker BioSpec system.
MRI data acquisition
Anatomical images were acquired using a T2-weighted multi-slice multi-echo (MSME) sequence: TR=5000ms, TE=17.5ms, FOV=32×32mm, 75 slices of 0.2mm thickness, 6 echoes, 5ms inter-echo-time, resolution=200 µm isotropic, acquisition duration 10min. Resting state time series data were acquired using a gradient-echo echo planar imaging (EPI) sequence: TR=1000ms, TE=10.0ms, flip angle=90°, repetitions=450, FOV=30×20 mm, 23 slices of 0.9 mm thickness and 0.1 mm gap, resolution=312.5×208.33×1000µm, acquisition duration 7m30s.
MRI preprocessing
Spatial preprocessing was performed using the python module sammba-mri (SmAll MaMmals BrAin MRI; http://sammba-mri.github.io) which, using nipype for pipelining [2], leverages AFNI [3] for most steps and RATS [4] for brain extraction. Anatomical images were mutually registered to create a study template, which was further registered to an anatomical mouse lemur template [5].
Results
Identification of local functional clusters based on dictionary learning
Multi-subject dictionary learning [6] was performed using Nilearn [7] on preprocessed resting state functional MR images. During a pilot investigation, several analyses were performed using 10, 15, 20, 30, 35, 40, 45, 50 and 60 sparse components (SCs). The 35-component analysis produced either single local functional clusters or local functional clusters that were symmetrical across the sagittal plane. Each component was manually classified and annotated (Fig. 1). We then used the clusters identified by the 35-component analysis to create a 3D functional atlas, extracting 48 local regions (27 cortical, 21 subcortical; Fig. 2).
Graph analysis of functional modules and hub regions
The 48 functional regions identified with the dictionary learning analysis were used as nodes, interconnected via edges in the analysis of large-scale functional connectivity based on graph theory (Fig 3). Correlation matrices were calculated using the region to region partial correlation coefficients obtained from the 28 mouse lemur time series. The high Q value (Q=0.428) suggests a prominent modular structure of intrinsic connectional architecture and was associated with the clusterization of the matrix into 6 modules.
Identification of large scale networks based on dictionary learning
We then investigated whether larger scale, widespread networks could be identified in mouse lemurs with dictionary learning. The number of components extracted from the data (n=6) was automatically obtained from the previous matrix modules identification. Dictionary learning confirmed the accuracy of the results by revealing bilateral networks that included several regions spread over the whole brain (Fig. 4) and corresponding to the previously described modules organization. Finally, network composition was characterized by integrating the local functional clusters into their large-scale functional networks (Fig. 5).
Conclusion
In summary, our study provides the first characterization of functional networks in mouse lemur primates. This work will lay the foundations for future studies of RSNs in NHPs either under unanesthetized conditions or to assess the impact of various cerebral pathologies on brain disorganization.Acknowledgements
France-Alzheimer Association, Fondation Plan Alzheimer, Banque Publique d’Investissement (ROMANE program).References
1. Smith, S.M., et al., Correspondence of the brain's functional architecture during activation and rest. Proc Natl Acad Sci U S A, 2009. 106(31): p. 13040-5.
2. Gorgolewski, K., et al., Nipype: a flexible, lightweight and extensible neuroimaging data processing framework in python. Front Neuroinform, 2011. 5: p. 13.
3. Cox, R.W., AFNI: software for analysis and visualization of functional magnetic resonance neuroimages. Comput Biomed Res, 1996. 29(3): p. 162-73.
4. Oguz, I., et al., RATS: Rapid Automatic Tissue Segmentation in rodent brain MRI. J Neurosci Methods, 2014. 221: p. 175-82.
5. Nadkarni, N.A., et al., A 3D population-based brain atlas of the mouse lemur primate with examples of applications in aging studies and comparative anatomy. Neuroimage, 2018. 185: p. 85-95.
6. Arthur Mensch, Gaël Varoquaux, and B. Thirion, Compressed Online Dictionary Learning for Fast Resting-State fMRI Decomposition. International Symposium on Biomedical Imaging, 2016: p. pp.1282-1285.
7. Abraham, A., et al., Machine learning for neuroimaging with scikit-learn. Front Neuroinform, 2014. 8: p. 14.
8. Bons, N., et al., A stereotaxic atlas of the grey lesser mouse lemur brain (Microcebus murinus). Brain Res Bull, 1998. 46(1-2): p. 1-173.
9. Brodmann, K., Vergleichende Lokalisationslehre der Grosshirnrinde in ihren Prinzipien dargestellt auf Grund des Zellenbaues. 1909.
10. Vincent, J.L., et al., Intrinsic functional architecture in the anaesthetized monkey brain. Nature, 2007. 447(7140): p. 83-6.
11. Belcher, A.M., et al., Large-scale brain networks in the awake, truly resting marmoset monkey. J Neurosci, 2013. 33(42): p. 16796-804.
12. Hutchison, R.M., et al., Functional networks in the anesthetized rat brain revealed by independent component analysis of resting-state FMRI. J Neurophysiol, 2010. 103(6): p. 3398-406.
Figures
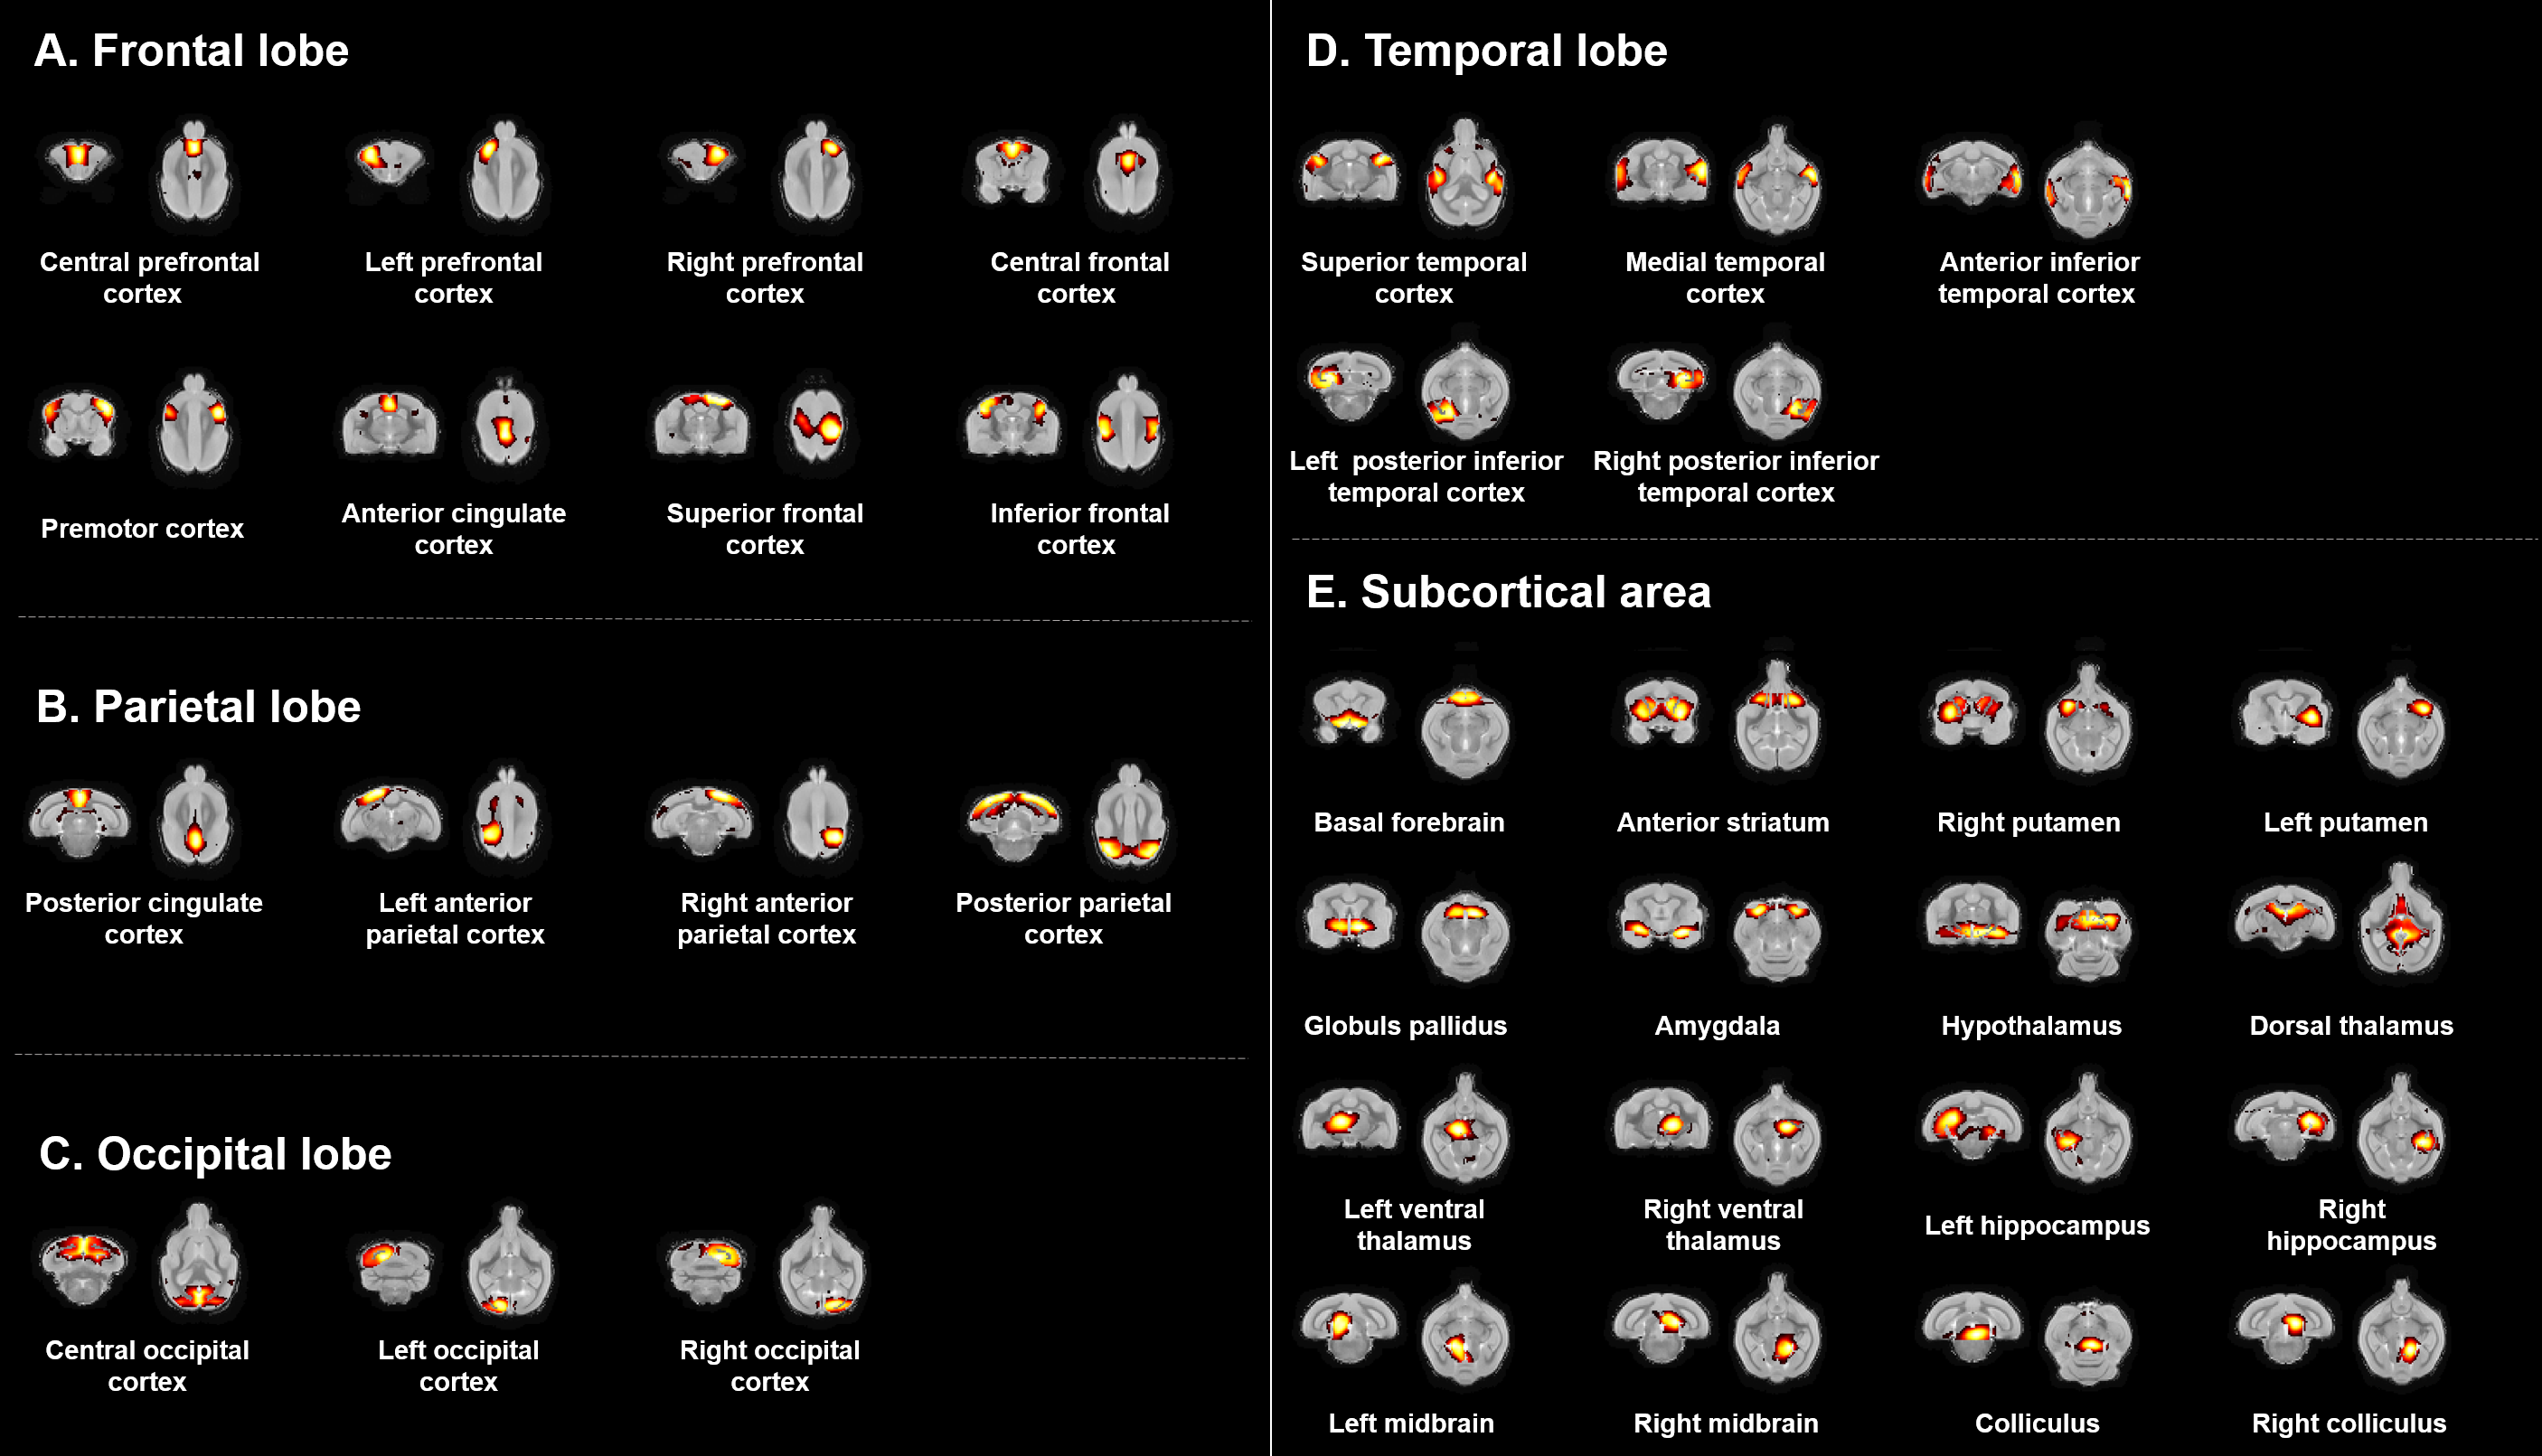
Components identified following 35-component dictionary learning in mouse lemurs.
Networks are shown in coronal and axial views with an automatic slice selection based on the center of mass of each component. Each component was manually classified and annotated using various MRI [5] and a histological [8] lemur atlases as well as atlases reporting Brodmann areas in lemurs [9]. Brain regions were roughly classified based on their locations within the frontal (Fig. 1A), parietal (Fig. 1B), occipital (Fig. 1C) and temporal (Fig. 1D) lobes as well as subcortical and mid-brain regions (Fig. 1E).
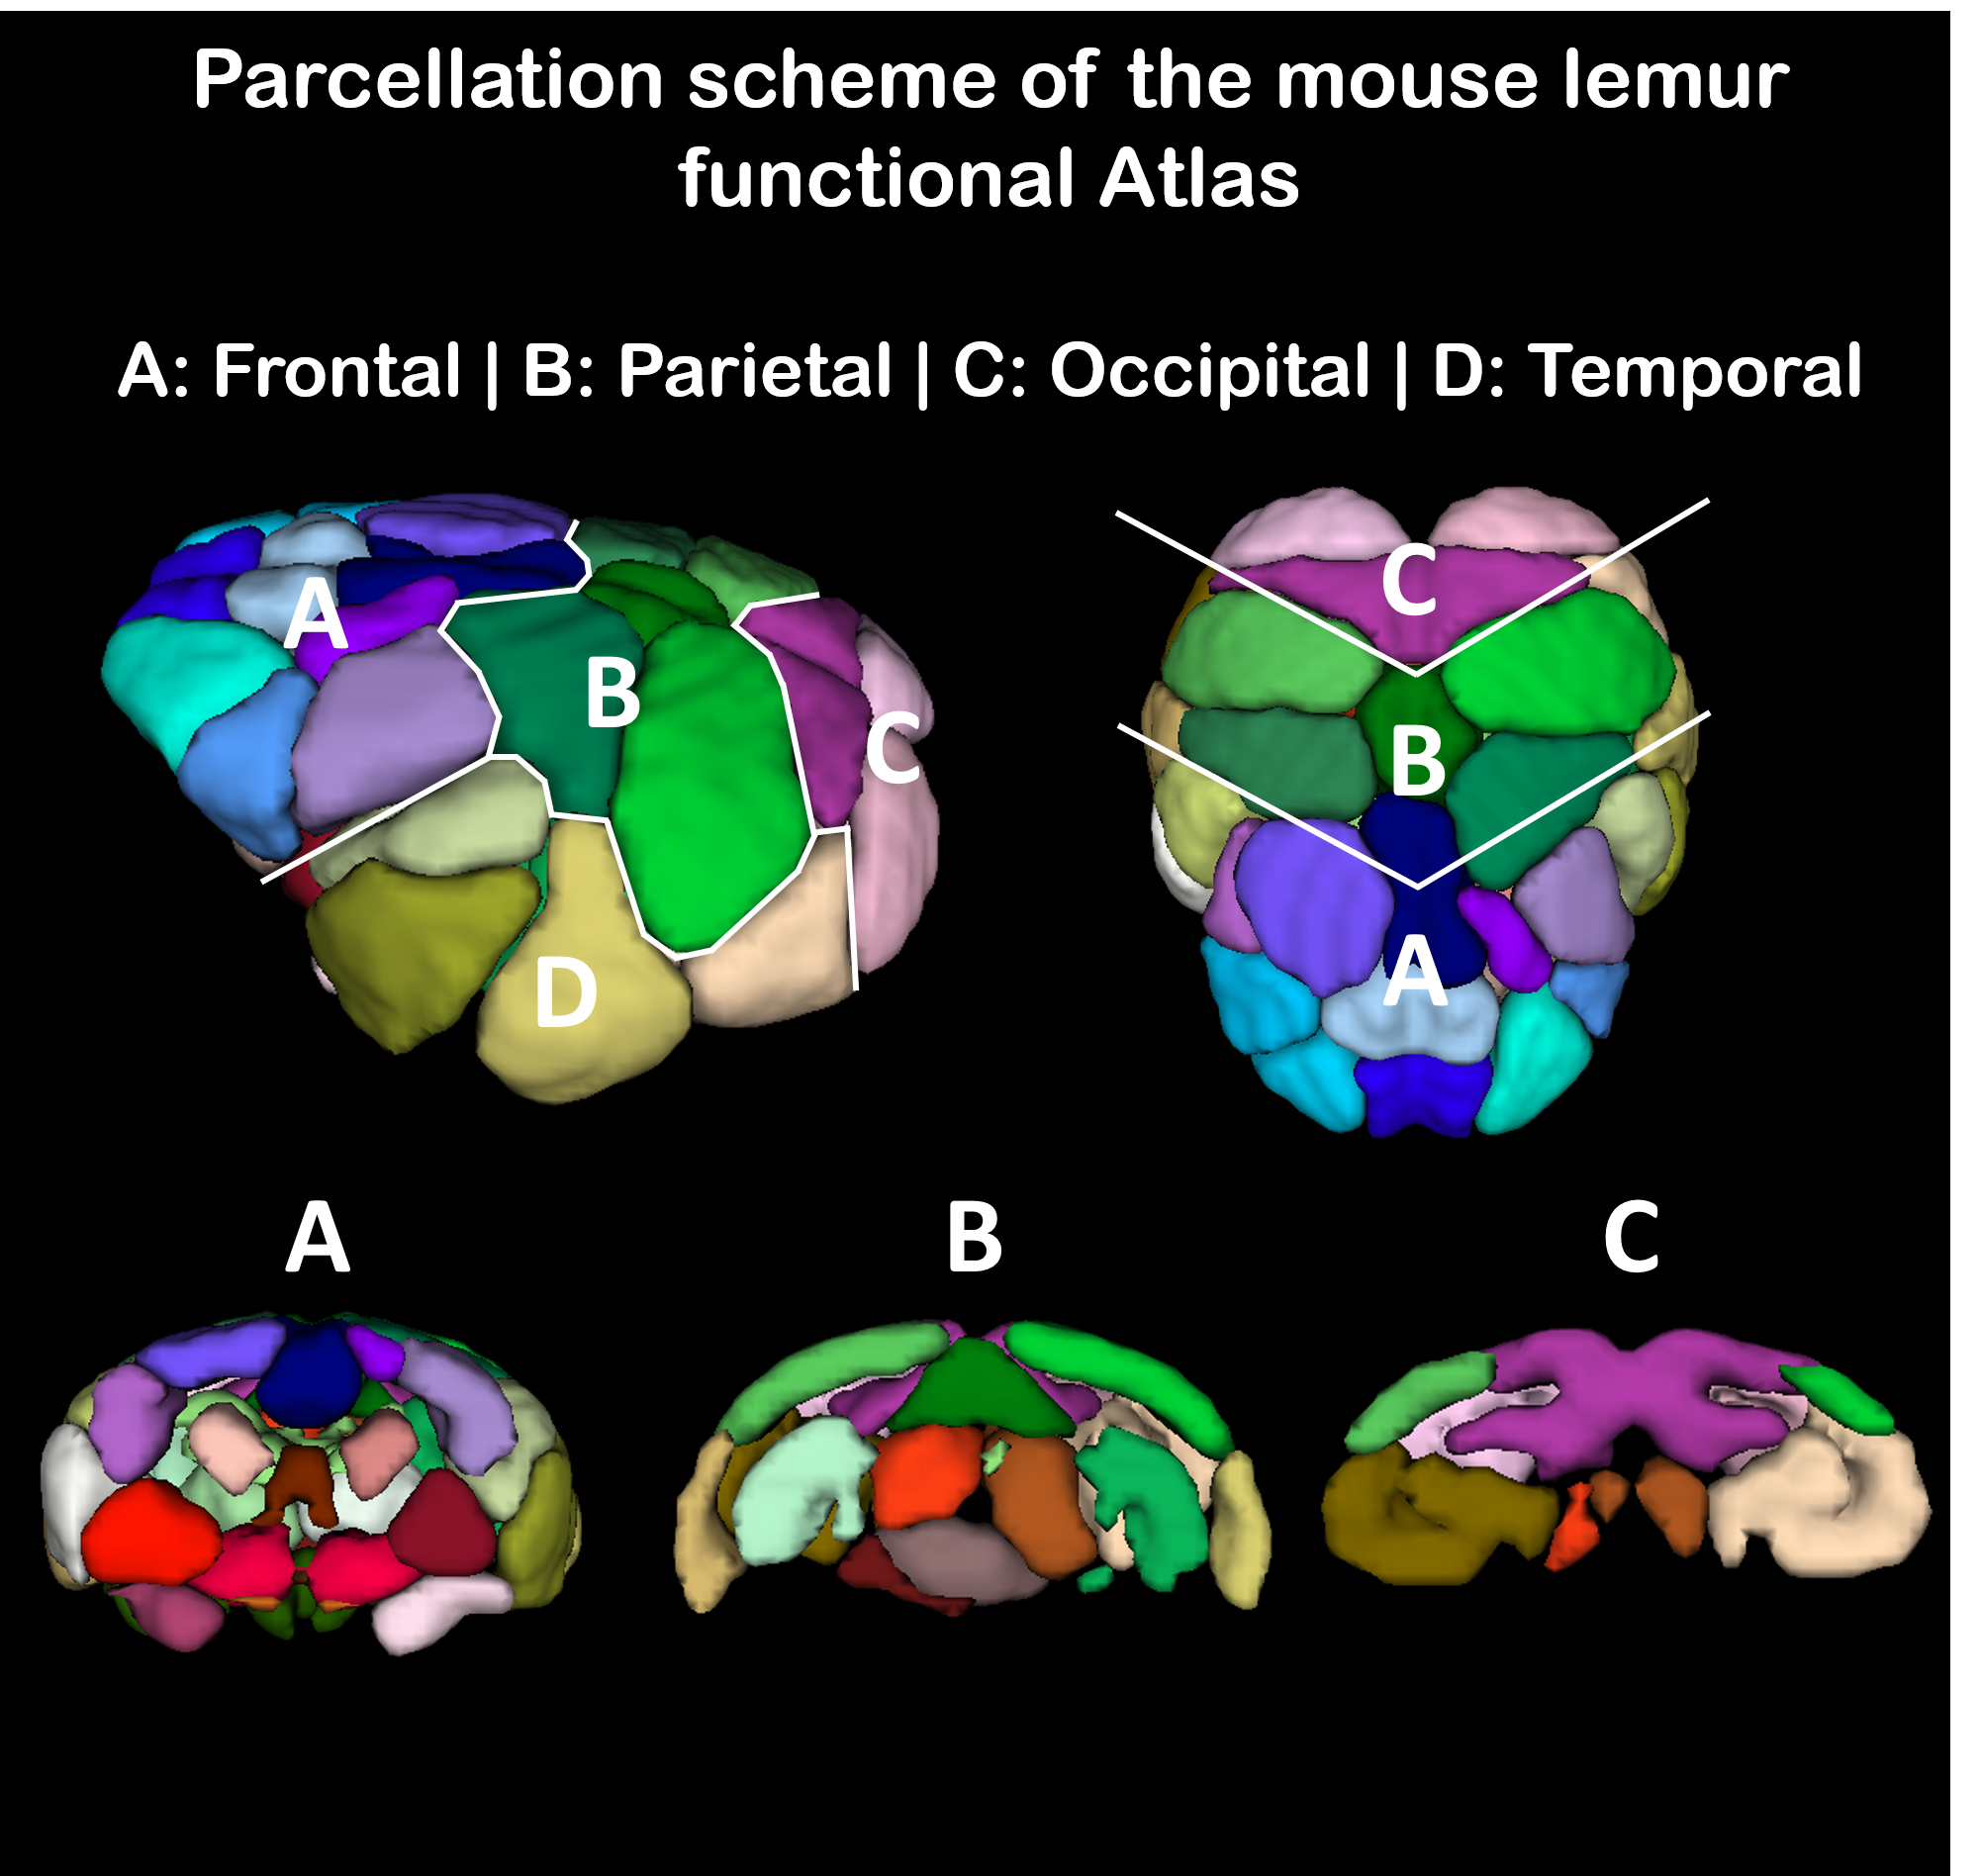
Mouse lemur 3D functional atlas based on dictionary learning (35 SCs).
Some single components were associated with bilateral structures (such as the premotor cortex in Fig. 1A). These bilateral regions were classified as two different functional nodes in each hemisphere. Ultimately, 48 local functional regions were identified from the clusters (cluster with a volume ≥ 5 mm3). Any overlap between clusters was allocated to the region whose probability was the highest within the overlap. Brain regions were classified based on their locations within the frontal (Fig. 2A), parietal (Fig. 2B), occipital (Fig. 2C), temporal (Fig. 2D) lobes.
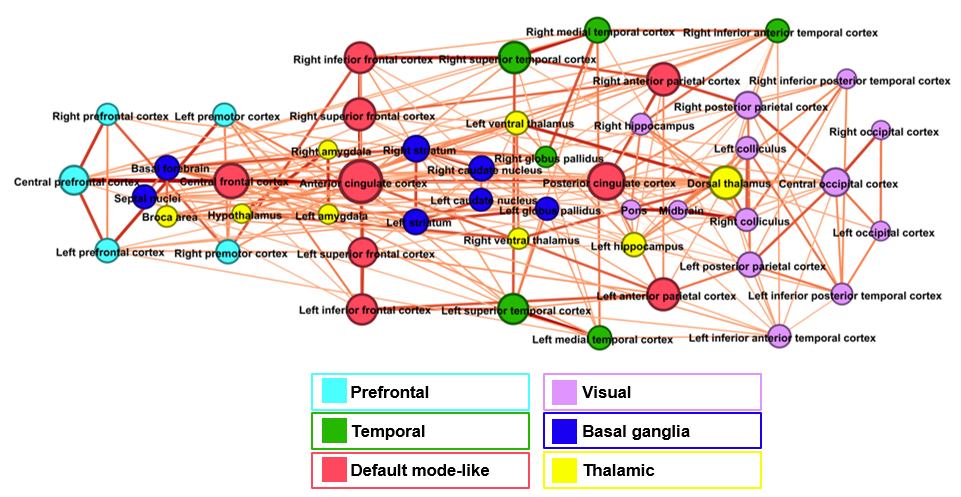
Modularity and eigenvector centrality graph measures based on functional clusters’ correlation matrix.
Using graph analysis, we found the mouse lemur brain is partitioned into six stable cortical and subcortical modules. A color and a name were assigned to each module. Those colors highlight the whole brain nodes interactions into large scale networks. Eigenvector centrality, a measure of node influence is represented by node size. Interestingly, the 4 nodes with the highest eigenvector centrality (anterior cingulate cortex, dorsal thalamus, posterior cingulate cortex and central frontal cortex) describe 4 major hubs of the 6 modules.
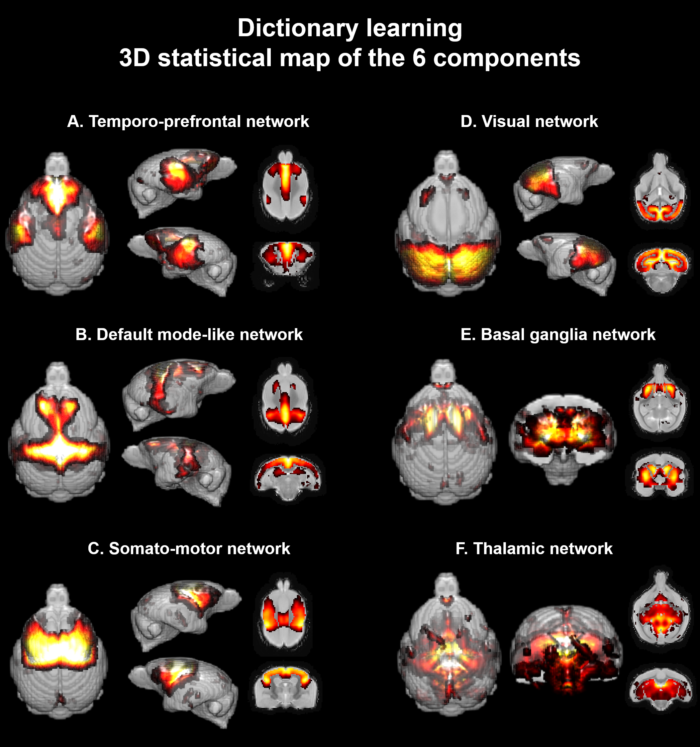
Dictionary learning 3D statistical map of the 6 components.
This analysis revealed bilateral networks that
included several regions spread over the whole brain. Their distributions were
consistent with known neurobiological systems and our previous modular large
scale networks. However, the temporal and prefrontal networks were described as
a single network and the somato-motor network was not described previously. In
comparison to modules, the ability of dictionary learning to allocate a same
voxel into 2 components provides potentially a better parcellation.
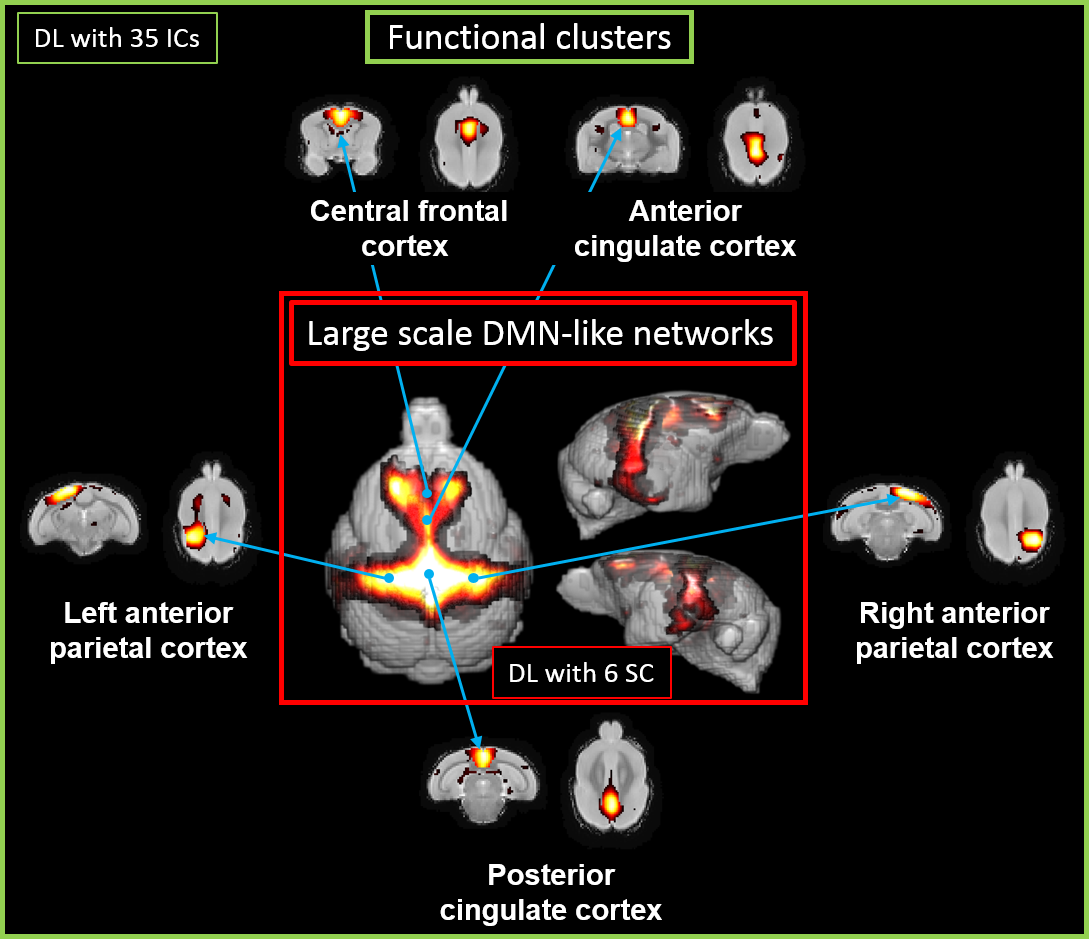
Subdivision of the default mode-like large scale networks into functional clusters.
Voxels of the statistical map were labeled using 3D functional atlas clusters. Clusters were considered to be part of a specific network when corresponding labeled voxel volume occupied 30% of that cluster. Five clusters (central frontal cortex, anterior cingulate cortex, left anterior parietal cortex, right anterior parietal cortex, posterior cingulate cortex) were identified. The cluster pattern described was similar to the default mode-like observed in other NHP fMRI studies [10-12]