1057
Using BOLD fMRI to map anesthesia-induced burst suppression in humans and non-human primates1Functional Imaging Laboratory, German Primate Center, Göttingen, Germany, 2Georg-August University of Göttingen, Göttingen, Germany, 3Klinikum Rechts der Isar der Technischen Universität München, Munich, Germany
Synopsis
Deeply anesthetized and comatose states are often accompanied by a distinctive pattern of electroencephalographic activity, called “burst suppression”. This pattern’s underlying mechanism and functional significance remain largely unknown. In this work we demonstrated that burst suppression can be detected in fMRI data, without the need for accompanying measures of neural activity. We then used this fMRI approach to perform whole-brain mapping of burst suppression in anesthetized human volunteers and non-human primates. We found that burst suppression involves the same set of brain areas across primate species, and is mostly absent in primary visual and somatosensory areas.
Introduction
Burst Suppression (BS) is an electroencephalographic (EEG) pattern consisting of an alternation between periods of high-voltage slow waves (bursts) and depressed activity (suppressions). BS activity is typical for deep general anesthesia and other comatose states, but remains poorly understood1. Studies in anesthetized rodents and humans have shown that neurovascular coupling still functions during BS, with bursts leading to an increase in blood flow and BOLD signal2,3. Thus, the high spatial resolution and whole brain coverage of BOLD fMRI can be leveraged to map the occurrence of bursts across the brain. This has been studied by extracting the burst suppression envelope from a measure of neural activity (such as EEG or calcium imaging) and correlating it with simultaneously acquired fMRI data3,4. Here we use a previously published EEG-fMRI dataset3,5 to demonstrate that BS activity can be directly derived from fMRI, without the need for concurrent electrophysiological or optical measurements. Subsequently, we use this data-driven approach to identify and map BS in fMRI scans of isoflurane-anesthetized non-human primates.Methods and results
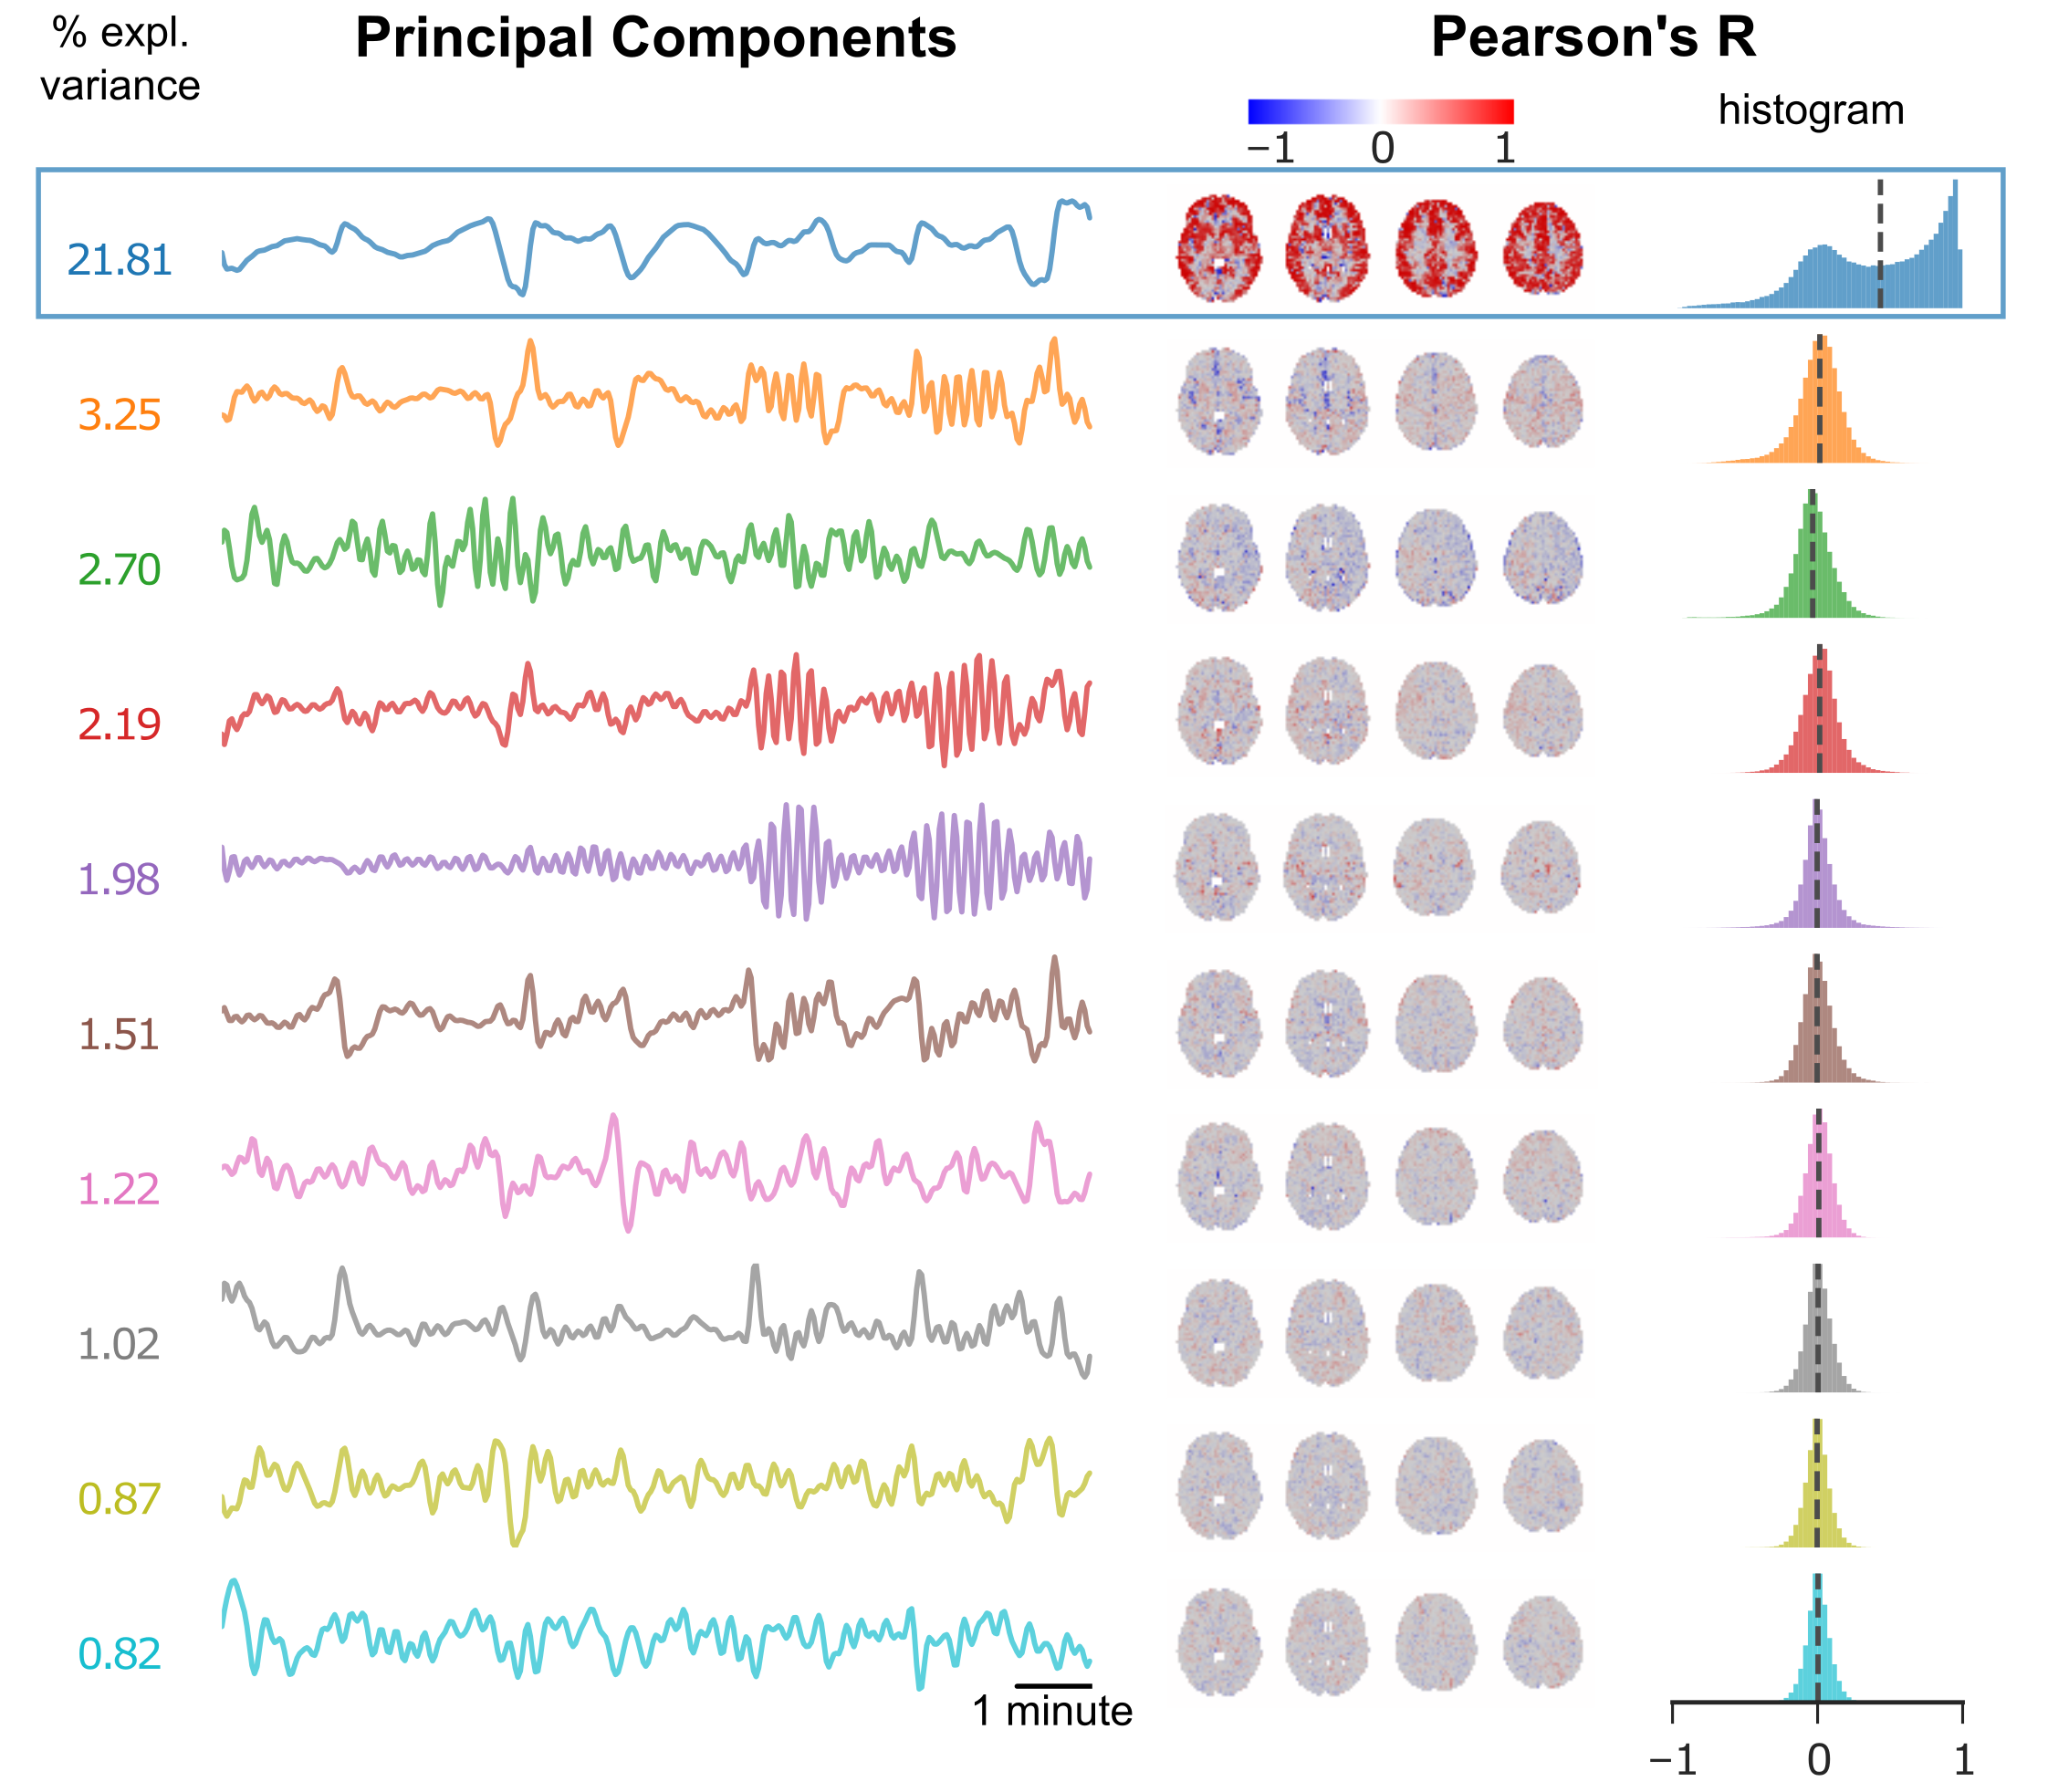
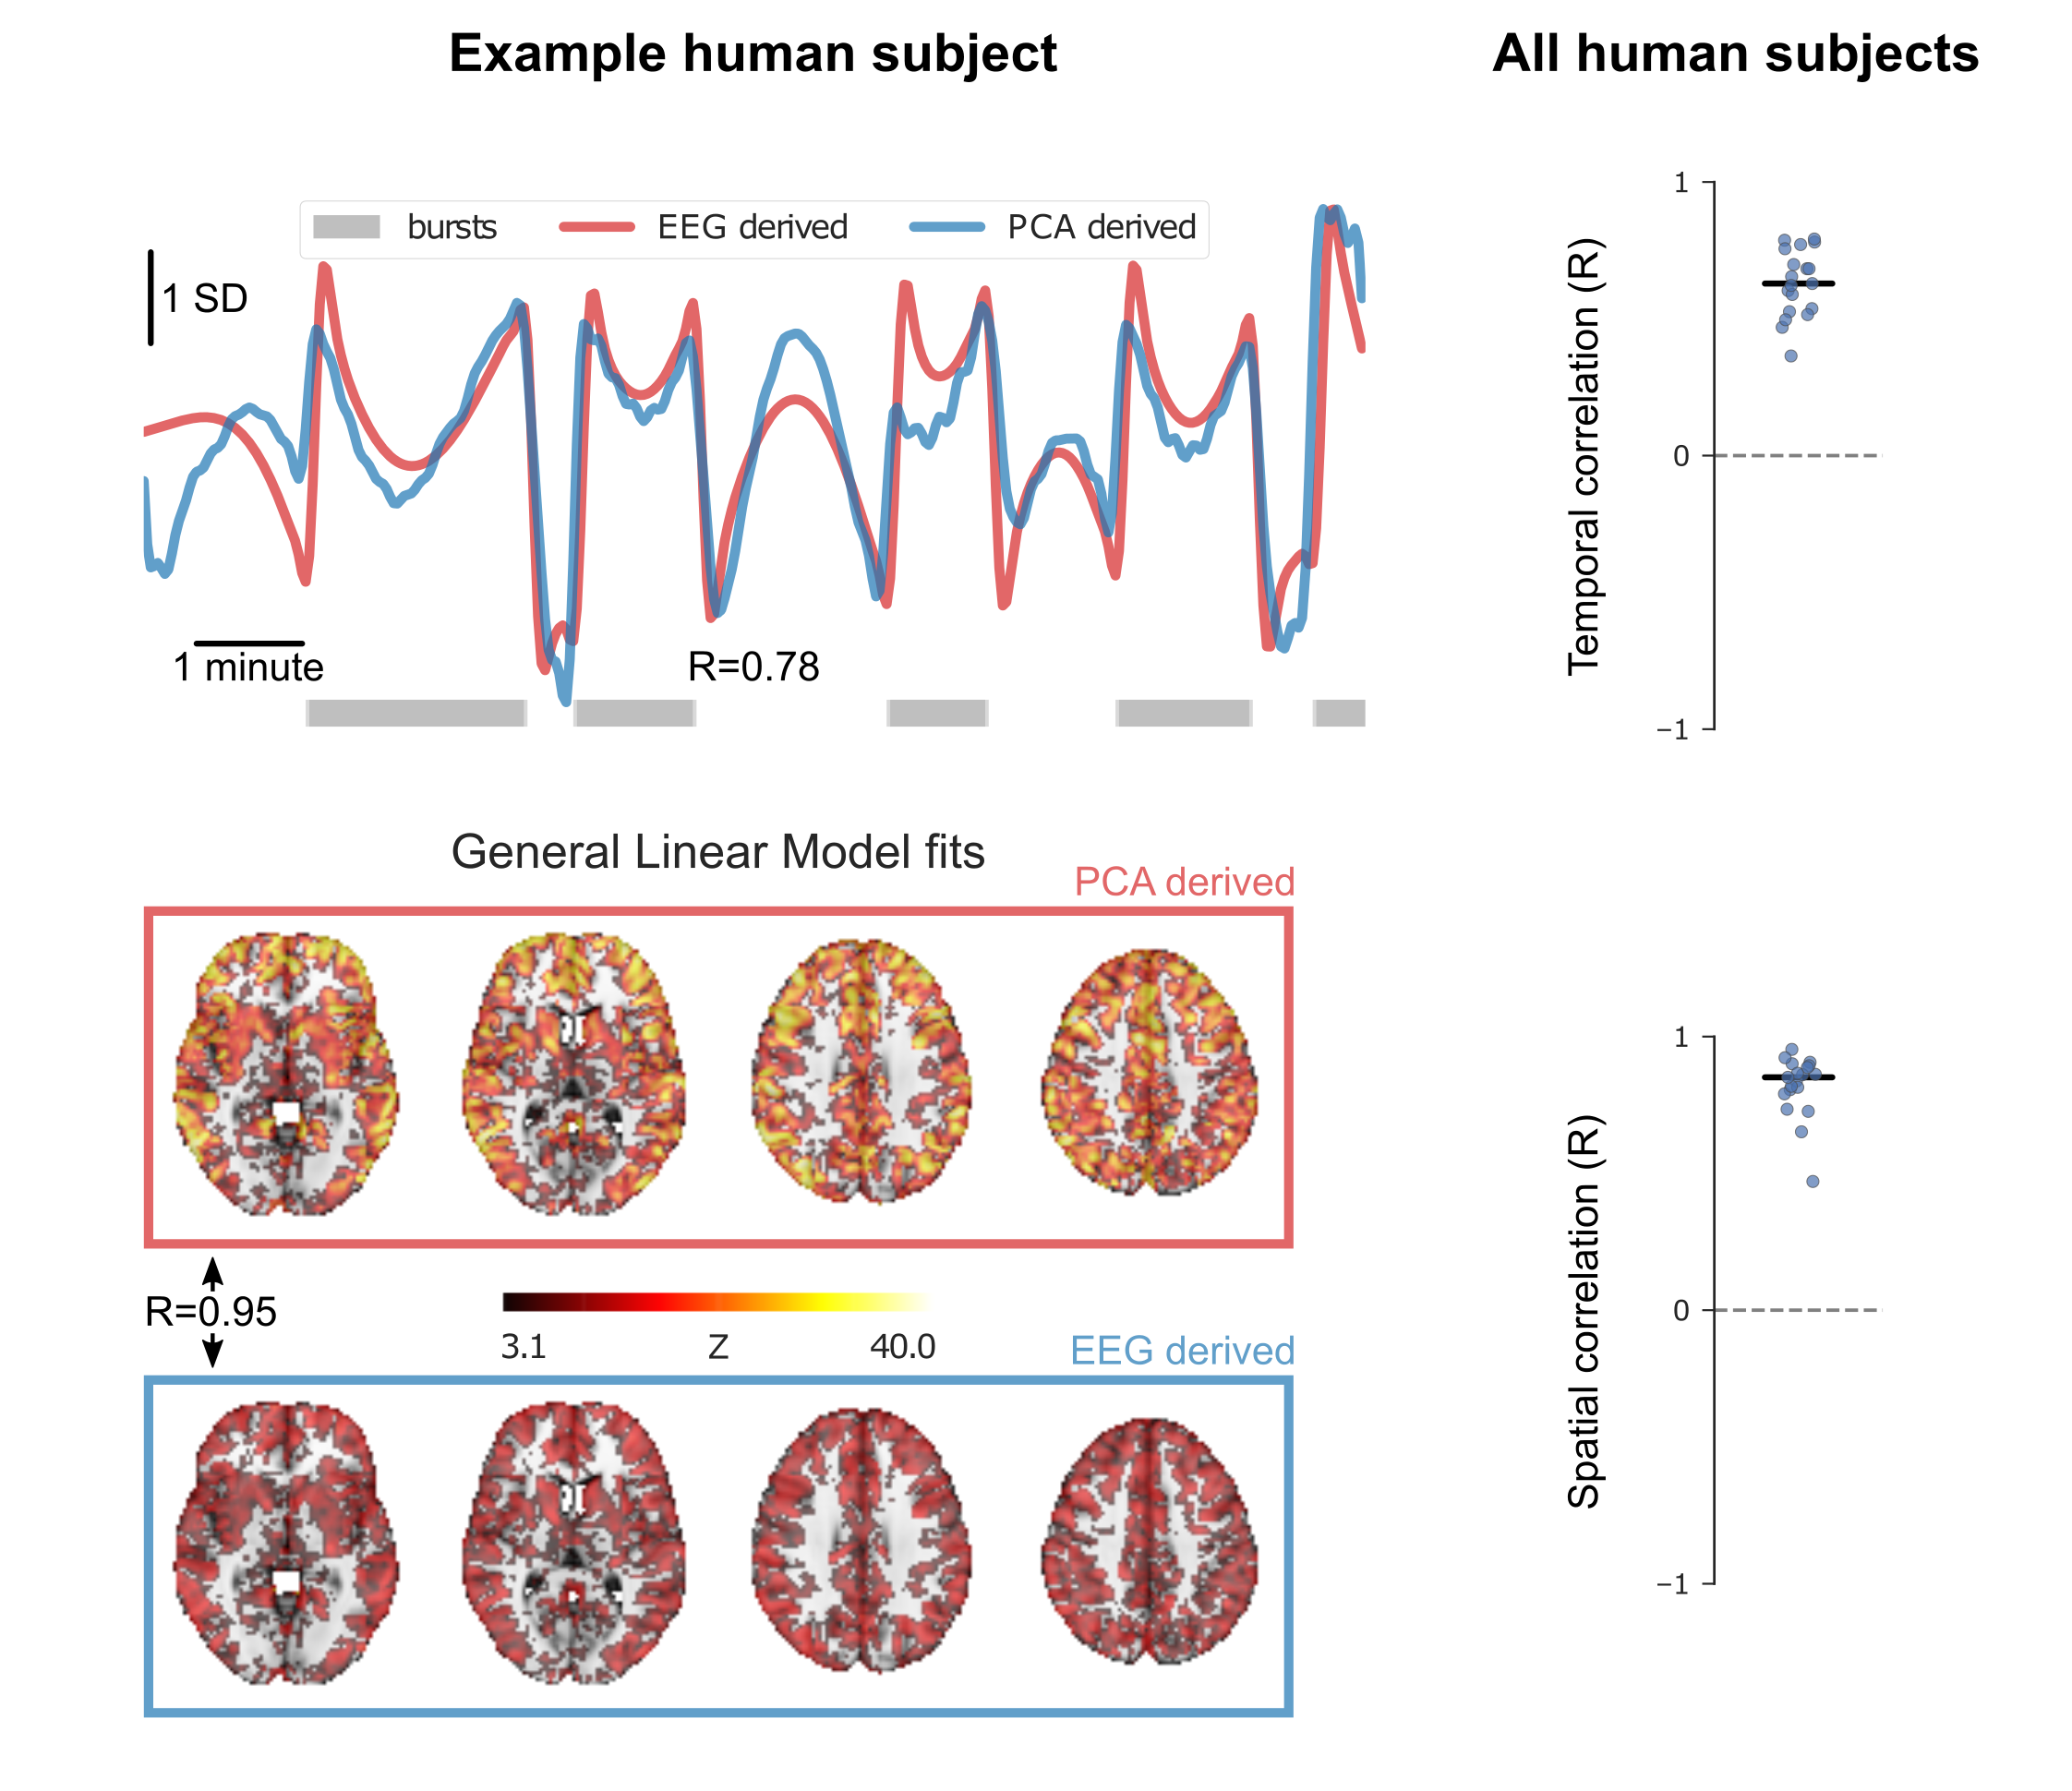
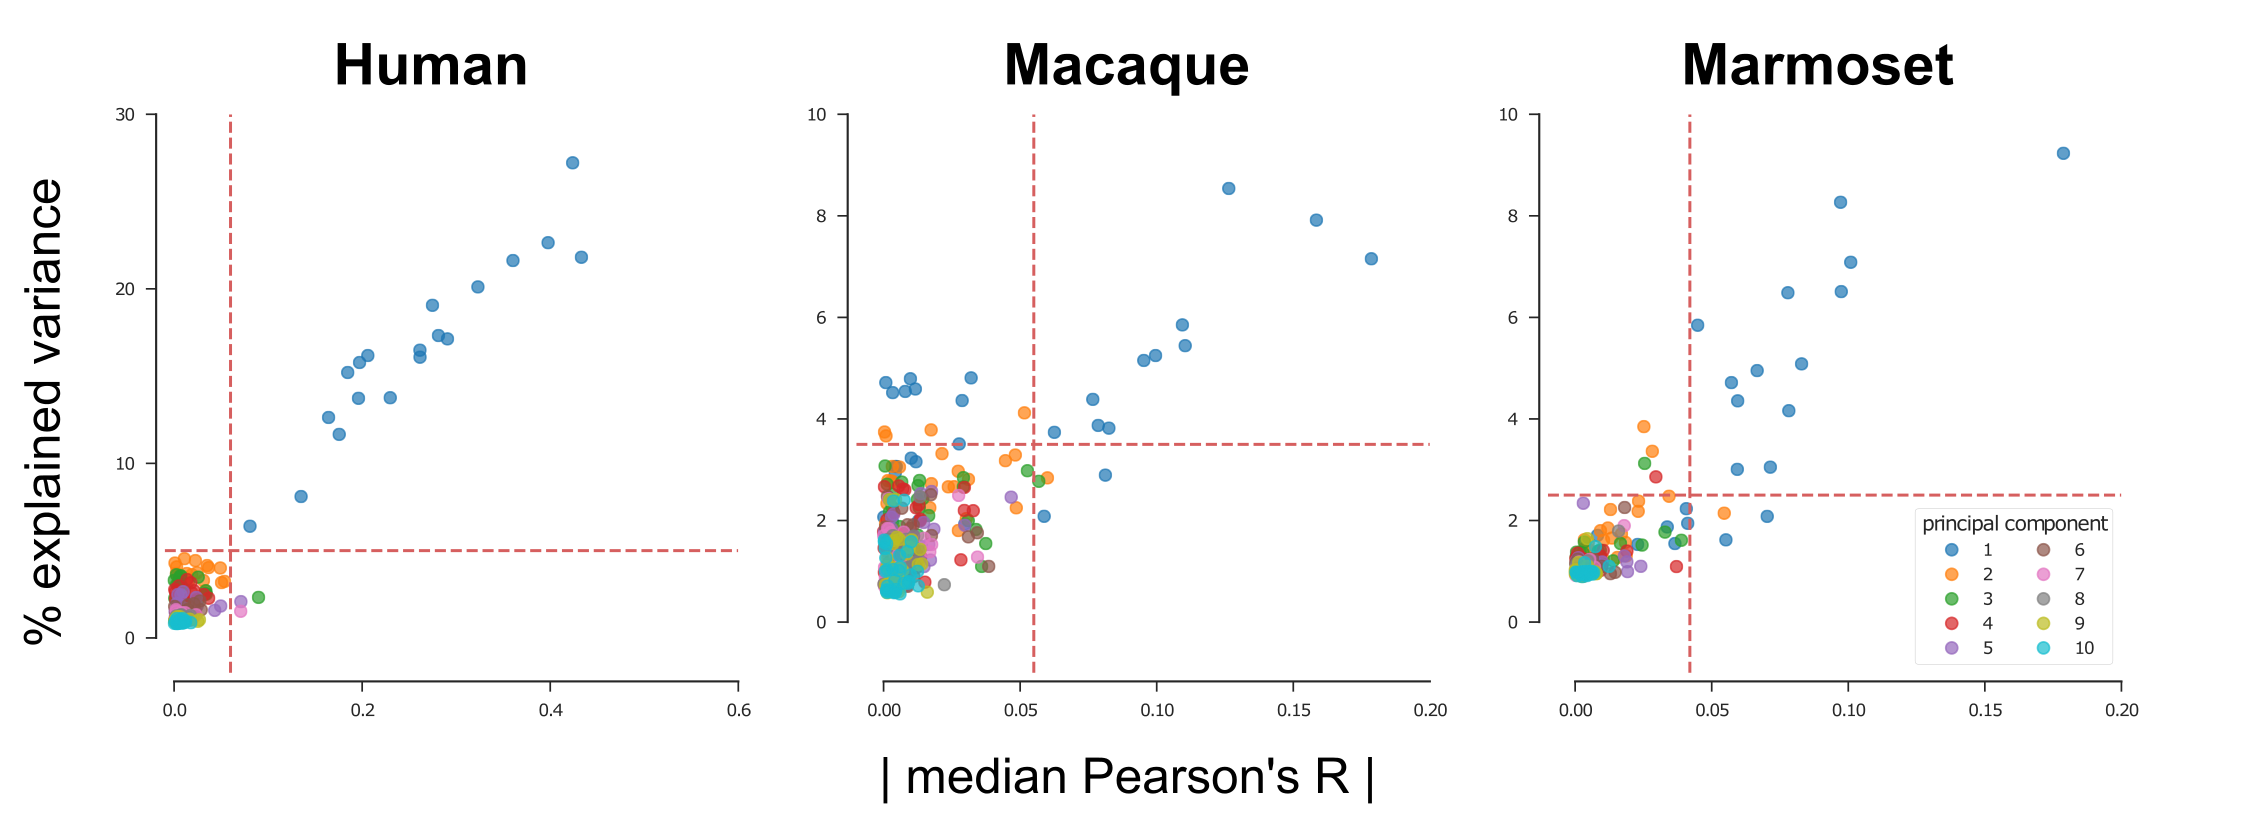
We used an EEG-fMRI dataset of 19 healthy male volunteers anesthetized with sevoflurane to develop and validate our data-driven approach for identifying BS. A 700s long EEG-fMRI recording was performed in each volunteer during BS. The fMRI scans were corrected for slice-timing and motion, band-pass filtered (0.008-0.1Hz) and normalized to zero mean and unit variance. Principal Component Analysis (PCA) was performed to extract the 10 most dominant temporal patterns in the data. Each principal component was then correlated with the BOLD time-courses of all brain voxels, to obtain Pearson’s correlation (R) maps (Fig. 1). For every scan a single principal component stood out in two ways: it explained the most variance and it resulted in the most asymmetric distribution of R coefficients (Fig. 1 and Fig. 3 left panel). To test whether this PCA-derived pattern corresponded to the “real” BS, we compared it to the EEG-derived BS envelope, after convolving the latter with a standard hemodynamic response function and passing it through the same band-pass filter. The two temporal patterns (EEG- and PCA- derived) correlated closely for all subjects (Figure 2, top panel). We also used each of the two patterns as a regressor in a General Linear Model (GLM) analysis of the fMRI data, and computed the correlation between the resulting activation maps (after thresholding and binarization). The two maps exhibited nearly perfect spatial correlation for all subjects (Fig. 2, bottom panel).
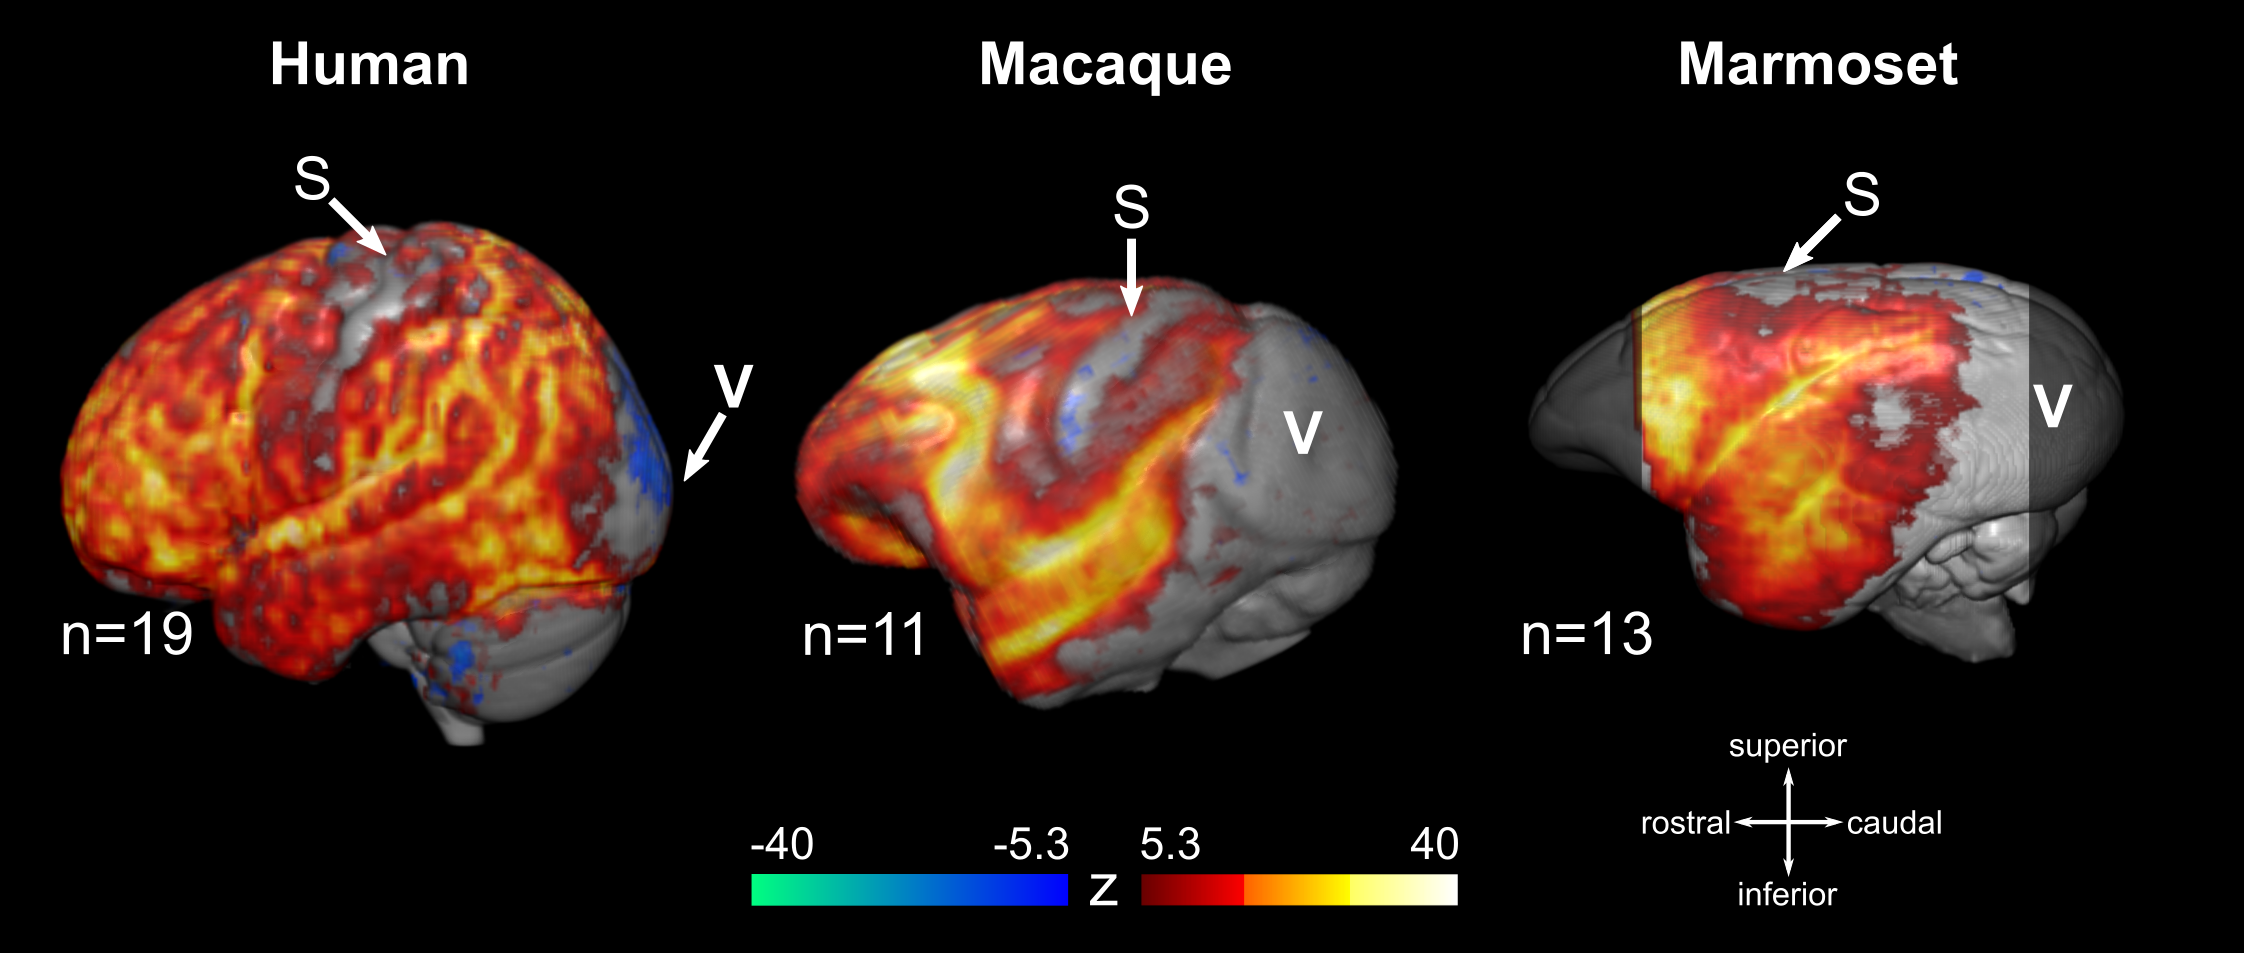
The PCA-based analysis described above was also applied to fMRI data obtained from non-human primates anesthetized with isoflurane. Two primate species were included in the study: 15 female long-tailed macaques (Macaca fascicularis) scanned at 3 Tesla (Siemens Prisma) and 21 common marmosets (Callithrix jacchus) of both sexes scanned at 9.4 Tesla (Bruker Biospin). All animals were intubated and mechanically ventilated, with isoflurane being individually adjusted to the needs of each animal. A total of 31 gradient-echo EPI resting-state fMRI scans were acquired in macaques (ranging 4-20 minutes in duration) and 21 in marmosets (one 10-minutes scan per animal). Pre-processing and PCA were applied as described for the human data. In a sub-set of fMRI scans (11/31 for macaques and 13/21 for marmosets) the PCA isolated a component with characteristics similar to the human burst suppression pattern, i.e. high explained variance ratio and asymmetric R distribution (Fig. 3). Using these PCA-derived components as regressors we designed a group GLM for each species (human, macaque and marmoset). We found that BS involves the same set of brain areas across primate species, including the striatum and a big portion of the neocortex. Notably, BS was found to be absent in the visual and primary somatosensory cortices, as well as in the thalamus and the cerebellum (Fig. 4).
Discussion
We demonstrate that BS can be identified and mapped in resting-state fMRI of anesthetized subjects in a data-driven way. This removes the methodological necessity of concurrent electrophysiological recordings and opens the door for a wider application of fMRI in the study of anesthesia and coma, both in human patients and in experimental animals. Nevertheless, more work is needed to establish the exact sensitivity and specificity of our PCA-based approach for BS identification, before it can be widely applied. Another important finding of this work is the reported spatial distribution of burst suppression, found to be common among primate species. The apparent absence of BS activity from somatosensory and visual areas is particularly puzzling and invites targeted invasive investigations.Acknowledgements
We wish to thank Kristin Kötz and Kerstin Führmann for technical assistance. This project was partly funded through the DFG Research Center for Nanoscale Molecular Physiology of the Brain (CNMPB).References
- Amzica F. What does burst suppression really mean? Epilepsy Behav. 2015;49:234-237.
- Liu X, Zhu X-H, Zhang Y, Chen W. Neural origin of spontaneous hemodynamic fluctuations in rats under burst-suppression anesthesia condition. Cereb Cortex. 2011;21(2):374-384.
- Golkowski D, Ranft A, Kiel T, et al. Coherence of BOLD signal and electrical activity in the human brain during deep sevoflurane anesthesia. Brain Behav. 2017;7(7):e00679.
- Schwalm M, Schmid F, Wachsmuth L, et al. Cortex-wide BOLD fMRI activity reflects locally-recorded slow oscillation-associated calcium waves. Elife. 2017;6.
- Ranft A, Golkowski D, Kiel T, et al. Neural Correlates of Sevoflurane-induced Unconsciousness Identified by Simultaneous Functional Magnetic Resonance Imaging and Electroencephalography. Anesthesiology. 2016;125(5):861-872.
Figures