1056
Line-scanning diffusion fMRI reveals a rapid-onset (<200 ms) component1Champalimaud Research, Champalimaud Foundation, Lisbon, Portugal
Synopsis
Diffusion fMRI (dfMRI) has been proposed as a more direct means for mapping neural activity more accurately than BOLD fMRI. However, the origin of dfMRI signals is still an ongoing debate. Here, we developed a line-scanning dfMRI technique achieving very high temporal resolution (100 ms), and measured activity in the forelimb S1 upon rat forepaw stimulation. Our results show a rapid-onset (<200ms) dfMRI component that was not found in BOLD fMRI. Upon inducing hypercapnia, the fast dfMRI component was nearly unaffected while the slower dfMRI component was substantially modulated, suggesting a potentially neural origin for the former.
Introduction
Diffusion fMRI (dfMRI) was suggested for mapping brain activity more directly1-4 than BOLD fMRI, and can convey layer-specific pathways5. Nevertheless, the nature of dfMRI signals6-9 has been extensively debated, especially vis-à-vis its temporal dynamics and potentially vascular origins. Here, we develop a high temporal resolution approach for dfMRI – arguably the “missing link” in deciding at least part of the ongoing debate.Methods
Pulse sequence. dfMRI signals are nearly always spin-echoed and thus are not easily amenable to line scanning approaches10. To achieve high temporal resolution, we harnessed a large-tip-angle11,12 (LTA) excitation pulse in a spin-echo line-scanning (LS)13 sequence (coined LTALS (el-tals)). In the absence of diffusion sensitizing gradients, a SE-BOLD signal is measured while the application of diffusion gradients provides diffusion weighting with otherwise identical experimental parameters.
Animal preparation. All experiments were preapproved by the local animal ethics committee operating under local and EU laws. Long Evan rats, 7-9 weeks old (n=16), were maintained under 2.5% isoflurane anesthesia while two needles were inserted into the left forepaw’s digits 1-2 and 4-5. Animals were then switched to medetomidine sedation (bolus: 0.05 mg/ml/kg, constant infusion: 0.1 mg/ml/kg). The animals’ temperature, respiration rate and pCO2were continuously monitored.
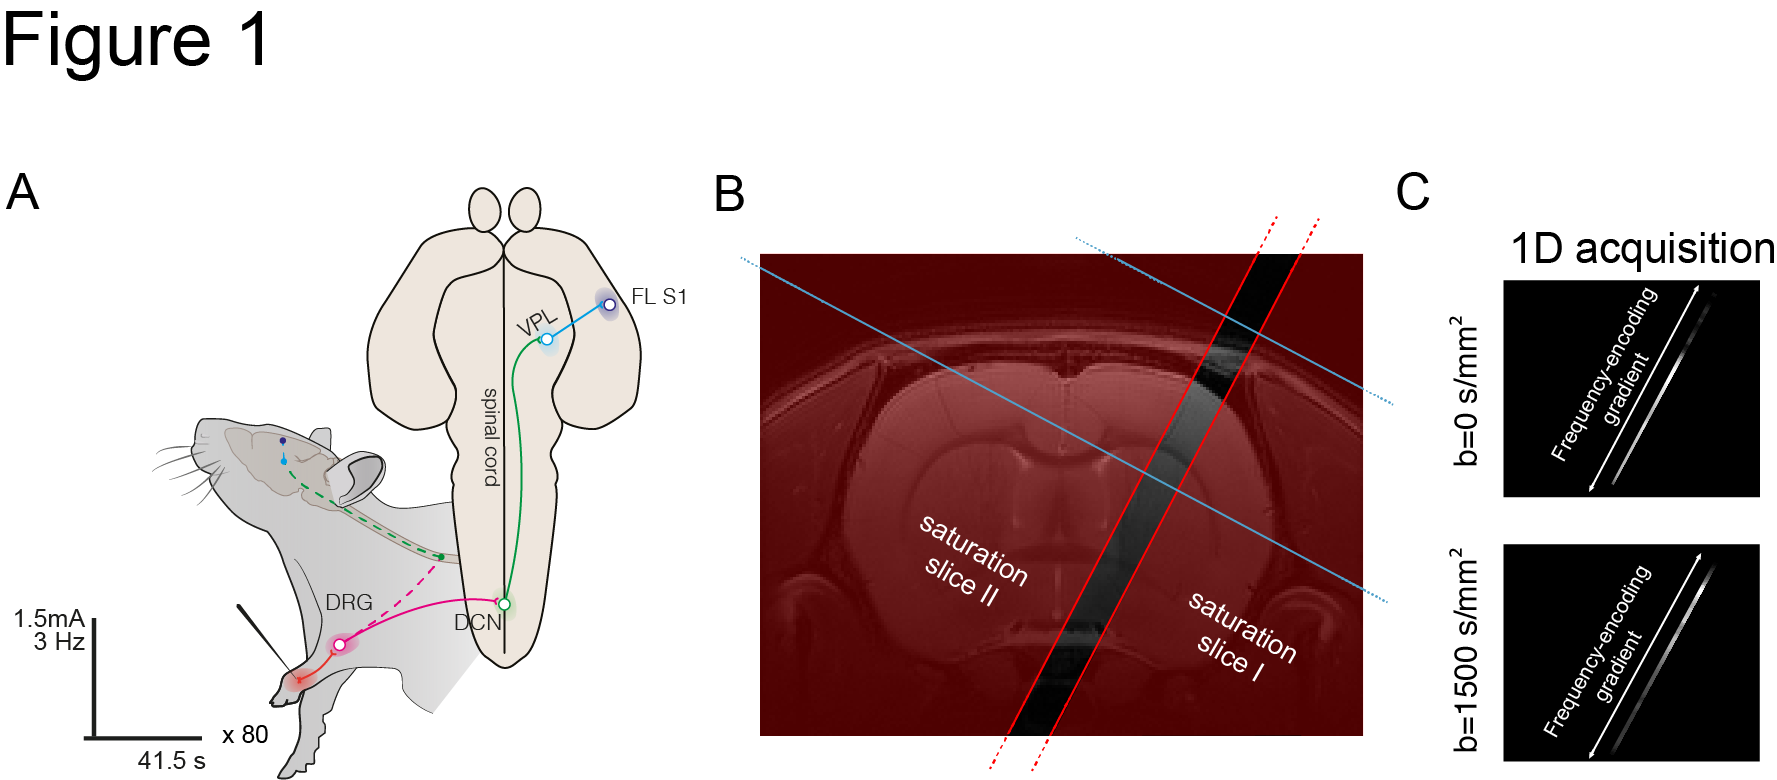
Stimulation paradigm. A square waveform comprising 1.5mA, 10Hz and 3ms stimulus duration was applied for 1.5 seconds followed by 40 seconds of rest for a total of 80 stimulation epochs (Figure 1A). A total of 415x80 = 33200 lines were acquired per animal.
MRI experiments. Experiments harnessed a 9.4T Bruker BioSpec scanner equipped with a gradient system producing up to 660 mT/m isotropically. An 86 mm quadrature resonator was used for transmittance and a 4-element array cryoprobe for reception14. Active FL-S1 was located using a SE-BOLD fMRI experiment. LTALS experiments were then preformed13 (Figures 1B and 1C). The following experimental parameters were used: TR/TE=100/24 ms; bandwidth = 10 kHz; FOV (in the readout domain) = 5.8 mm; matrix size = 68; slice thickness=1mm. For SE-BOLD, diffusion gradients were not applied; to impart diffusion weighting, a SDE waveform with b=1500 s/mm2 (Δ/δ = 16/2.2ms) was applied in the z-direction.
Experiment 1: This experiment aimed at resolving fast dynamics in dfMRI and SE-BOLD. In N=8 rats, LTALS data was acquired for SE-BOLD and dfMRI weightings and compared.
Experiment 2: This experiment targeted dfMRI mechanisms by modulating the vascular components through hypercapnia. Briefly, hypercapnia (5% CO2 in air)15 was induced in n=8 rats, which were then allowed to stabilise for 2 minutes before LTALS measurements (comprising the same stimulation paradigm as above mentioned). Upon 20 minutes of hypercapnia, 10 min normoxia was allowed for the animals to recover, before continuing with the next 20 min hypercapnia period. Again, 80 stimulation epochs were acquired in total.
Data analysis: All data was reconstructed and analyzed in Matlab (The Mathworks, USA). Data were drift-corrected and filtered using a Savitzky-Golay filter (order 3, time/spatial dimension frame length=13/9). Mean activation maps were calculated by averaging the 80 stimulation epochs (n=8 normoxia, n=8 hypercapnia. Cortical layers were defined according to Ref. 16.
Results
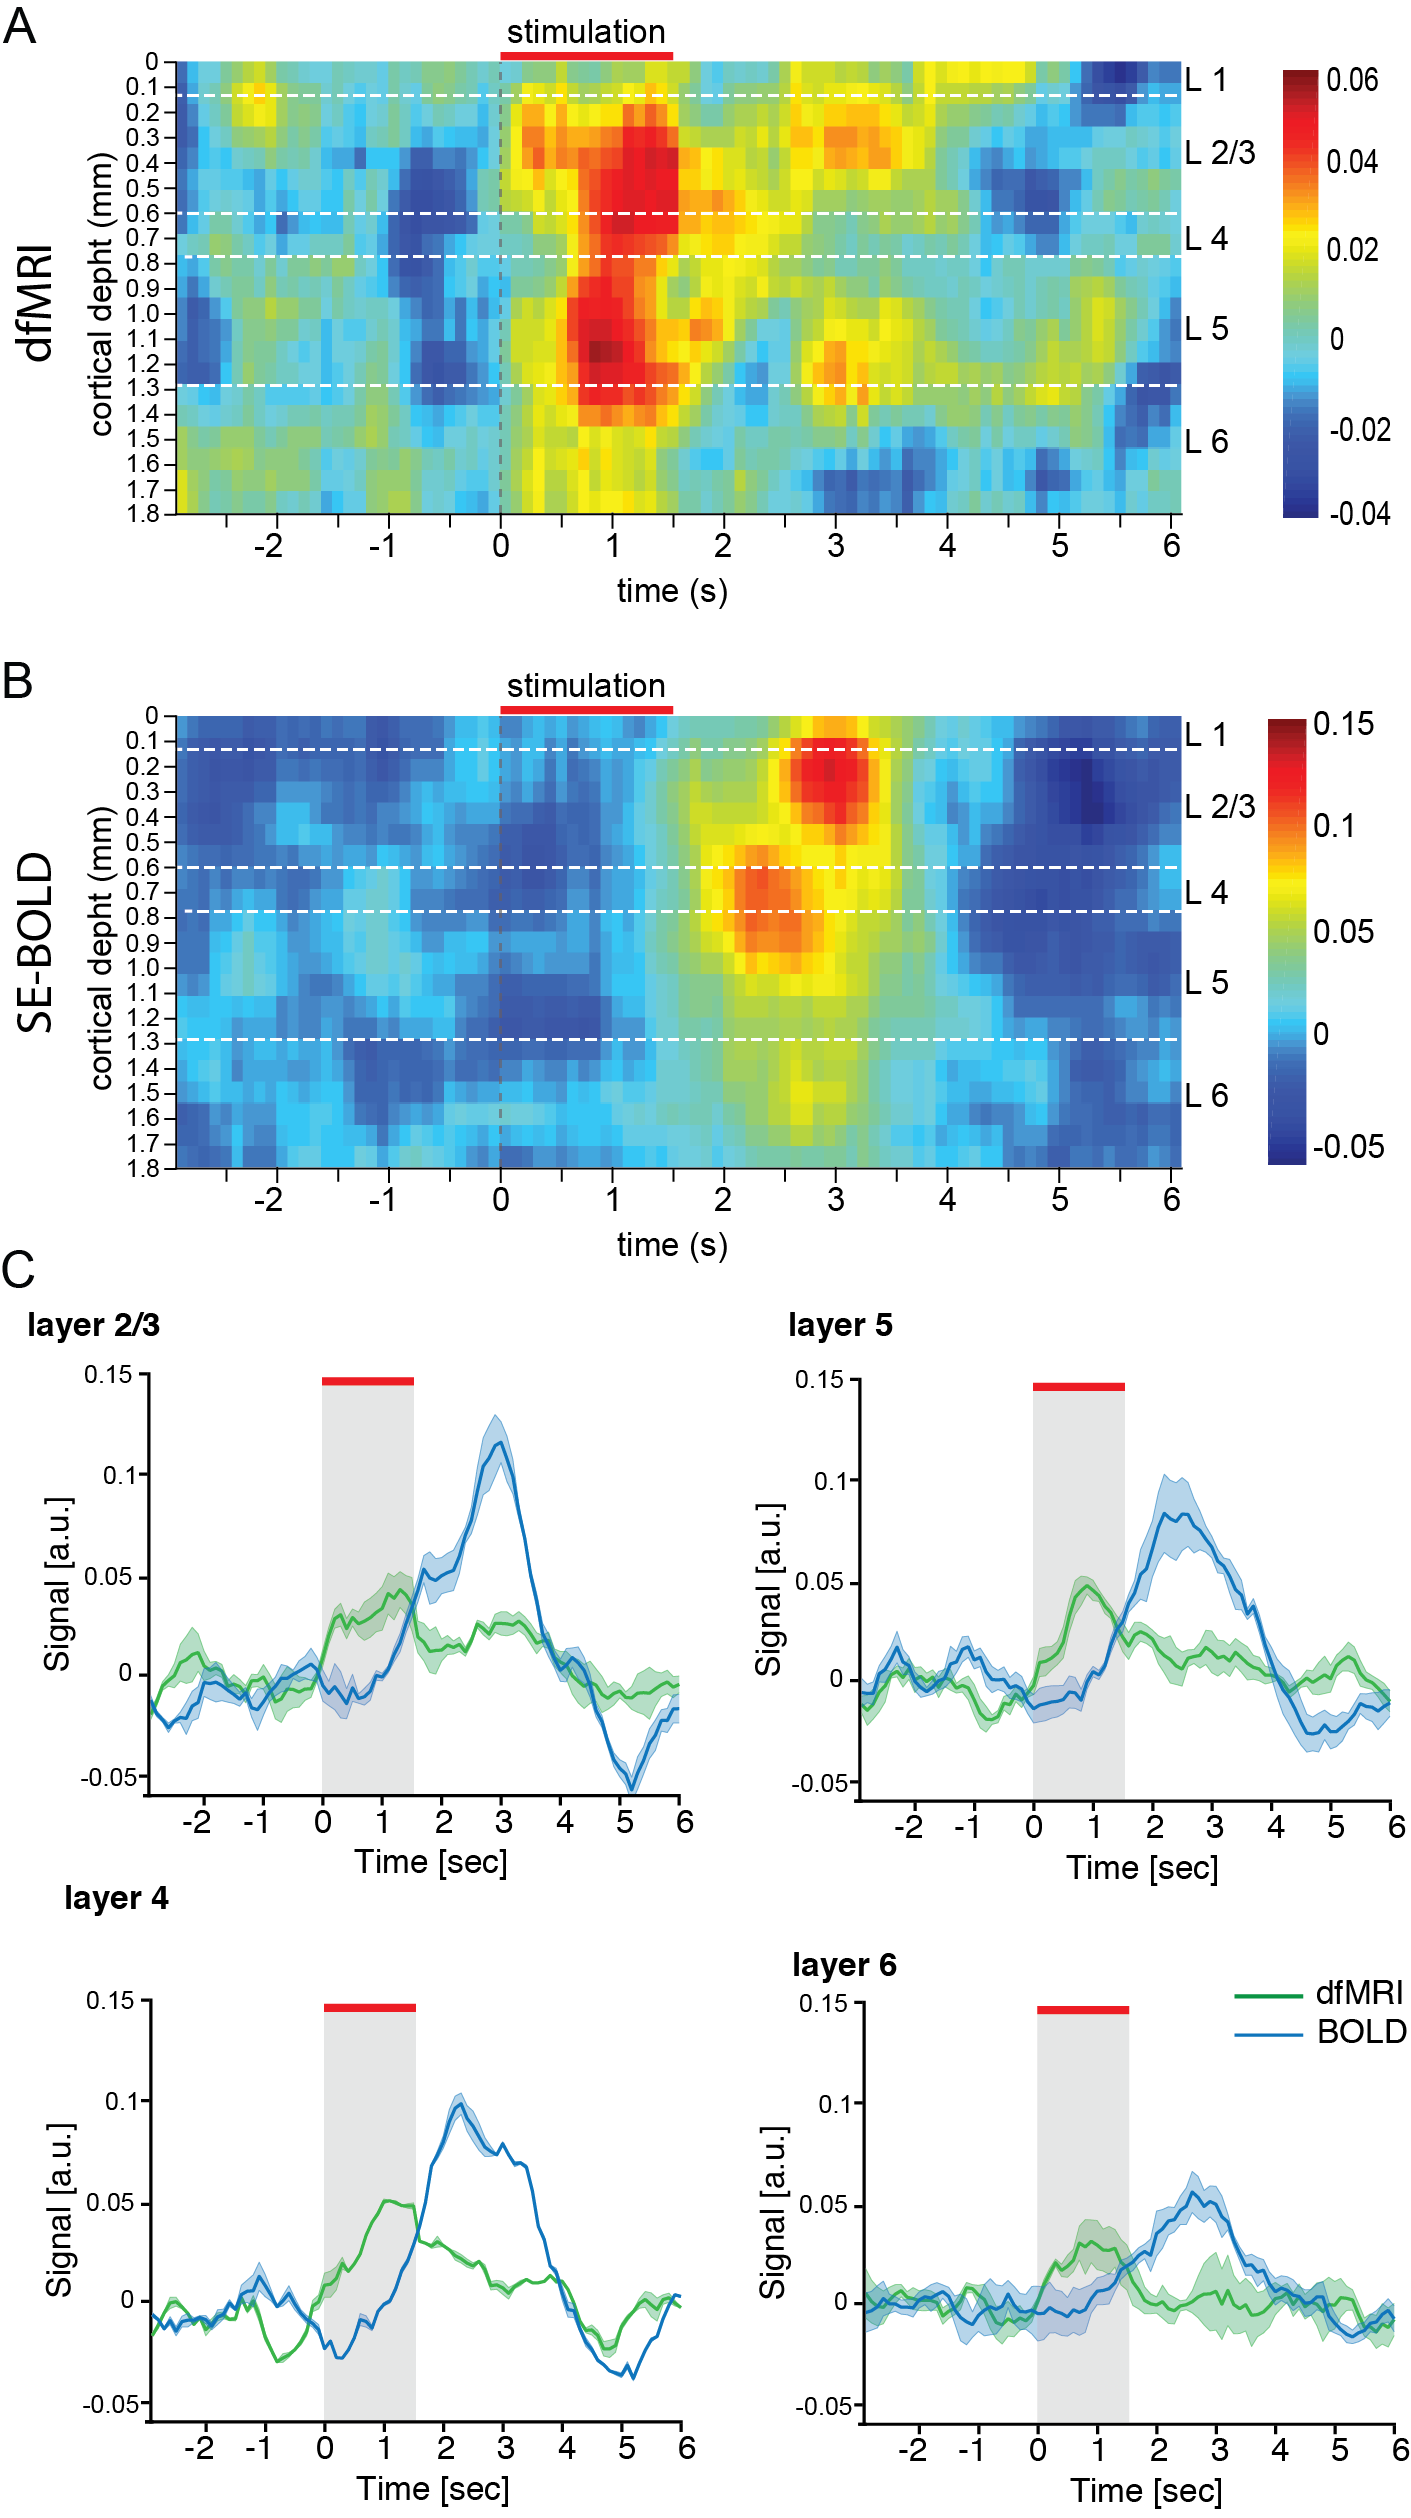
Experiment 1. LTALS dfMRI results are shown in Figure 2. A rapid onset upon stimulation (~100ms) was clearly evident in dfMRI, especially in layer 2/3, while SE-BOLD signals evidenced a rapid initial dip17,18 followed by a much later positive onset (~1.5 s), (Figures 2B and 2C). dfMRI signals peaked around 1-1.5 sec, and upon stimulus cessation, decayed quite rapidly. BOLD signals peaks only 1-2 after stimulus cessation13 and exhibited a pronounced post stimulus undershoot in all layers.
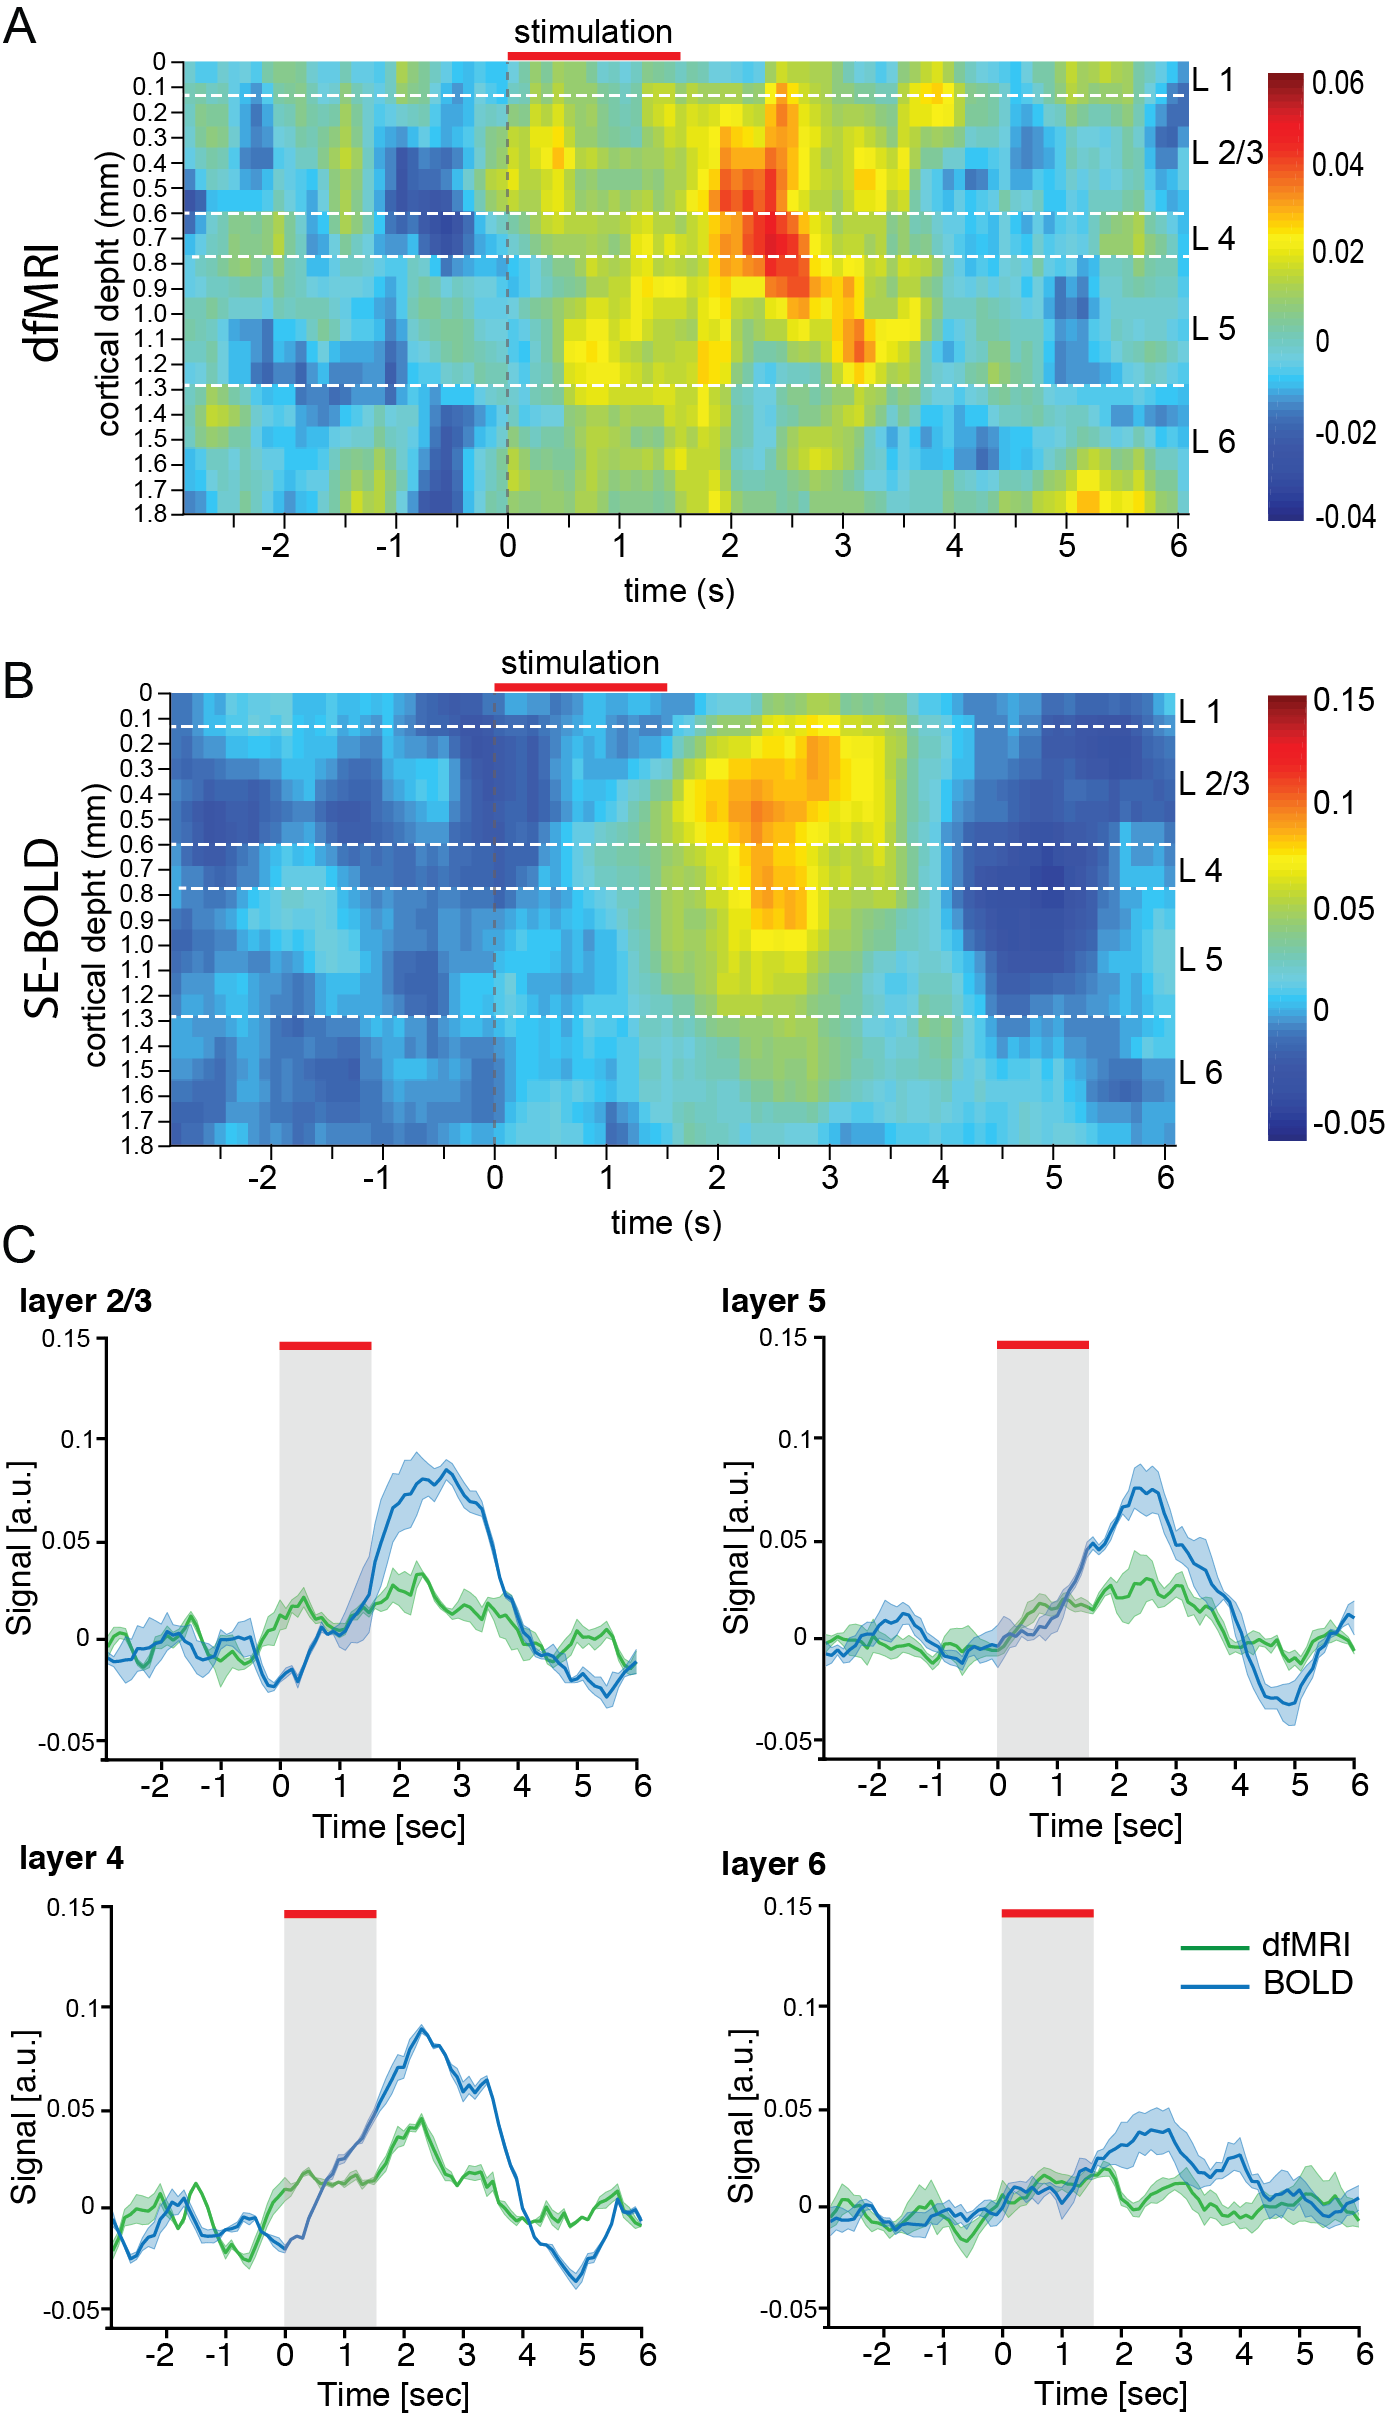
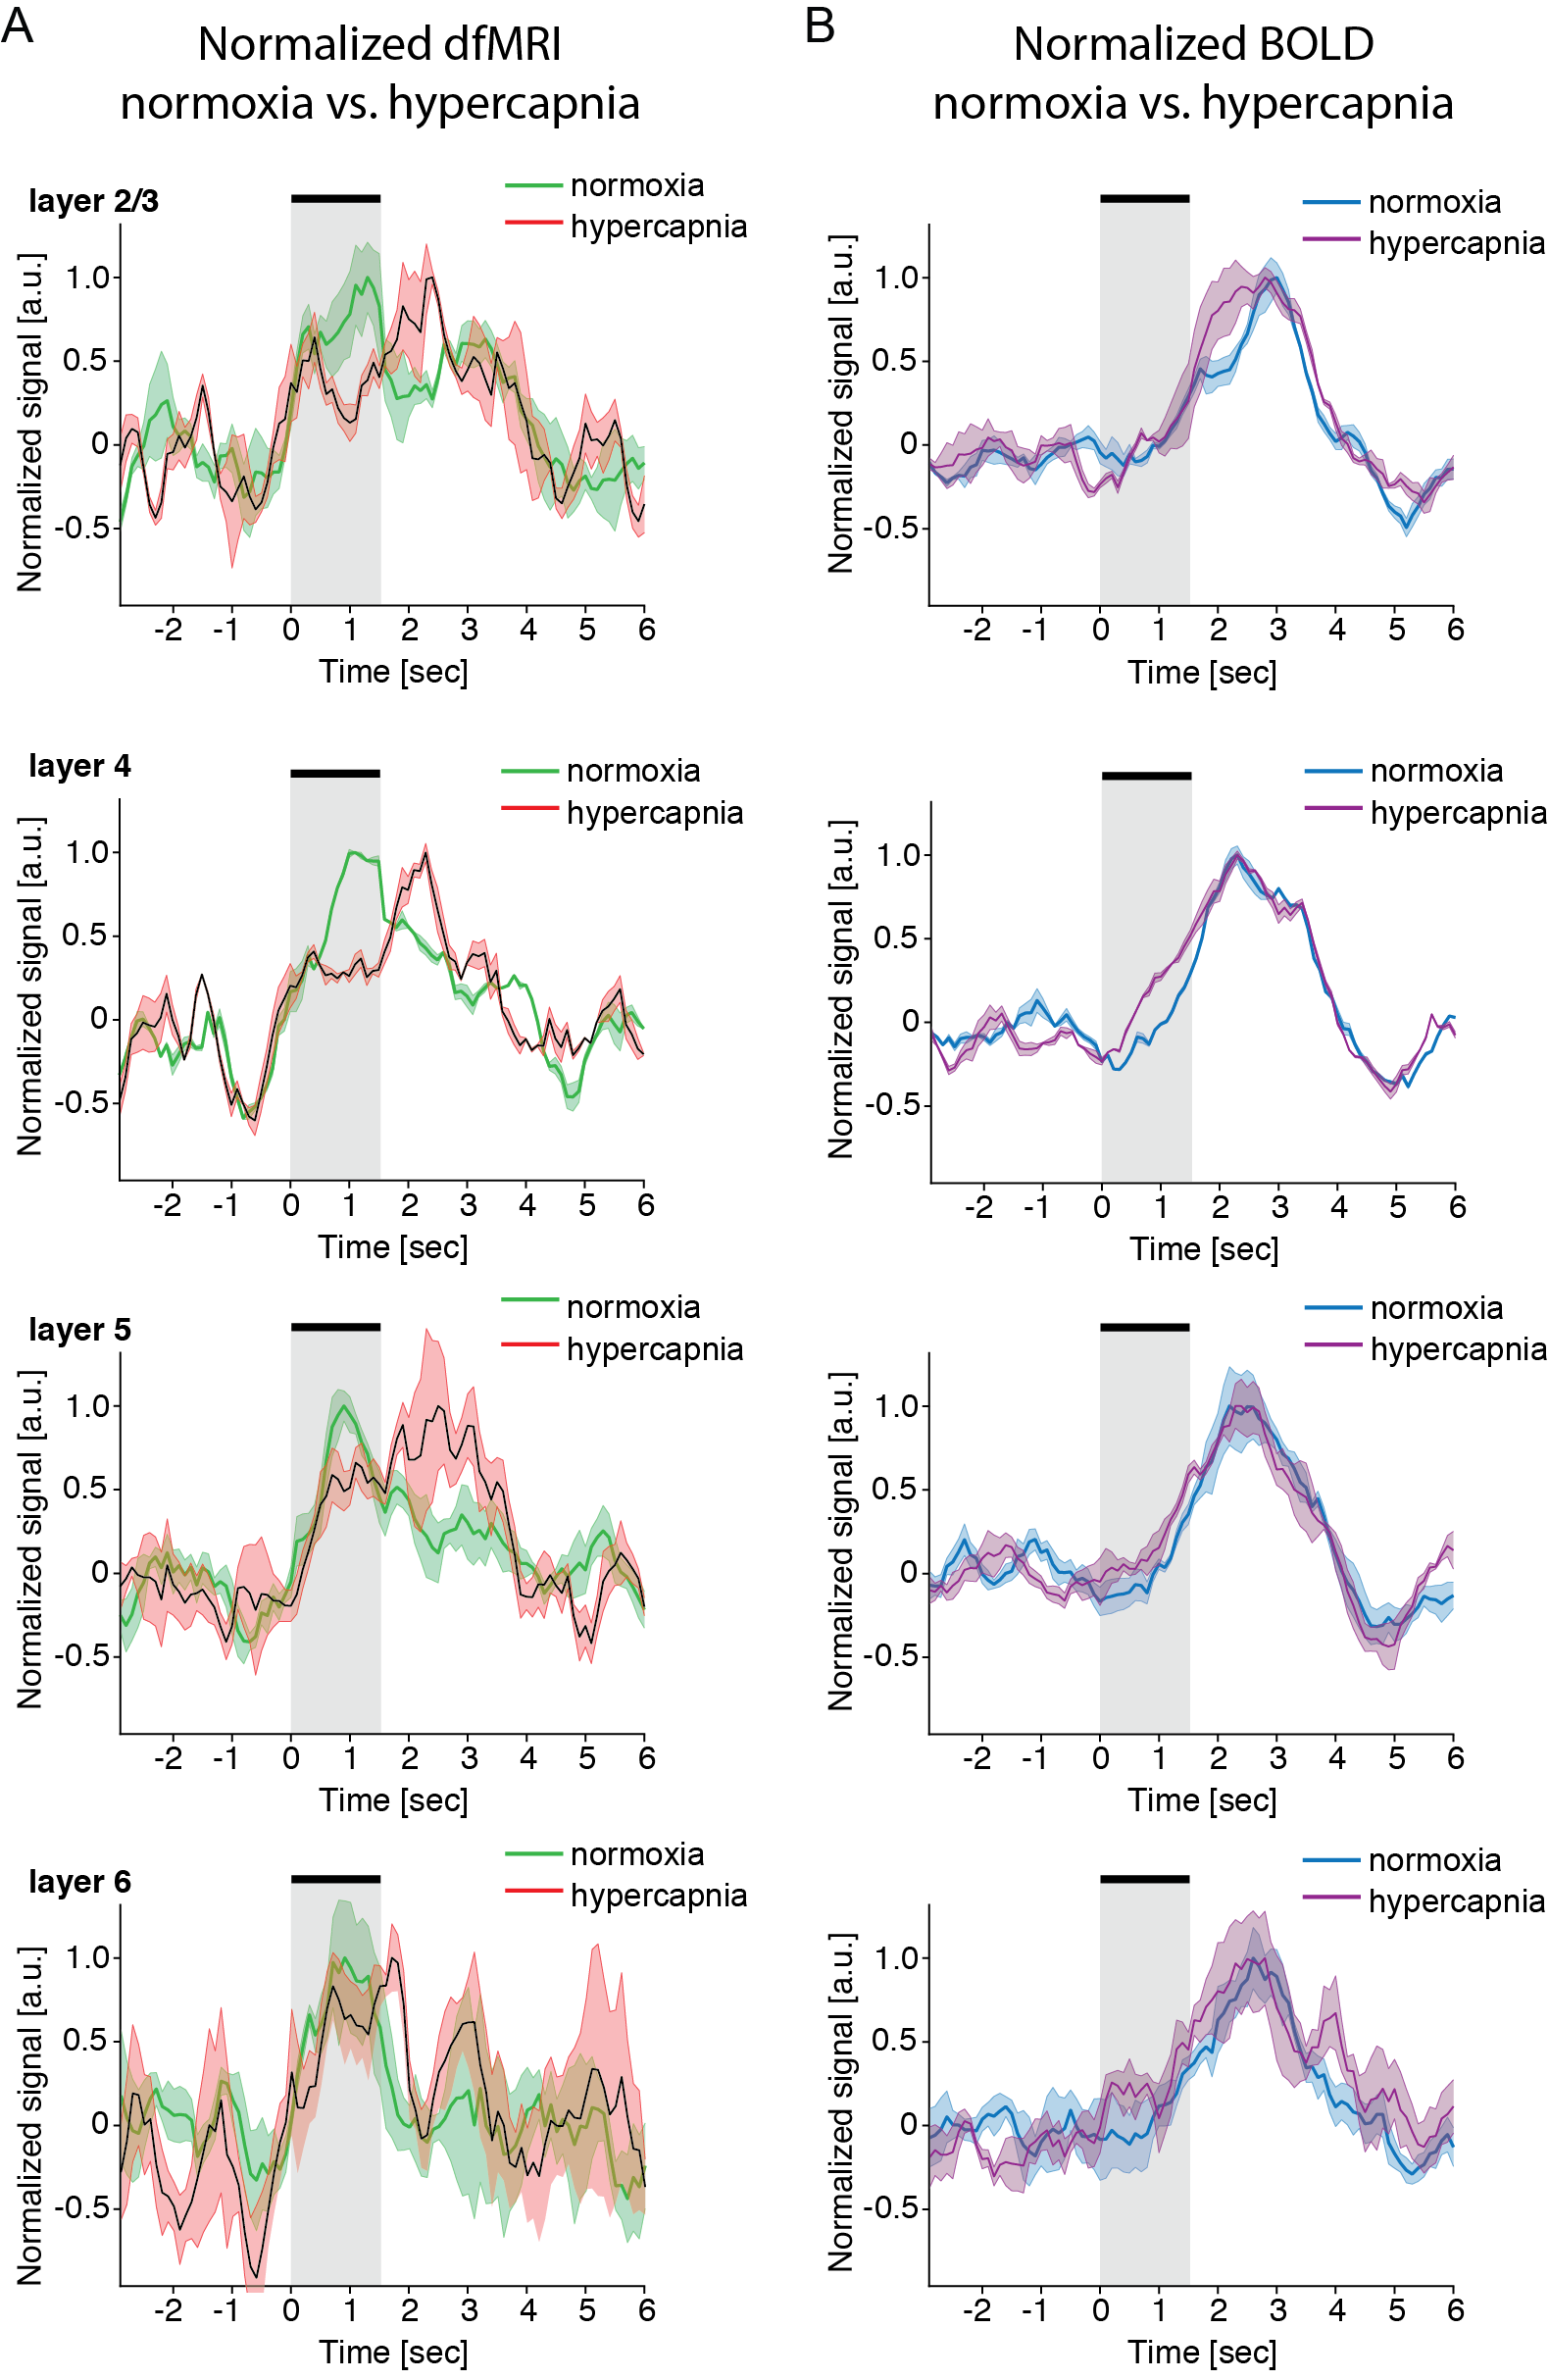
Experiment 2. Figure 3 shows that the slow components of dfMRI (and of course BOLD) were modulated by hypercapnia. However, the rapid-onset component of dfMRI remained stable (Figure 4), suggesting a nonvascular origin in this component of the signal.
Discussion
Using LTALS, we were able to map a rapid-onset dfMRI signal. Its occurrence in most layers agrees with previously recorded electrophysiology measurements revealing rapid activation of the entire column18,20. This dfMRI component was nearly unaffected by hypercapnia, suggesting that it is governed by a mechanism less related with vasculature, such as cell swelling observed typically in optical microscopy21. The slower components of the dfMRI data were in fact modulated by hypercapnia, agreeing with previous reports ascribing dfMRI signals (acquired with much lower temporal resolution) to vascular origins7-9,22. Our experiment thereby resolves a long-standing debate: both neural and vascular components coexist in dfMRI.Conclusion
The rapid onset of dfMRI after stimulation and robustness to hypercapnia indicate a putative non-BOLD origin. These results are promising for future neural activity mapping.Acknowledgements
This study was supported by funding from the European Research Council (ERC) under the European Union’s Horizon 2020 research and innovation programme (Starting Grant, agreement No. 679058).References
1 Le Bihan, D., Urayama, S., Aso, T., Hanakawa, T. & Fukuyama, H. Direct and fast detection of neuronal activation in the human brain with diffusion MRI. Proc Natl Acad Sci U S A103, 8263-8268, doi:10.1073/pnas.0600644103 (2006).
2 Tsurugizawa, T., Ciobanu, L. & Le Bihan, D. Water diffusion in brain cortex closely tracks underlying neuronal activity. Proc Natl Acad Sci U S A110, 11636-11641, doi:10.1073/pnas.1303178110 (2013).
3 Spees, W. M., Lin, T. H. & Song, S. K. White-matter diffusion fMRI of mouse optic nerve. Neuroimage65, 209-215, doi:10.1016/j.neuroimage.2012.10.021 (2013).
4 Abe, Y., Tsurugizawa, T. & Le Bihan, D. Water diffusion closely reveals neural activity status in rat brain loci affected by anesthesia. PLoS Biol15, e2001494, doi:10.1371/journal.pbio.2001494 (2017).
5 Nunes, D., Ianus, A. & Shemesh, N. Layer-specific connectivity revealed by diffusion-weighted functional MRI in the rat thalamocortical pathway. Neuroimage184, 646-657, doi:10.1016/j.neuroimage.2018.09.050 (2018).
6 Miller, K. L.et al.Evidence for a vascular contribution to diffusion FMRI at high b value. Proc Natl Acad Sci U S A104, 20967-20972, doi:10.1073/pnas.0707257105 (2007).
7 Kuroiwa, D.et al.Signal contributions to heavily diffusion-weighted functional magnetic resonance imaging investigated with multi-SE-EPI acquisitions. Neuroimage98, 258-265, doi:10.1016/j.neuroimage.2014.04.050 (2014).
8 Bai, R., Stewart, C. V., Plenz, D. & Basser, P. J. Assessing the sensitivity of diffusion MRI to detect neuronal activity directly. Proc Natl Acad Sci U S A113, E1728-1737, doi:10.1073/pnas.1519890113 (2016).
9 Williams, R. J., Reutens, D. C. & Hocking, J. Influence of BOLD Contributions to Diffusion fMRI Activation of the Visual Cortex. Front Neurosci10, 279, doi:10.3389/fnins.2016.00279 (2016).
10 Stejskal, E. O. & Tanner, J. E. Spin Diffusion Measurements: Spin Echoes in the Presence of a Time-Dependent Field Gradient. J Chem Phys42, 288-+, doi:Doi 10.1063/1.1695690 (1965).
11 Elster, A. D. & Provost, T. J. Large-tip-angle spin-echo imaging. Theory and applications. Invest Radiol28, 944-953 (1993).
12 DiIorio, G., Brown, J. J., Borrello, J. A., Perman, W. H. & Shu, H. H. Large angle spin-echo imaging. Magn Reson Imaging13, 39-44 (1995).
13 Yu, X., Qian, C., Chen, D. Y., Dodd, S. J. & Koretsky, A. P. Deciphering laminar-specific neural inputs with line-scanning fMRI. Nat Methods11, 55-58, doi:10.1038/nmeth.2730 (2014).
14 Niendorf, T.et al.Advancing Cardiovascular, Neurovascular, and Renal Magnetic Resonance Imaging in Small Rodents Using Cryogenic Radiofrequency Coil Technology. Front Pharmacol6, 255, doi:10.3389/fphar.2015.00255 (2015).
15 Brevard, M. E., Duong, T. Q., King, J. A. & Ferris, C. F. Changes in MRI signal intensity during hypercapnic challenge under conscious and anesthetized conditions. Magn Reson Imaging21, 995-1001 (2003).
16 DeFelipe, J., Alonso-Nanclares, L. & Arellano, J. I. Microstructure of the neocortex: comparative aspects. J Neurocytol31, 299-316 (2002).
17 Frostig, R. D., Lieke, E. E., Ts'o, D. Y. & Grinvald, A. Cortical functional architecture and local coupling between neuronal activity and the microcirculation revealed by in vivo high-resolution optical imaging of intrinsic signals. Proc Natl Acad Sci U S A87, 6082-6086 (1990).
18 Devor, A.et al.Coupling of total hemoglobin concentration, oxygenation, and neural activity in rat somatosensory cortex. Neuron39, 353-359 (2003).
19 Erzurumlu, R. S., Murakami, Y. & Rijli, F. M. Mapping the face in the somatosensory brainstem. Nat Rev Neurosci11, 252-263, doi:10.1038/nrn2804 (2010).
20 Shih, Y. Y.et al.Ultra high-resolution fMRI and electrophysiology of the rat primary somatosensory cortex. Neuroimage73, 113-120, doi:10.1016/j.neuroimage.2013.01.062 (2013).
21 Rector, D. M., Rogers, R. F., Schwaber, J. S., Harper, R. M. & George, J. S. Scattered-light imaging in vivo tracks fast and slow processes of neurophysiological activation. Neuroimage14, 977-994, doi:10.1006/nimg.2001.0897 (2001).
22 Lee, J. E.et al.Diffusion tensor imaging of white matter in the superior temporal gyrus and temporal stem in autism. Neurosci Lett424, 127-132, doi:10.1016/j.neulet.2007.07.042 (2007).
Figures