1055
Temporal dynamics of mouse BOLD fMRI in the sensory pathway1Cener for Neuroscience Imaging Research (CNIR), Institute for Basic Science (IBS), Suwon, Korea, Republic of, 2Department of Biomedical Engineering, Sungkyunkwan University, Suwon, Korea, Republic of, 3Department of Health Sciences and Technology, Samsung Advanced Institute for Health Sciences and Technology (SAIHST), Sungkyunkwan University, Seoul, Korea, Republic of
Synopsis
Ultra-high
field fMRI allows us to detect the functional sensory pathway including thalamic nuclei. Although hemodynamic
response function is determined spatially by the vascular architecture and
temporally by the evolution of hemodynamic changes, fMRI signals may provide
insight into tracking sequential neural processing. Here, we investigated the
spatiotemporal evolution of functional sensory pathways during forepaw
stimulation in anesthetized mice using ultra-high field BOLD fMRI.
Purpose
Previous high-temporal-resolution rodent fMRI studies have focused on layer-specific S1 responses to track evoked neuronal processing1,2. However, sensory neural signals generated by forepaw stimulation are first projected through the ventral thalamus into layer IV of S1 and then rapidly spread to other layers3. Although hemodynamic fMRI response is a secondary effect of neural activities, it may present sequential neural processing. Consequently, it is important to examine whether the order of hemodynamic response concurs with that of neural processing order. Recently, ultra-high-field fMRI at 15.2T shows improved functional sensitivity that can reliably detect subcortical activity in anesthetized mice4. Thus, we measured the temporal properties of hemodynamic response function (HRF) with high-temporal-resolution in the sensory pathway in lightly anesthetized mice.Materials & Methods
Six C57BL/6 mice (23-27g) were used for fMRI studies on 15.2T/11cm Bruker BioSpec with surface Tx/Rx coil (15mm-id). Mice were initially anesthetized with a mixture of ketamine and xylazine (100mg/kg and 10mg/kg, respectively, IP). To maintain anesthetized conditions, supplementary anesthesia (25mg/kg and 1.25mg/kg, respectively, IP) was administrated intermittently.
BOLD-fMRI data were acquired using single-shot GE-EPI sequence with TR/TE=250/11ms, flip angle=30°, spatial resolution=156×156x500μm3 and 3 coronal slices. For the selection of slices containing S1, S2 and thalamus, scout fMRI experiments were performed on the whole brain. The electrical stimulus parameters for the left forepaw were: pulse width of 0.5ms, frequency of 4Hz and current intensity of 0.5mA. Each stimulus run consisted of 800 volumes: 160 pre-stimulus-80 stimulus-240 rest-80 stimulus-240 post-stimulus. 15 fMRI trials were obtained for signal averaging.
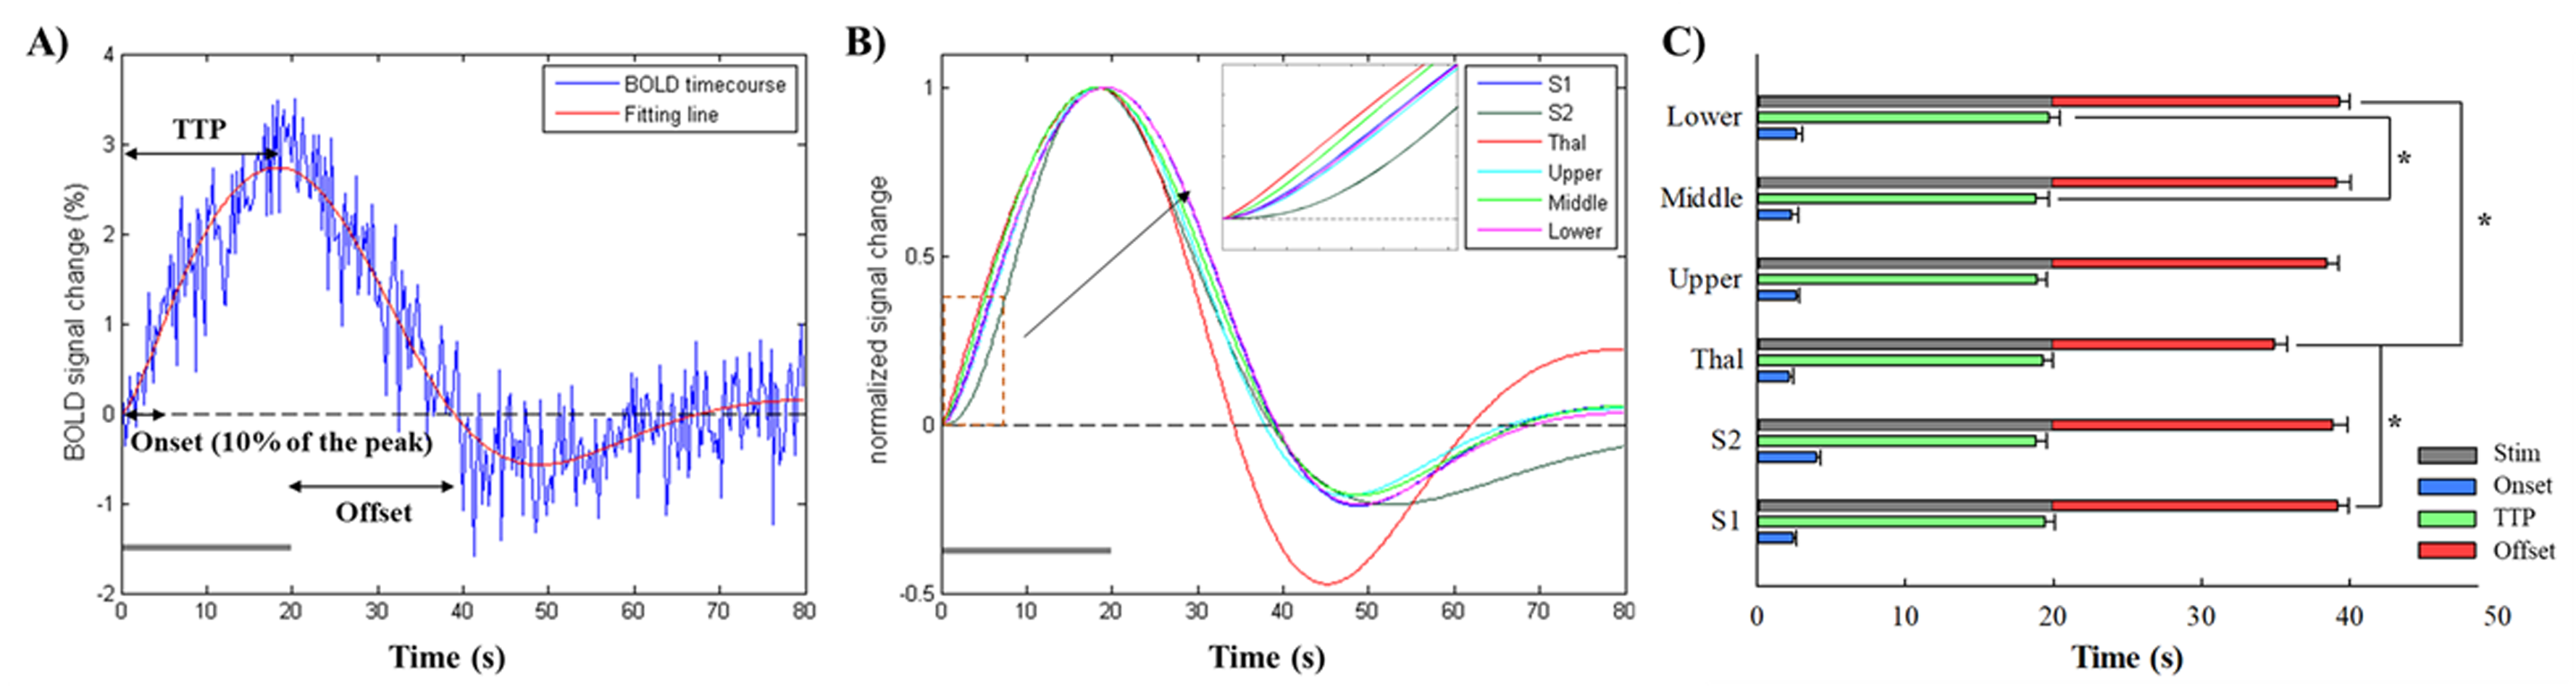
All data for each animal were averaged and BOLD response was identified using AFNI and ANTs packages. Six different ROIs were defined based on the Allen mouse brain atlas; S1, S2, thalamus and three S1 layers (upper, middle and lower). Temporal BOLD signals within each ROI were fitted using a two gamma-variate function. All fitting curves were normalized to the peak to determine the response characteristics of onset time, time to peak and offset time. The onset time was estimated as the time to 10% of the peak. BOLD amplitude was calculated by a signal averaging between 10 and 20s after the onset of stimulation. Repeated-measures ANOVA was conducted to measure the statistical significance of differences (Bonferroni post-hoc test, p<0.05).
Results
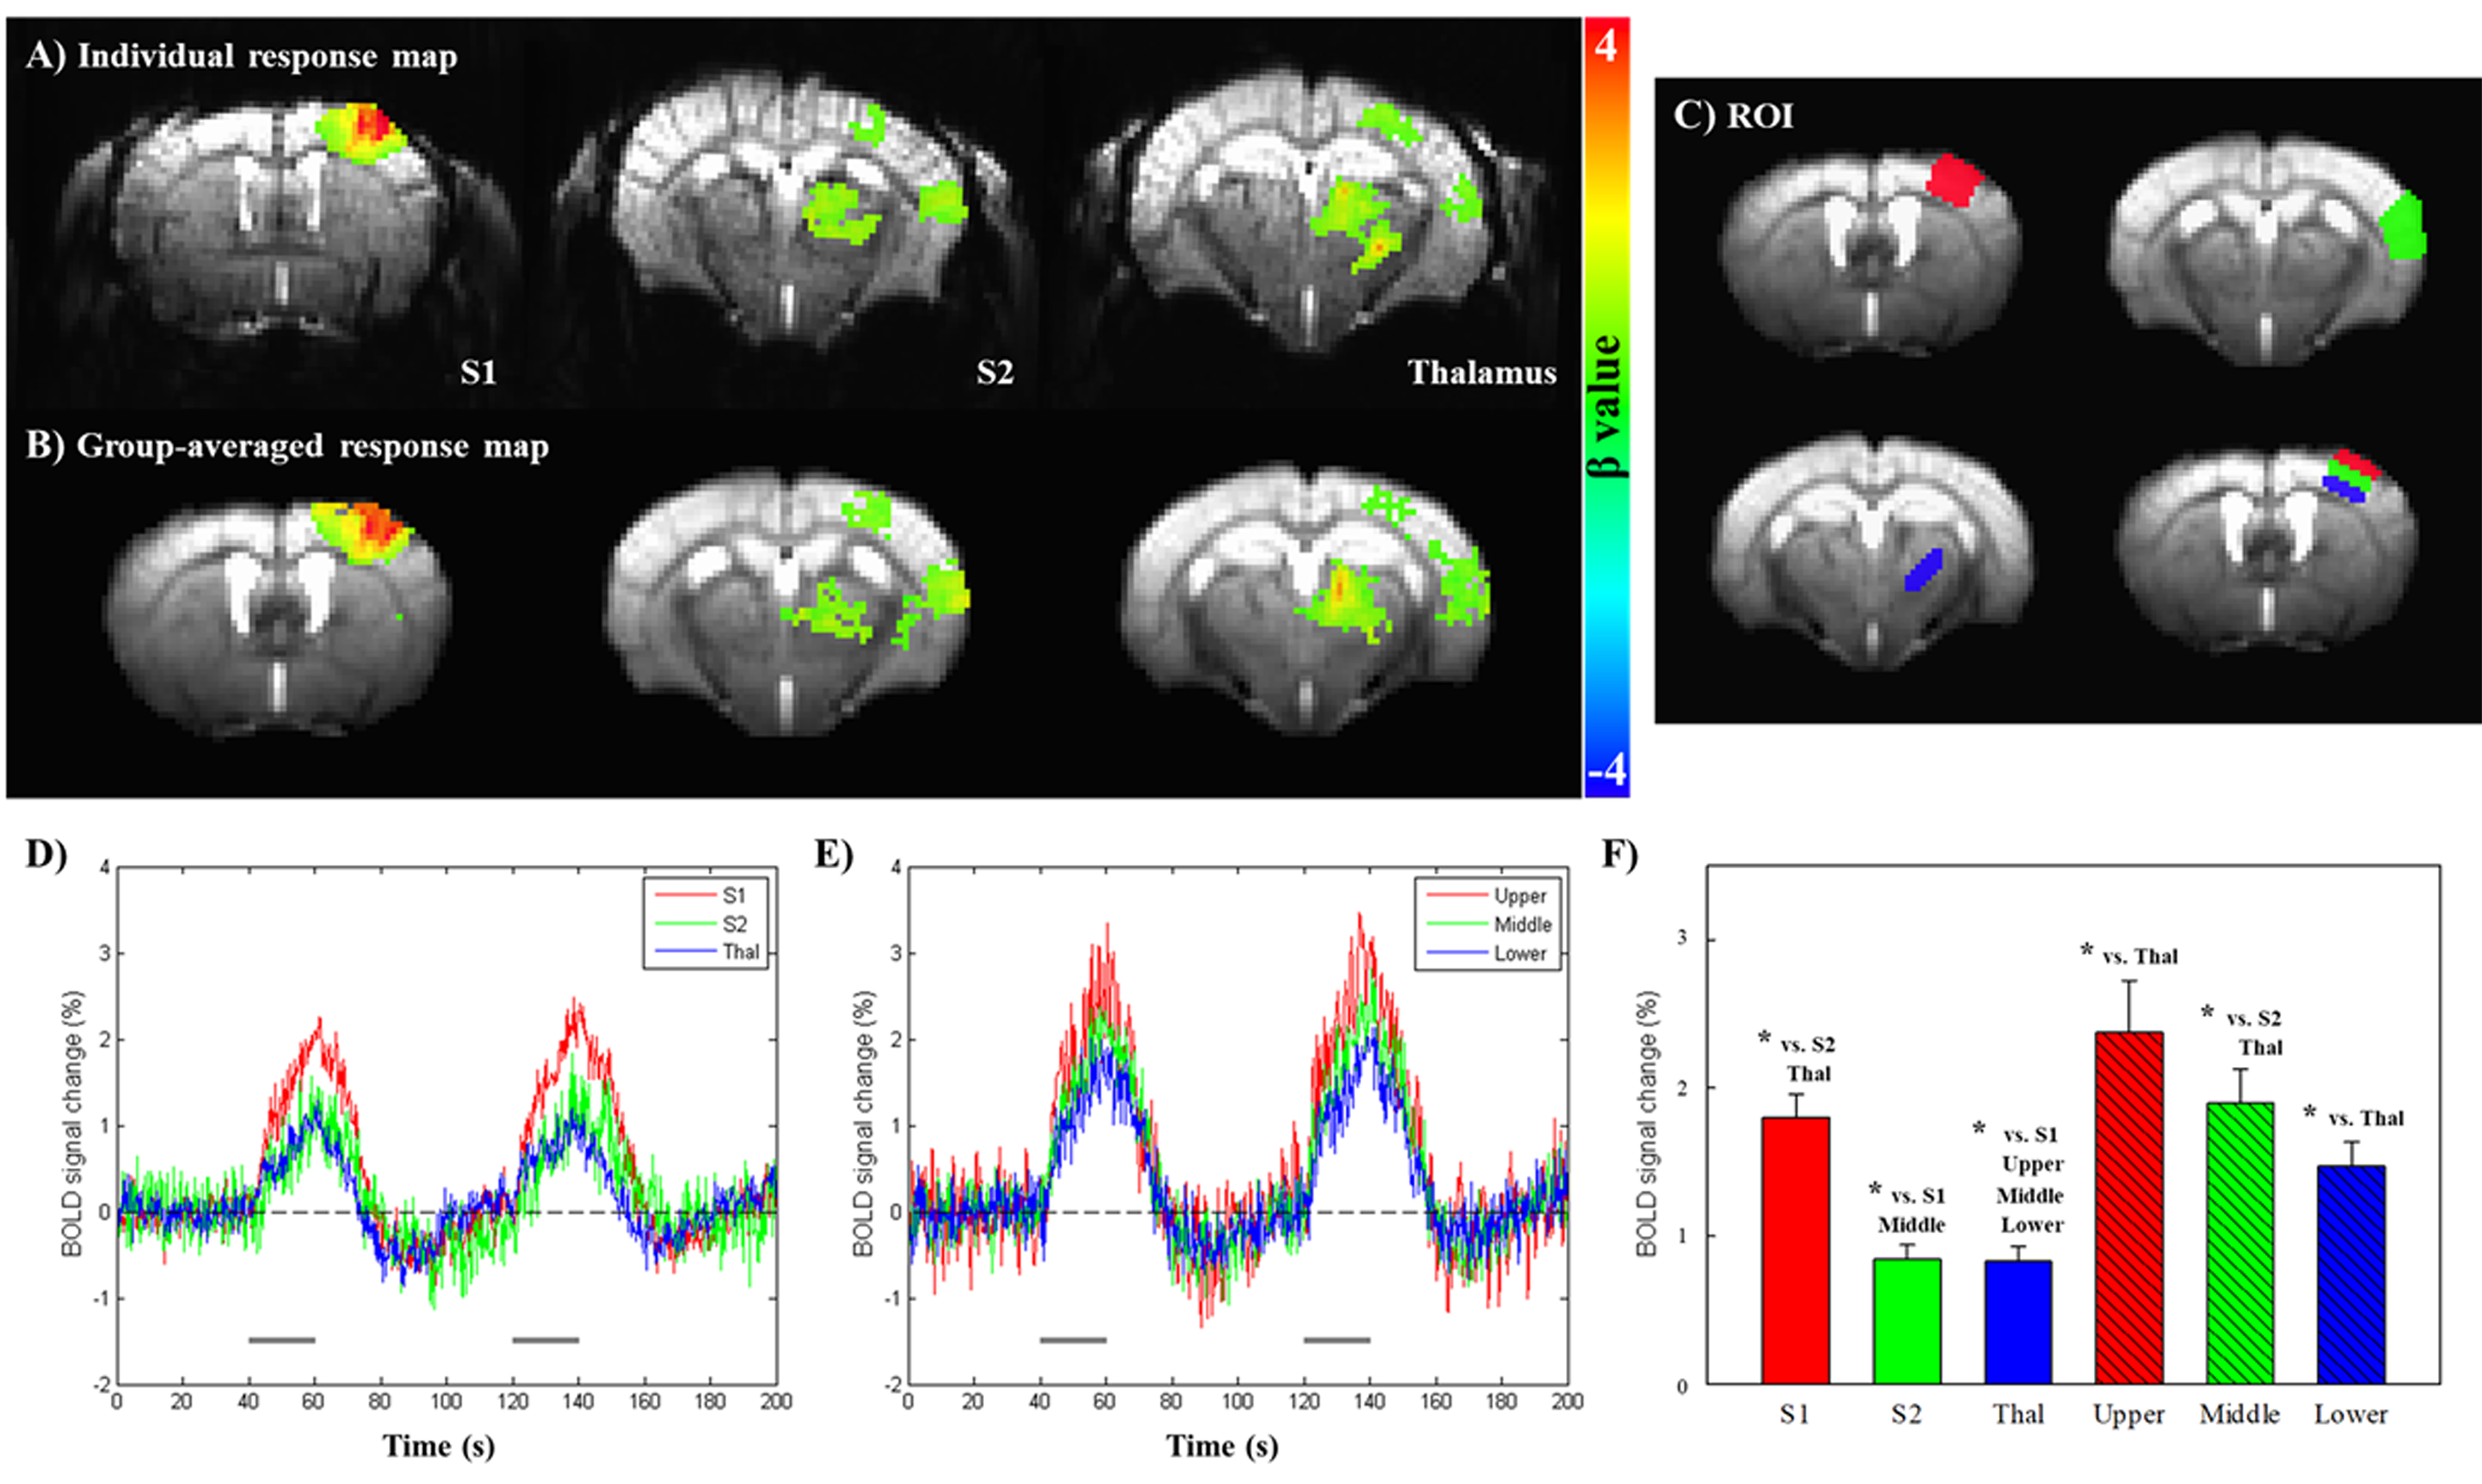
Fig.1A and 1B show BOLD fMRI maps from one representative animal (p<0.001, cluster size>30) and group averaged fMRI data (one-sample t-test, p<0.05, cluster size>30), respectively. BOLD responses were clearly observed in S1, S2 and thalamus contralateral to the stimulated forepaw. Fig.1D and 1E show the temporal BOLD signals obtained from the six ROIs (Fig.1C). Since the signal did not return to the baseline before the second stimulus began, subsequent quantitative analyses were performed only for the first stimulus data. The S1 (1.80±0.15%) showed the strongest BOLD response, whereas S2 (0.85±0.09%) and thalamus (0.83±0.10%) showed smaller amplitudes (Fig.1F). Within S1 layers, the largest BOLD signal changes were detected in the upper region comprised of layer I–III (2.37±0.35%), where the large draining veins are concentrated, and decreased monotonically with cortical depth (middle, 1.90±0.23%; lower, 1.47±0.17%).
To assess the response characteristics across ROIs, temporal BOLD signals during the first stimulus interval were fitted (Fig.2A). All of the normalized fitting curves were shown in Fig.2B with the expanded time courses showing the detailed onset times. We found that thalamus response (2.15±0.29s) was most rapidly evoked and S2 response (3.98±0.32s) was most delayed, but not statistically significant. The offset time in thalamus (14.87±0.87s) is faster than S1 (19.15±0.75s) and S2 (18.82±1.00s). Within S1 layers, the onset response of the middle layer (2.33±0.45s) was slightly faster than that of the upper (2.68±0.20s) and lower (2.62±0.41s) layers.
Discussion & Conclusion
In the functional processing, the earliest neural response occurs in the thalamus at 5~10ms after the sensory stimulus5, followed by activity in the layer IV of S1 in the following ~5ms6. The signal from layer IV is finally propagated into other cortical layers with a delay of ~5ms7. The S2 receive the afferents from thalamus in parallel with S18 and/or serially through S19. Our fMRI results have shown that the sequential order of BOLD onset times (thalamus->S1->S2) coincides with that of the expected neural pathway, indicating that inter-regional neural processing in the sub-millisecond scale may translate into a few hundred millisecond BOLD signal difference. The spatiotemporal responses across S1 layers also agreed with previous fMRI studies1,2. However, BOLD dynamic response results from the convolution of underlying neural activity with hemodynamic response10. Consequently, the HRF is sensitive to local vascular structures and density11. Thus, the interpretation of BOLD temporal characteristics to neural dynamics should be cautious.Acknowledgements
This work was supported by IBS-R015-D1References
1. Silva AC, Koretsky AP. Laminar specificity of functional MRI onset times during somatosensory stimulation in rat. Proc Natl Acad Sci U S A. 2002 Nov 12;99(23):15182-7.
2. Yu X, Qian C, Chen DY, et al. Deciphering laminar-specific neural inputs with line-scanning fMRI. Nat Methods. 2014 Jan;11(1):55-8.
3. Paxinos G. The rata nervous system, 4th ed. Academic press; 2014.
4. Jung WB, Shim HJ, Kim SG, Mouse BOLD fMRI at 15.2 T: Detection of entire sensory pathway including thalamic nuclei. Proc. Intl. Soc. Mag. Reson. Med. 2018;26:2382
5. Ahissar E, Sosnik R, Haidarliu S. Transformation from temporal to rate coding in a somatosensory thalamocortical pathway. Nature. 2000 Jul 20;406(6793):302-6.
6. Aguilar J, Morales-Botello ML, Foffani G. Tactile responses of hindpaw, forepaw and whisker neurons in the thalamic ventrobasal complex of anesthetized rats. Eur J Neurosci. 2008 Jan;27(2):378-87.
7. Armstrong-James M, Fox K, Das-Gupta A. Flow of excitation within rat barrel cortex on striking a single vibrissa. J Neurophysiol. 1992 Oct;68(4):1345-58.
8. Liao CC1, Chen RF, Lai WS, et al. Distribution of large terminal inputs from the primary and secondary somatosensory cortices to the dorsal thalamus in the rodent. J Comp Neurol. 2010 Jul 1;518(13):2592-611.
9. Brett-Green B, Paulsen M, Staba RJ, et al. Two distinct regions of secondary somatosensory cortex in the rat: topographical organization and multisensory responses. J Neurophysiol. 2004 Mar;91(3):1327-36.
10. Kim SG, Ogawa S. Biophysical and physiological origins of blood oxygenation level-dependent fMRI signals. J Cereb Blood Flow Metab. 2012 Jul;32(7):1188-206.
11. Handwerker DA, Ollinger JM, D'Esposito M. Variation of BOLD hemodynamic responses across subjects and brain regions and their effects on statistical analyses. Neuroimage. 2004 Apr;21(4):1639-51.
Figures