1045
Stirred CSF Measured by Low b-value DTI1Healthcare Business Unit, Hitachi, Ltd., Tokyo, Japan, 2Research and Development Group, Hitachi, Ltd., Tokyo, Japan, 3Diagnostic and Interventional Radiology, Hokkaido University Hospital, Sapporo, Japan
Synopsis
Cerebrospinal fluid (CSF) plays an important role in clearance systems of the brain. There have been many studies on bulk flow of CSF; however, there have been few studies on complex flow like pseudo-random movement of CSF. In this paper, we investigate locally “stirred” CSF by using low b-value diffusion tensor imaging (DTI). Measured DTI shows inhomogeneous physiology of CSF, including extremely high and anisotropic diffusion tensors around the middle-cerebral artery. It demonstrates that the low b-value DTI will be useful in estimating local drainage of CSF.
Introduction
Neurofluids, cerebrospinal fluid (CSF) and interstitial fluid (ISF), have been attracting a lot of attention because they deeply relate to clearance of waste products, and thus, to several neuronal diseases including Alzheimer’s1,2. The physiology of neurofluids has been analyzed by measuring bulk flow of CSF3, deposits and kinetics of contrast agents4,5, and diffusion of ISF6. Recently, low b-value diffusion tensor imaging (DTI) was reported to be useful in analyzing CSF flow in the perivascular space of the middle cerebral artery (MCA) of rats7. The low b-value DTI is expected to be useful in analyzing the complex flow of CSF, especially for pseudo-random molecular movement representing intra-voxel incoherent flows; however, to the best of our knowledge, there has been no report of applying low b-value DTI to analyze CSF physiology of humans. The purpose of this study was to investigate locally “stirred” CSF using the low b-value DTI.Methods
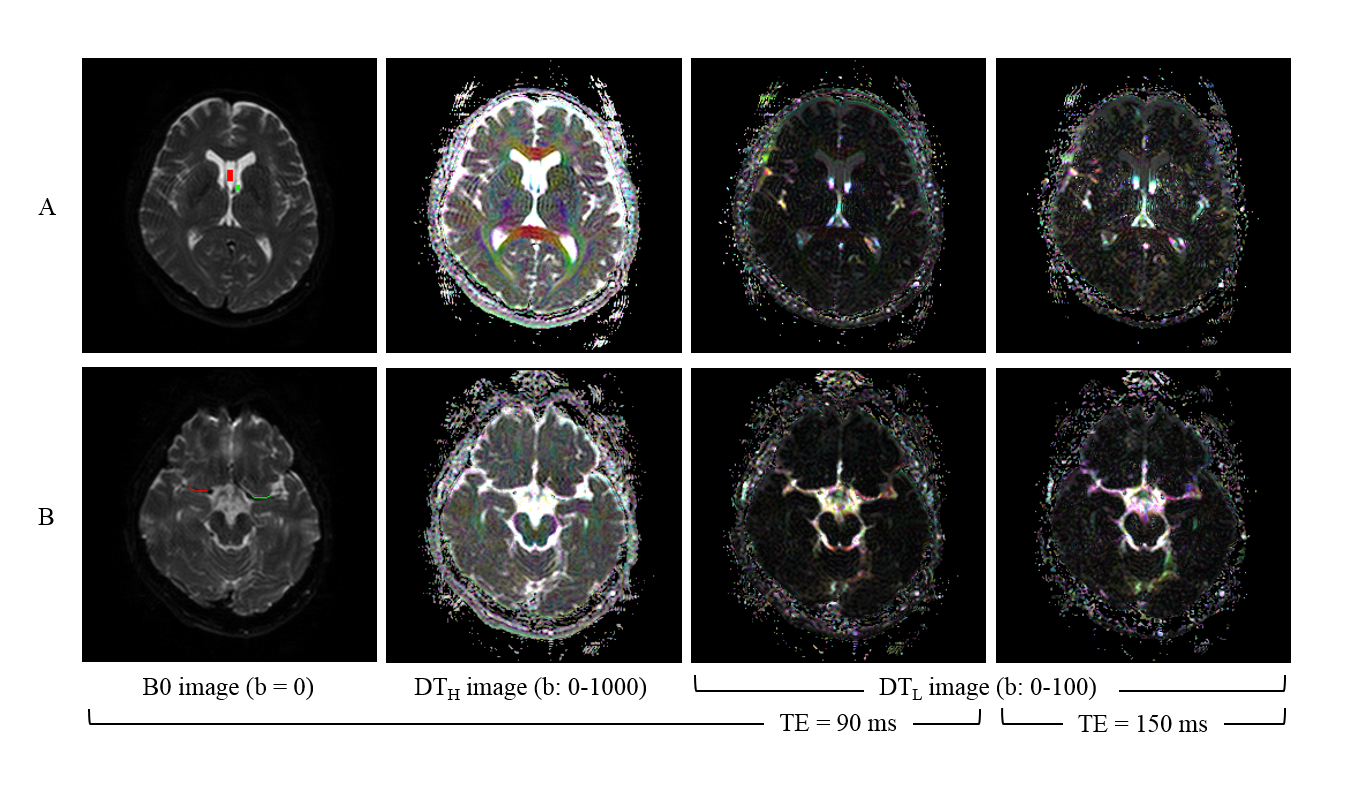
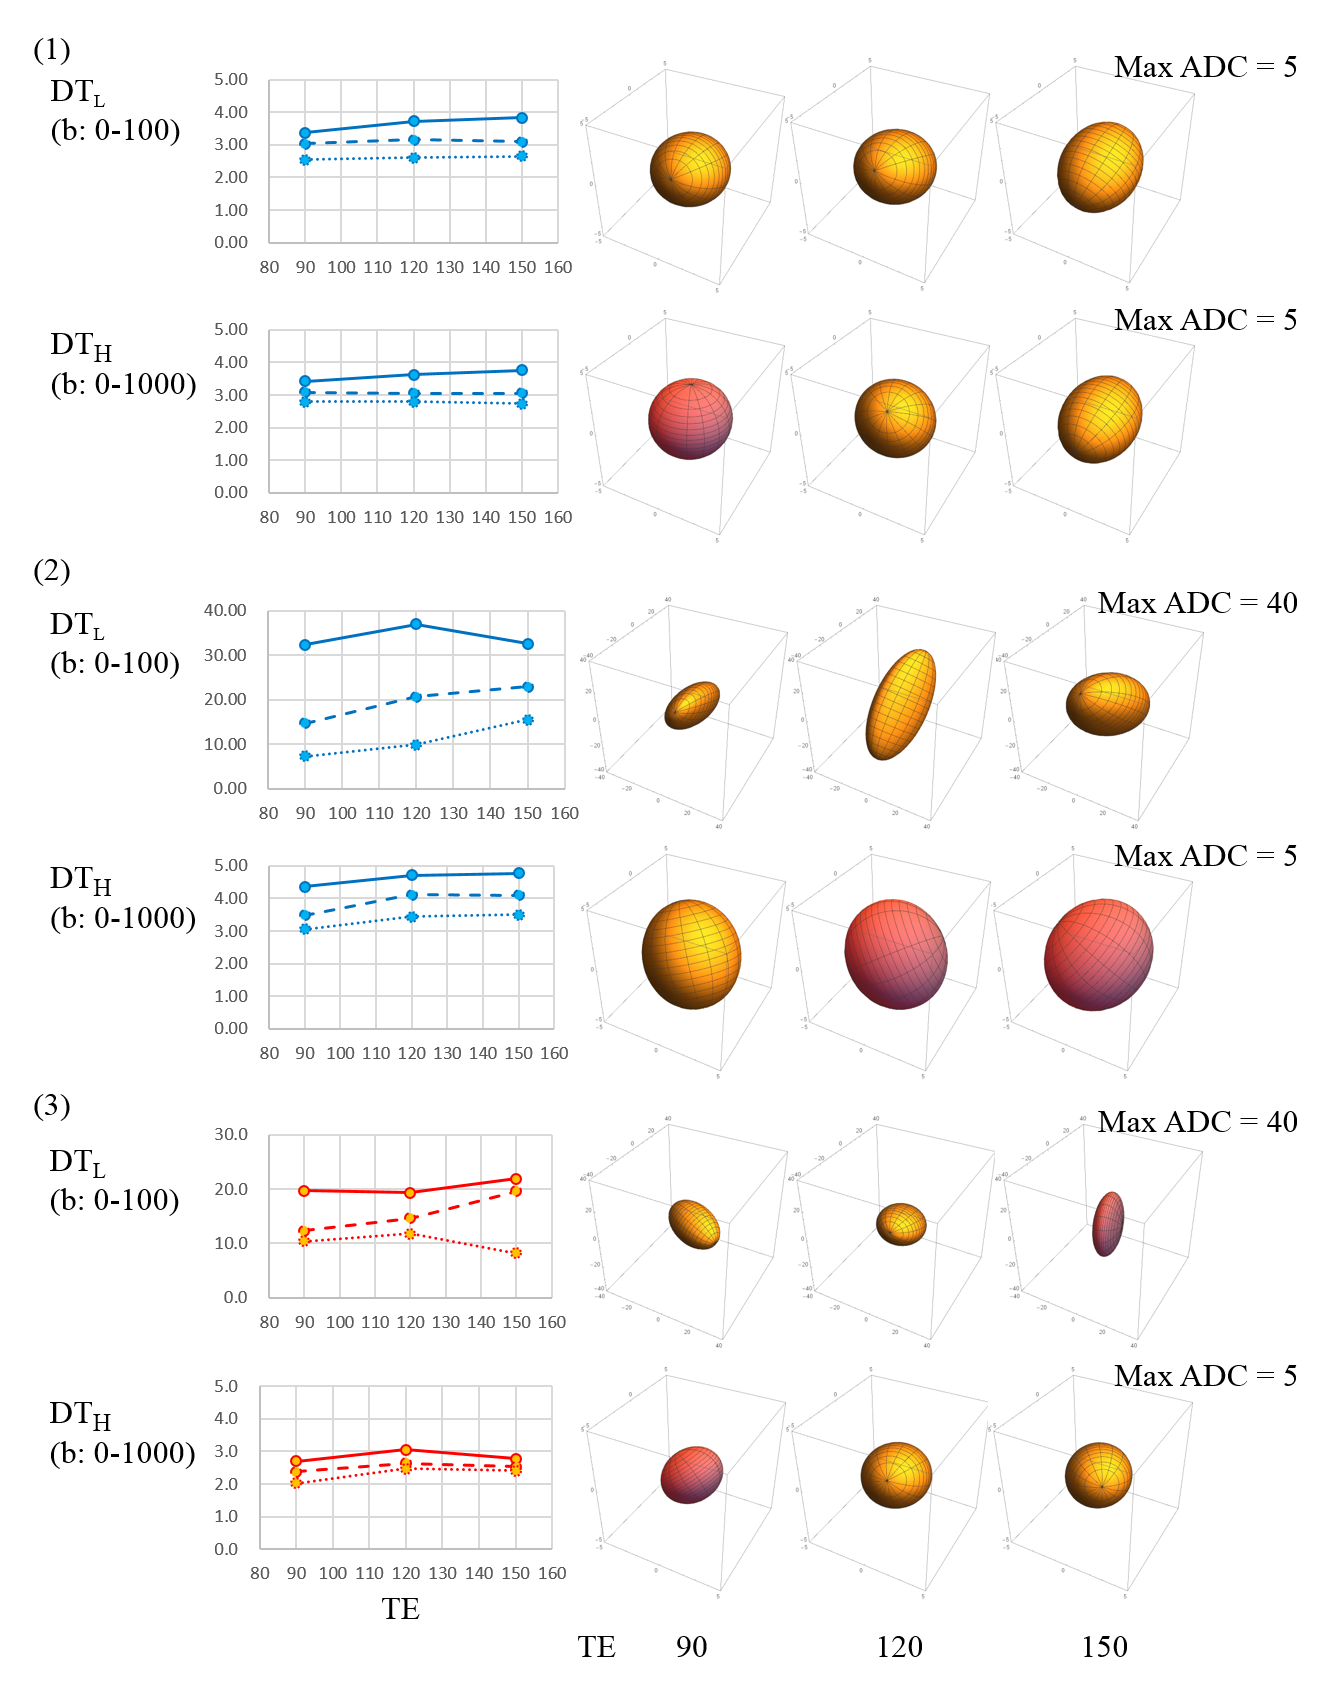
This study was approved by the ethics committee of Hitachi Group. A healthy male volunteer was scanned using a 3-T MRI (Hitachi, Ltd., Tokyo, Japan). Diffusion-weighted echo-planar imaging was performed with TR = 10 s, TE = 90/120/150 ms, FOV = 240 mm, matrix = 256 × 256, slice thickness = 4 mm, number of slice = 30, and b = 0/100/1000 ×106 s/m2 with 15 directions. Two diffusion tensors (DTs) were calculated: low b-value DT (DTL) using b: 0-100 and high b-value DT (DTH) using b: 0-1000 for each TE. To analyze the diffusion property of CSF precisely, DTs were evaluated (1) at the cavum septi pellucidi, (2) near the foramen of Monro, and (3) around the right and left MCAs (Fig. 1). Eigenvalues of the DTs were calculated and shown as spherical ellipsoids in each region. To observe the diffusion property of whole CSF, DTs were visualized using a 3D map.Results and Discussion
DTH images show well-known brain structures; however, DTL images show particularly higher and anisotropic segments in CSF (Fig. 1). Precisely analyzed DTs in the three regions clearly show these differences (Fig. 2). At the cavum septi pellucidi, DTL and DTH are similar and are like free-water. Near the foramen of Monro, DTL is extremely high and anisotropic, whereas DTH is a little bit higher than that of free-water. Around the MCAs, DTL is also extremely high and anisotropic, whereas DTH is like free-water. Furthermore, the DTL-ellipsoid changes from prolate to oblate as TE increases. The extremely high and anisotropic DTL near the foramen of Monro is caused by a fast flow from the third to fourth ventricles. The high and anisotropic DTL around the MCA is thought to be caused by beating artery and parenchyma. The change in shape of the ellipsoid may be caused by increased incoherency perpendicular to the MCA and reduced signal fraction of water moving along the MCA with extended TE.
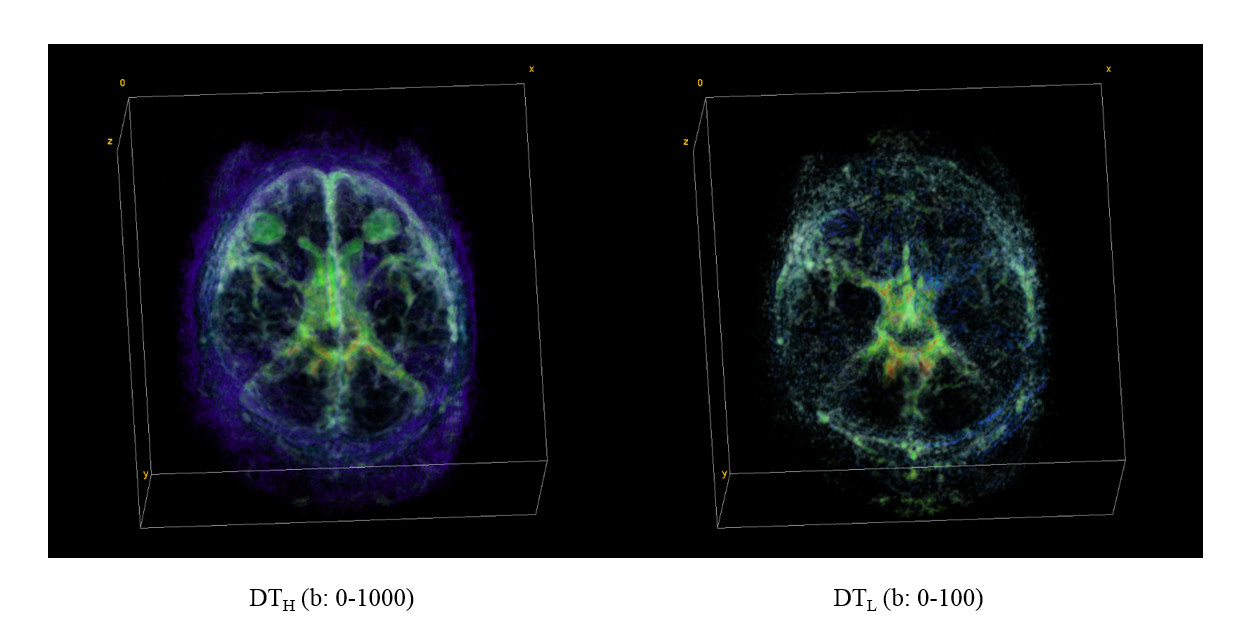
The 3D maps of DTH and DTL show different aspect of CSF; DTH show free-water segments, whereas DTL can show locally “stirred” subsegments of CSF (Fig. 3). The “stir” map using DTL may provide information about how fast waste is drained over whole CSF. The low b-value DTI has an advantage in estimating local drainage over the measurement of bulk flow using a phase-contrast technique, because the technique only reflects intra-voxel coherent flow. However, the low b-value DTI has a disadvantage in estimating overall circulation in a global region. Thus, the combined analysis of these two techniques is expected to provide further insight into CSF physiology. Although further improvement is needed in measurement and analysis technologies, the low b-value DTI will shed a light on clearance system in the brain from locally “stirred” CSF.
Conclusion
A low b-value DTI can clearly measure locally “stirred” CSF, whereas a commonly used DTI cannot. The low b-value DTI is expected to be useful in investigating CSF physiology related to the mechanisms of neuronal diseases.Acknowledgements
No acknowledgement found.References
1. Louveau A, et al. Structural and functional features of central nervous system lymphatics. Nature 2015; 523: 337-341.
2. Iliff JJ, et al. A paravascular pathway facilitates CSF flow through brain parenchyma and the clearance of interstitial solutes, including amyloid β. Sci Transl Med 2012; 4: 147ra111.
3. Brinker T, et al. A new look at cerebrospinal fluid circulation. Fluids and Barriers of the CNS 2014; 11: 10.
4. Taoka T, Naganawa S. Gadolinium-based contrast media, cerebrospinal fluid and the glymphatic system: possible mechanism for the deposition of gadolinium in the brain. Magn Reson Med Sci 2018; 17: 111-119.
5. Kudo K, et al. Indirect proton MR imaging and kinetic analysis of 17O-labeled water tracer in the brain. Magn Reson Med Sci 2018; 17: 223-230.
6. Taoka T, et al. Evaluation of glymphatic system activity with the diffusion MR technique: diffusion analysis along the perivascular space (DTI-ALPS) in Alzheimer’s disease cases. Jpn J Radiol 2017; 35: 172-178.
7. Harrison IF, et al. Non-invasive imaging of CSF-mediated brain clearance pathways via assessment of perivascular fluid movement with diffusion tensor MRI. eLIFE 2018; 7: e34028.
Figures