1043
Whole Brain Mapping of Subcortical U-fibers in the Human Connectome Project Data1Department of Radiology, Peking Union Medical College Hospital, Peking Union Medical College & Chinese Academy of Medical Sciences, Beijing, China, 2New York University School of Medicine, New York, NY, United States
Synopsis
Although reconstruction of subcortical U-fibers from diffusion MRI data has been demonstrated before, systematic examination of U-fibers
Introduction
Subcortical U-fibers refer to thin axonal bundles beneath the cortical gray matter connecting adjacent cortical regions of the brain. As each cortical region plays distinct functional roles, knowledge on region specific U-fibers or short association bundles will provide insights into the functional organization of the cortex. The feasibility of reconstructing selected U-fibers has been reported previously 1-3. A recent report further demonstrated the use of cortical parcellation maps (with 18 distinct cortical regions) to reconstruct 22 U-fiber groups 4. Detailed analysis on the distribution of U-fibers throughout the brain, however is still lacking. In this study, we used a detailed cortical parcellation map with 78 distinct cortical regions to map more than 200 U-fibers in 60 subject data from the human connectome project (HCP) 5.Introduction
Methods
Co-registered structural T1-weighted images and diffusion MRI data from the HCP dataset (30 M/30 F, 1.25 mm isotropic spatial resolution) were segmented into 286 brain regions, including 78 cortical regions, using a multi-atlas based brain parcellation pipeline 6. Resting-state fMRI time series data from the same subject were also processed for artifact removal, motion correction, and registration to the standard space. Based on whole brain tractography results (MRtrix followed with SIFT 6), streamlines that connect 278 pairs of adjacent cortical regions as well as streamlines that originate and end in one cortical region were selected. A morphological filter was then used to select only streamlines that demonstrate distinct U-shapes as described in 4. These U-fibers were then grouped based on their connectivity to cortical regions, and U-fibers from individual subjects were then spatially normalized to a common template in the MNI space to generate group average maps of U-fibers.Methods
Results
Results
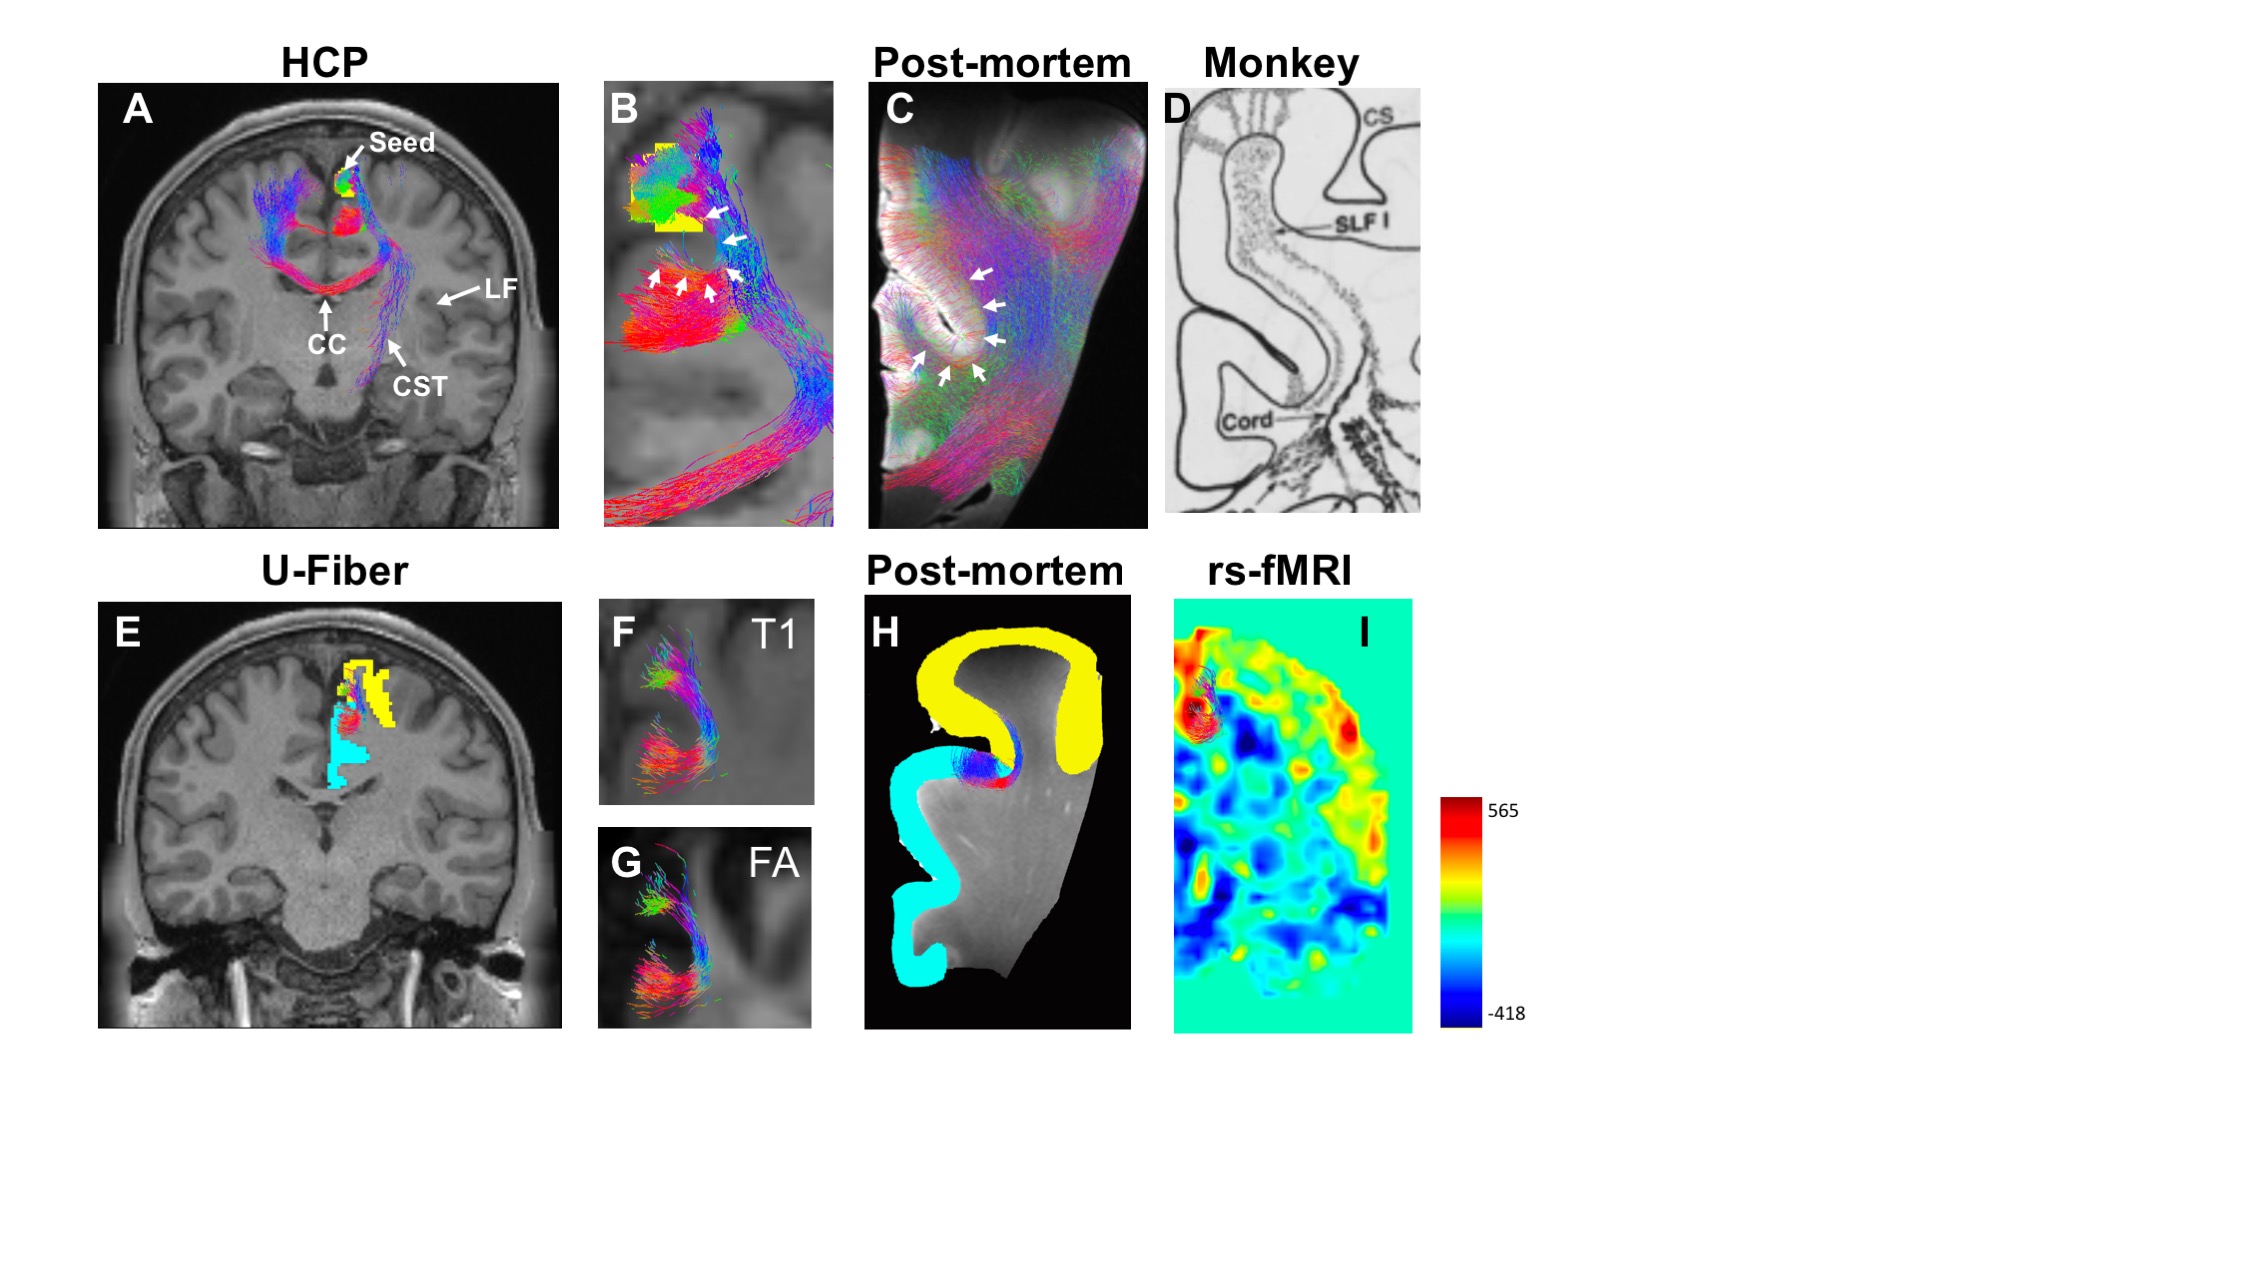
Tractography starting from the superior frontal gyrus (SFG, seed in Fig. 1A) produced long streamlines entering the corpus callosum and cortical spinal tract as well as short streamlines travelling to the neighboring cingulate cortex (indicated by white arrows in Fig. 1B). High-resolution post-mortem human brain dMR tractography (Fig. 1C) showed similar patterns. In both data, these streamlines traveled right beneath the folding cortical mantle (cingulate sulcus) and formed the characteristic U shape. They are comparable to the chemical tracer results from the rhesus monkey brain (Fig. 1D) .
Fig. 1E demonstrates the U-fibers reconstructed by simultaneously applying the SFG and dorsal anterior cingulate cortex (ACC) as constraints. Overlaid on T1 and FA images (Fig. 1F-G), the selected streamlines travelled near the WM-GM boundaries beneath the cingulate sulcus and had the U-shape. In a post-mortem sample, similar procedure produced similar U-fibers, suggesting the spatial resolution of the HCP data was sufficient for extraction of major subcortical U-fibers (Fig. 1H). In the resting-state fMRI data of the same subject, the functional correlation between the two adjacent cortical regions are relatively high between the u-fiber connected regions (Fig. 1I).
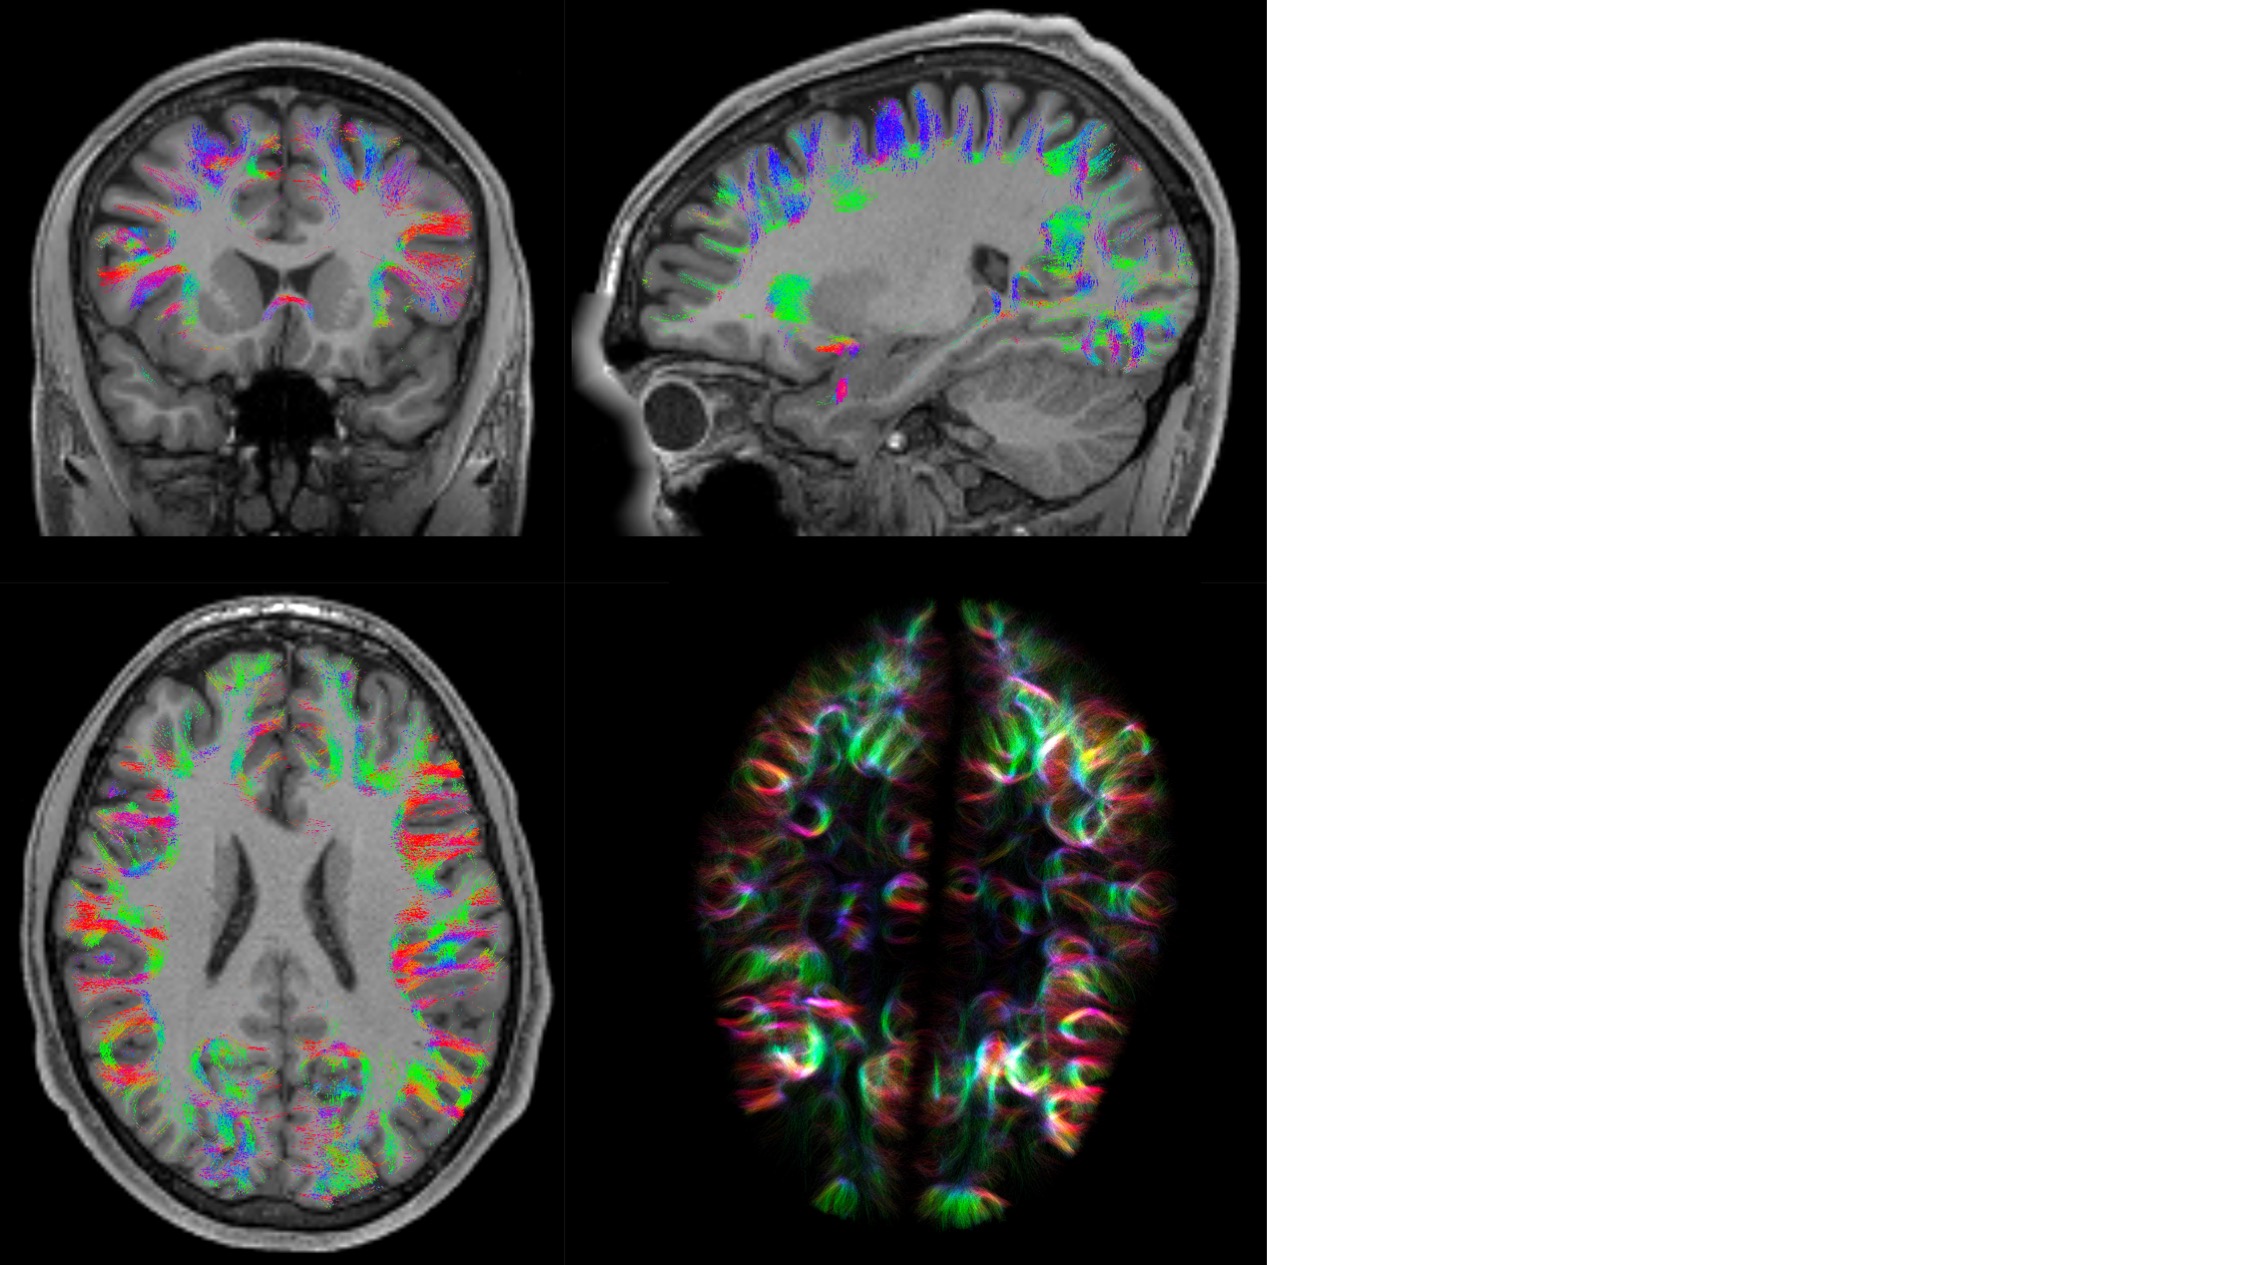
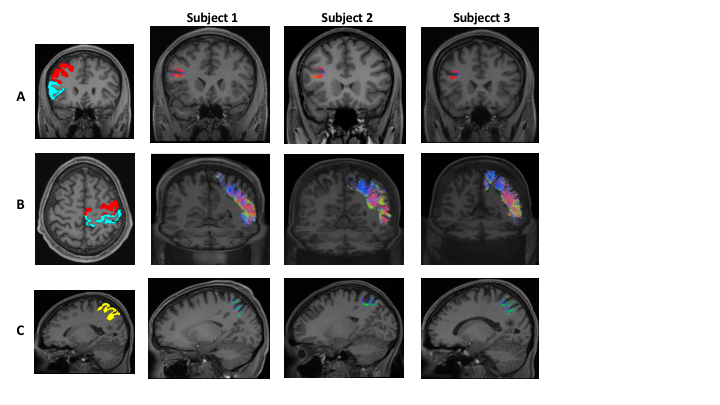
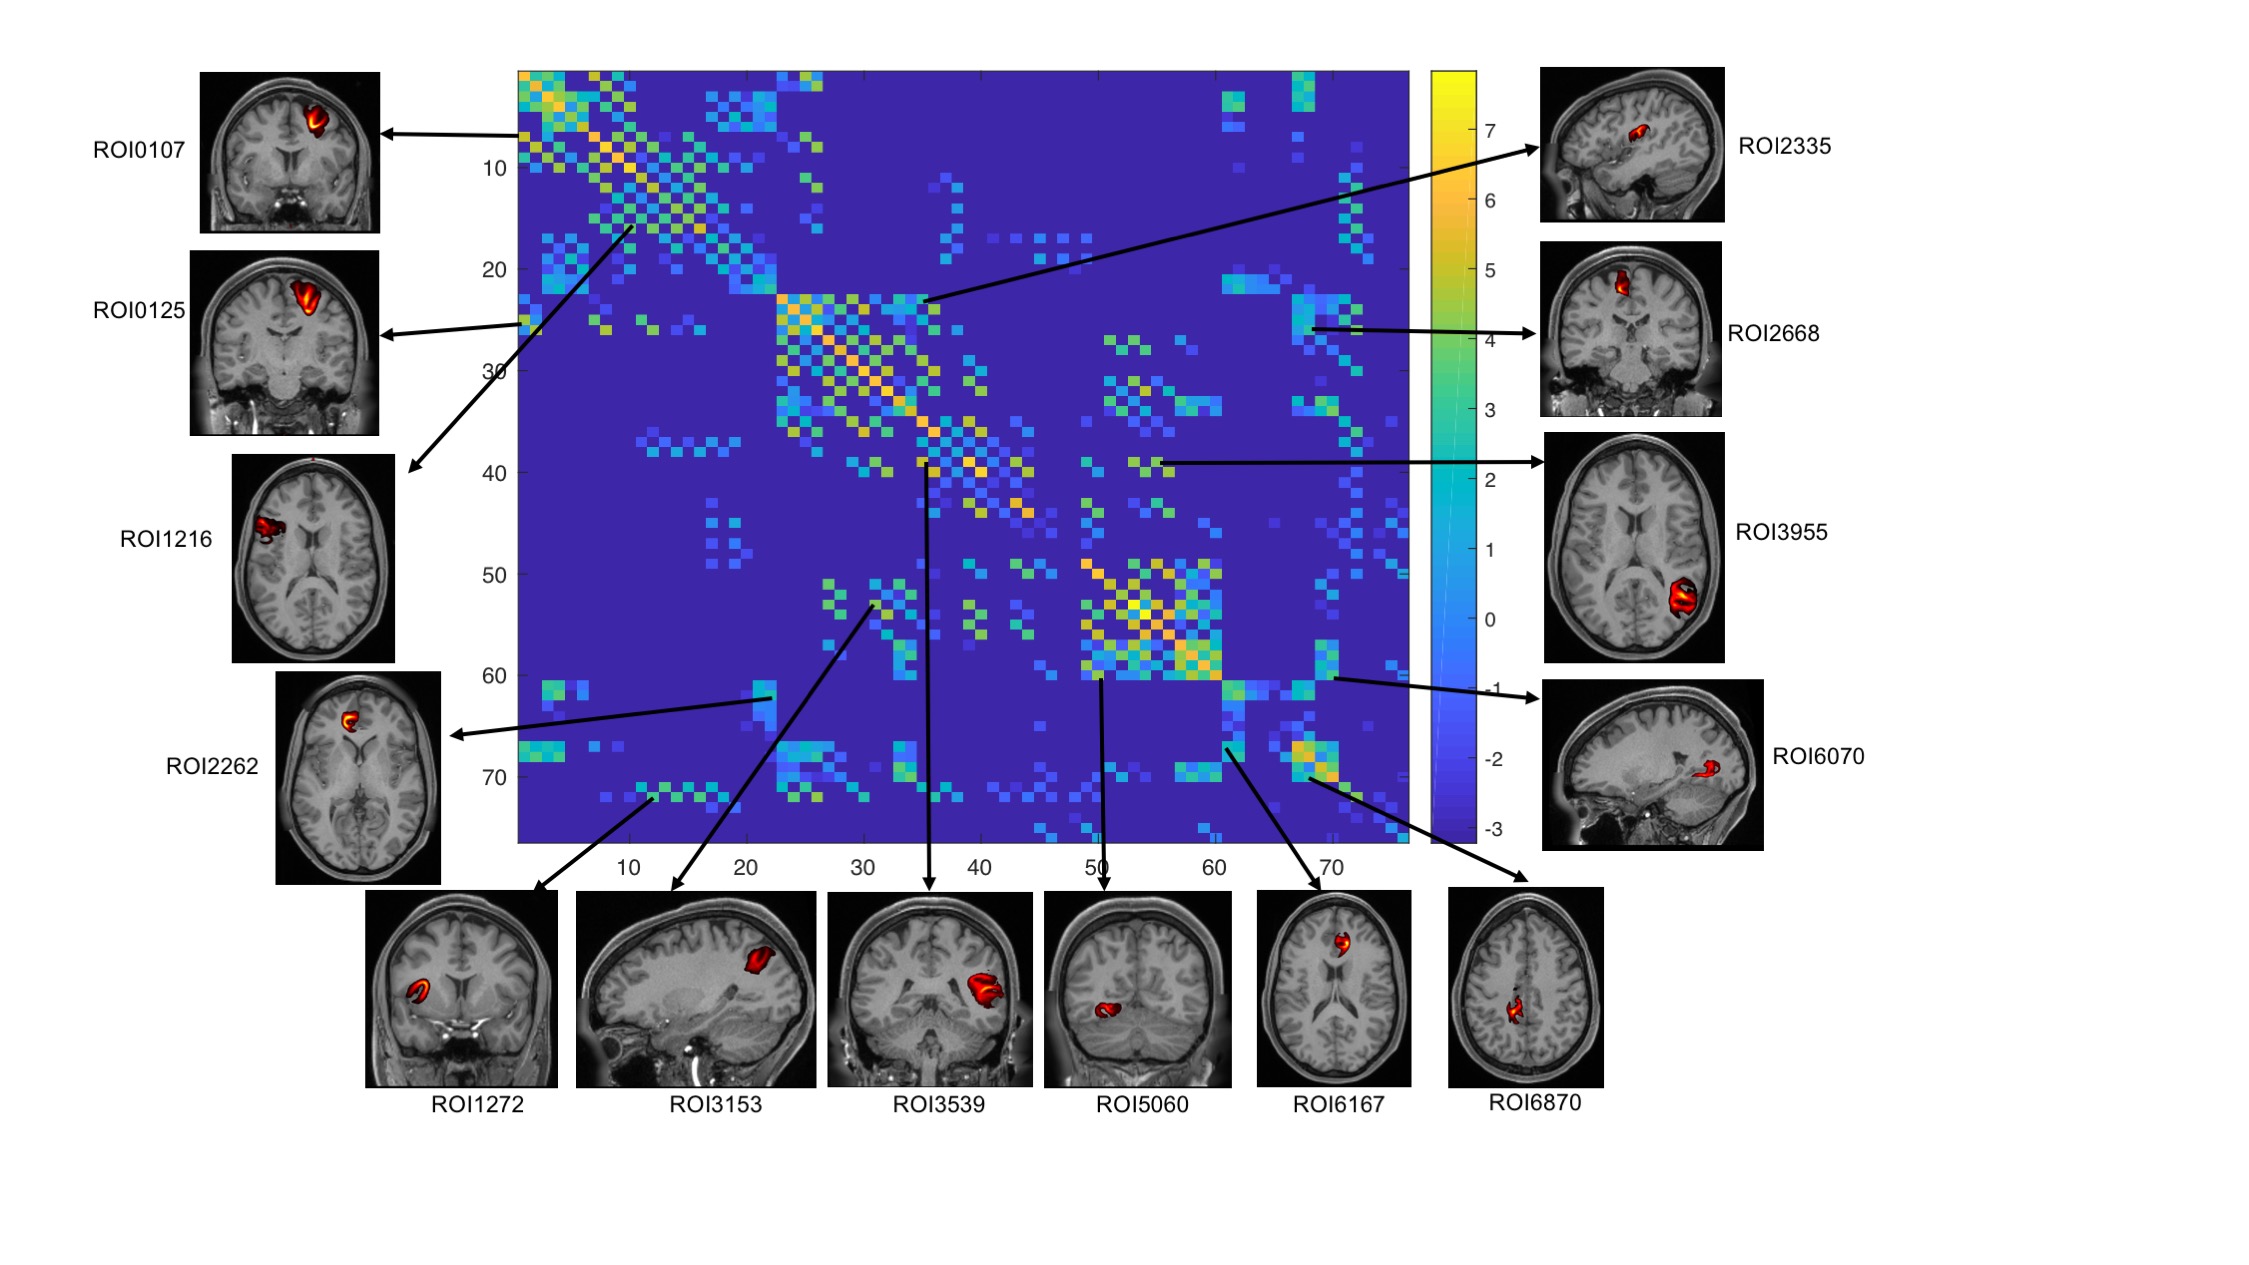
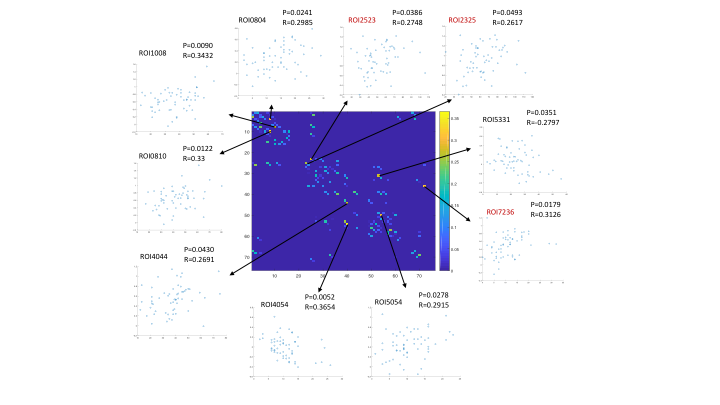
Using whole brain tractography with SIFT and filtering based on fiber morphology, whole brain cortical U-fibers were reconstructed. Fig. 2 shows representative U-fibers from a single subject data. We found single or multiple U-fibers connecting two adjacent but functionally distinct cortical regions (Fig. 3A-B) and also multiple U-fibers within one cortical region (Fig. 3C). By mapping all subject data to a selected template, the group average U-fiber were generated, and the average connectivity matrix of the 57 subjects is shown in Fig. 4. Comparing the connectivity matrices of U-fibers and among cortical regions in rs-fMRI showed several regions with significant correlations between streamline fiber numbers and BOLD signal correlation (Fig. 5).
Discussion
High-resolution dMRI data and detailed cortical parcellation are key for reconstruction of sub-cortical U-fibers. High-resolution data also allow more accurate parcellation of the cortex, which can then be used to select U-fibers from whole brain tractography results automatically. The current cortical parcellation was based on anatomical features. Detailed parcellation based on functional connectivity7 may further improve our ability to dissect U-fibers and increase the correlation between structural and functional connectivity measurements.Validation of the reconstructed U-fibers remains a challenging task. Although the trajectories of selected U-fibers were comparable to results from post- mortem human brain dMRI data and chemical tracer data from monkey brains (Fig. 1), the trajectories of other U-fibers remain to be examined carefully.Discussion
Conclusion
The in vivo understanding of human brain network system is far from being complete. With the high-resolution HCP datasets and 78-region cortical parcellation, we demonstrated systematic reconstruction of subcortical U-fibers in the human brain.Conclusion
Acknowledgements
Data Acknowledgement: Data were provided by the Human Connectome Project, WU-Minn Consortium (Principal Investigators: David Van Essen and Kamil Ugurbil; 1U54MH091657) funded by the 16 NIH Institutes and Centers that support the NIH Blueprint for Neuroscience Research; and by the McDonnell Center for Systems Neuroscience at Washington University.
Grants Acknowledgement: This work was partly supported by NIH Brain Initiative grants (R01 EB025133, R01 EB025133 02S1). This work was also performed under the rubric of the Center for Advanced Imaging Innovation and Research (CAI2R, www.cai2r.net), a NIBIB Biomedical Technology Resource Center (NIH P41 EB017183).
References
1 Guevara, M., Román, C., Houenou, J. & Neuroimage, D.-D. Reproducibility of superficial white matter tracts using diffusion-weighted imaging tractography. Neuroimage(2017).
2 Oishi, K., Huang, H., Yoshioka, T., Ying, S. H. & Brain ..., Z.-D. S. Superficially located white matter structures commonly seen in the human and the macaque brain with diffusion tensor imaging. Brain doi:10.1089/brain.2011.0005 (2011).
3 Song, A. W., Chang, H.-C., Petty, C., Guidon, A. & Chen, N.-K. Improved Delineation of Short Cortical Association Fibers and Gray/White Matter Boundary Using Whole-Brain Three-Dimensional Diffusion Tensor Imaging at Submillimeter Spatial Resolution. Brain Connectivity4, 636-640, doi:10.1089/brain.2014.0270 (2014).
4 O'Halloran, R., Feldman, R., Marcuse, L. & ..., F.-M. A Method for U-Fiber Quantification from 7T Diffusion-Weighted MRI Data Tested in Subjects with Non-Lesional Focal Epilepsy. ...(2017).
5 Essen, V. D. C., Smith, S. M., Barch, D. M. & Neuroimage, T. E. J. The WU-Minn human connectome project: an overview. Neuroimage(2013).
6 Smith, R. E., Tournier, J. D., Calamante, F. & Neuroimage, C.-A. SIFT: spherical-deconvolution informed filtering of tractograms. Neuroimage(2013). 7 Glasser, M. F.et al.A multi-modal parcellation of human cerebral cortex. Nature536, 171-178 (2016).
Figures